TOC Head: ; Section Head: ; Article Type: ARTICLE Crop Breeding & Genetics
Comparative Study of the Developmental Traits and Yield Components of Bread Wheat under Field Conditions in Several Years of Multi-Sowing Time
Experiments
Tibor Kiss,* Judit Bányai, Krisztina Balla, Marianna Mayer, Zita Berki, Ádám Horváth, Ottó Veisz, Zoltán Bedő, and Ildikó Karsai
Agricultural Institute, Centre for Agricultural Research, Hungarian Academy of Sciences, H-2462 Martonvásár, Hungary. Received 3 Sept. 2018. Accepted 1 Dec. 2018. *Corresponding author (kiss.tibor@agrar.mta.hu).
Assigned to Associate Editor Jochum Wiersma.
Abbreviations: AET, average thousand-kernel weight; AS, average seed number per spike; ASW, average seed weight per spike; ETT, effective thermal time; GGE, genotype main effect plus genotype environment interactions; LIN, length of the last internode or peduncle; LSE, rapid steam elongation interval; MET, thousand- kernel weight on the main spike; MS, grain number on the main spike; MSW, grain weight on the main spike; PH2, average plant height measured form the base of main stem to the base of the main spike; PH3, average plant height measured from the base of the main stem to the top of the main spike; SG, rate of rapid stem elongation; SPIK, spikelet number on the main spike; SSP, seed number per spikelet; Z30, start of rapid stem elongation; Z31, first node appearance at the base of the main stem; Z3130, the interval between the early part of rapid stem elongation and first node appearance at the main spike; Z3011, from germination to the start of rapid stem elongation; Z49, spike located in the upper part of the flag-leaf sheath; Z4930, the interval between the early part of rapid stem elongation and booting; Z4931, the interval between the first node appearance to booting; Z59, spike fully emerged from the flag-leaf sheath; Z5949, the interval between booting and heading; ZSE, end of rapid stem elongation;
ZSE59, the interval from heading to the end of rapid stem elongation.
ABSTRACT
The main aim of the experiments was to demonstrate the possible correlation between developmental and morphological traits and yield components under variable climatic conditions. For this purpose, a collection of 188 wheat (Triticum aestivum L.) genotypes with a heterogeneous gene pool was included in a 3-yr field experiment applying normal and late sowing dates each year. Under these conditions, almost all the traits were significantly influenced by the genotype, which had the greatest effect on the morphological traits and yield components
(explaining 20–58 and 50–60% of the phenotypic variance for the two trait groups, respectively). In the case of plant development, however, the year effect, particularly in the late sowing treatment, was more significant than that of the genotype. Sowing date had the strongest effect on the early developmental phases, explaining 50% of the phenotypic variance, whereas the year had a significant influence on the late developmental phases, being
responsible for 37 to 53% of the phenotypic variance. The turning point between the two factors was during the first phase of rapid stem elongation. The environmental driven variation in developmental patterns led to significant variation in yield-related traits, which ranged from 4.6 (average thousand- kernel weight) to 16.3% (average seed number) with normal sowing, and from 2.9 (average seed weight) to 29.4% (average thousand-kernel weight) under late sowing conditions. The significance of the two intervals, from sowing to the start of rapid (intensive) stem elongation and from the start of stem elongation to the boot stage (Z49), was most apparent in the case of yield- related traits.
Vernalization requirement and photoperiod sensitivity are the basic components influencing plant developmental phases in cereals grown under continental conditions. After the saturation of these major developmental factors, there are other components that sense subsidiary
environmental signals, such as light intensity and ambient temperature. This continuous adjustment to environmental conditions ensures the fine-tuning of adaptive plant growth (Fornara et al., 2010). As climatic anomalies (taken here to mean weather conditions that are
unusual at any given time of year) are increasing both in magnitude and frequency, this affects not only fine-tuning mechanisms but also the major plant developmental responses (Porter and Semenov, 2005). It is therefore essential to establish the extent to which disturbances in plant developmental patterns negatively affect yield formation and to obtain detailed physiological and genetic knowledge on the starting date and length of various plant developmental phases. This will enable breeders to modify both the transition from the vegetative to the generative phase of the genotypes, by changing the scale of photoperiod-sensitivity and vernalization requirements, and the effectiveness of fine-tuning mechanisms (González et al., 2005; Borràs et al., 2009; Chen et al., 2009, 2010).
The length of the various developmental phases is an important factor determining the extent to which the yield potential of a genotype can be achieved under a given set of ecological
conditions (Slafer and Rawson, 1996; Araus et al., 2002; González et al., 2005; McMaster, 2005;
Borràs et al., 2009; Chen et al., 2009; Foulkes et al., 2011). One such adaptation process is a time shift in the rapid stem elongation phase (Fischer, 1985; Slafer and Rawson, 1994; Reynolds et al., 2009; García et al., 2011). The later timing of stem elongation helps to avoid frost damage in early spring, whereas earlier maturity helps to avoid hot dry weather during summer. Similarly, the relative duration of any two consecutive phases can be also important in determining the various yield components. A longer vegetative phase generates more biomass (due to the longer nutrient storage period), and an extended stem elongation phase is required to achieve a higher number of fertile florets or spikelets, whereas a longer grain-filling period may lead to increased grain weight in the spikes (Kirby, 1988; Slafer and Rawson, 1996; Miralles and Richards, 2000;
Whitechurch and Slafer, 2001, 2002; Araus et al., 2002; González et al., 2002, 2003a, 2005; Kiss et al., 2011; Dreccer et al., 2014; González-Navarro et al., 2015, 2016). A positive correlation was also found between the duration of photosynthetic activity in the flag leaf and the grain yield under optimal nutrient supplies (Gaju et al., 2011; Serrago et al., 2013; Borrill et al., 2015). The time between first node appearance and the start of rapid stem elongation had a significant effect on the number of reproductive tillers, and a close association was observed between the second half of rapid stem elongation (from the boot stage to heading) and the number of spikelets per spike (Miralles and Richards, 2000; Whitechurch and Slafer, 2001, 2002; Kiss et al., 2011, 2014). Extending the duration of phase intervals with a decisive influence on yield components without modifying the total time to anthesis has been proposed as a promising breeding tool, but this requires detailed knowledge of the mechanism of the genetic and environmental regulation of the start and duration of various phases and their interactions (Chen et al., 2009, 2010).
However, variations in environmental parameters in different years under field conditions may lead to considerable variability in phenotypic responses, often leading to contradictory results (Snape et al., 1985; Worland, 1996; Worland et al., 1998; Kato et al., 2000). A close relationship has also been detected between the yield potential of wheat (Triticum aestivum L.) and certain agronomic factors, such as sowing time (Kabesh et al., 2009; Nakano and Morita, 2009). It was observed that early sowing leads to higher yields, because a longer vegetative phase results in more biomass, and the formation of more productive tillers. More time is also available for storing larger quantities of nutrients, which is beneficial during grain filling (Whitechurch and Slafer, 2001; González et al., 2003a; Kiss et al., 2014). The importance of this research field is also underlined by the fact that neither the changes caused by global climatic changes in local climate conditions nor their effects on plant developmental strategies can be exactly predicted (Kiss et al., 2011). Therefore, a more comprehensive and quantitative understanding of the
TOC Head: ; Section Head: ; Article Type: ARTICLE
physiological and genetic determinants of time to heading and the partitioning of time among the phenophases of preflowering development would allow the fine-tuning of adaptation and the optimization of development for maximum yield potential under both present and future conditions.
Thus, it is extremely important to characterize the variation existing in cereal germplasm in various plant developmental phases and to identify the factors that contribute to their genetic control. The study of early plant developmental phases, however, especially changes in apex structure and the timing of the stem elongation phase, requires the use of destructive methods such as apex dissection or the determination of the length of the hollow stem (Jamieson et al., 1998; González et al., 2005; Chen et al., 2009, 2010), which is a time-consuming process
limiting the number of samples that can be examined. In addition, the destructive nature of these examinations prevents the direct identification of associations between phenophase
characteristics and yield components (Kiss et al., 2011), thus underlining the importance of developing and improving nondestructive methods, such as the fully automated plant
phenotyping units that are suitable for monitoring developmental processes (Golzarian et al., 2011). These units are very costly and can only be used under controlled environmental conditions. There are, however, nondestructive phenotyping procedures that are cost effective and can be used efficiently even for large number of samples, not only under controlled
environmental conditions (e.g., phytotron, greenhouse), but also in the field (Large, 1954; Haun, 1973; Zadoks et al., 1974; Tottman and Makepeace, 1979; Waddington et al., 1983; Weir et al., 1984). Among these, Zadok’s decimal method has become the most widely used evaluation system, as it can be applied easily and accurately in both the vegetative and reproductive phases.
Growth analysis, involving the regular monitoring of changes in leaf number, is also relatively easy to implement. In this technique, the steepness of the equation characterizing changes as a function of chronological or thermal time, the reciprocal of which is the phyllocron, and can be evaluated for individual cultivars (Gallagher, 1979; Bauer et al., 1984; Clerget et al., 2008). In a similar way, the objective phenotyping method developed by Kiss et al. (2011) allows stem elongation to be characterized by matching regression equations of regular plant height measurement data over time, making it possible to determine the start and end of the stem elongation phase, as well as the slope of rapid stem elongation. These methods are suitable for studying the environment- and genotype-dependent variability of the length of each
developmental phase and for determining direct correlations between developmental phases and yield components in a large number of genetic materials.
The application of thermal instead of chronological time can make the comparison of experimental results more accurate over different years and environmental conditions (Weir et al., 1984; Porter, 1993; Gouache et al., 2012; Bogard et al., 2015). However, in species having genotypes with varying vernalization requirements and photoperiod sensitivity, such as wheat, the calculation of standard thermal time (summation of the daily average temperatures above the base temperature of growth) is not accurate enough when large numbers of genotypes are
involved in the analyses. Models have now been developed in which the thermal time effective to promote plant development is modified both by the rate of saturation of the vernalization requirement of a given genotype and by the daylength (Weir et al., 1984; Gouache et al., 2012;
Bogard et al., 2015).
In the present work, the developmental and morphological parameters and yield components of a large set of winter wheat cultivars with different geographic origin were examined in an experimental setup where the effects of different years and sowing times could be maximized to determine how plant developmental patterns changed in response to variations in climatic
components (temperature, rainfall, and solar irradiation). The aim was to determine (i) the extent to which genotype, year, sowing time, and their interactions explained the phenotypic variance of different developmental, morphological, and yield-related traits, and (ii) how associations
between plant developmental patterns and yield components were affected by climatic factors.
MATERIALS AND METHODS
Plant Materials and the Field Experiments
A total of 188 wheat cultivars were included in a series of field-sown experiments. These originated from the winter wheat gene bank of Centre for Agricultural Research, Hungarian Academy of Sciences, Martonvásár, Hungary, and were chosen to maximize phenotypic and genotypic diversity based on the breeding location and flowering data recorded in previous experiments (Supplemental Table S1). The field experiments were performed in three
consecutive years (2013– 2015) at the same location (Martonvásár) to allow the comparison of seasonal and sowing time effects. In each year, two sowing times were applied: normal sowings were performed around 10 October, and late sowings were performed around 15 November (2 d). The experimental design was the same in each year and sowing period. Due to the labor- intensive nature of phenology examinations and the large number of wheat genotypes included in two sowing time experiments, further doubling the time requirement of phenology examinations, a special and standardized experimental design was applied throughout the research program. A total of 186 wheat genotypes were sown without replication, and two cultivars (the early-heading
‛Mv Toborzó’ and the medium-late-heading ‛Mv Verbunkos’) used as controls were each sown in seven replications evenly spaced across the experimental field to provide an estimate of experimental error. Two rows of each genotypes were sown in each 0.4-m 2-m plot with rows spaced 20 cm, on a chernozem soil with average N, P2O5, and K2O contents of 60 kg N ha−1, 60 kg P2O5 ha−1, and 60 kg K2O ha−1 in autumn, and 60 kg N ha−1 in the beginning of spring.
Standard plant protection protocols were applied throughout the experiment (three to four times per season) to exclude the effects of diseases and pests.
Phenotypic Descriptions
Four healthy, near-uniform plants were chosen from each plot for regular measurement of plant height (twice a week). Regression equations fitted to the plant height measurements over time allowed the determination of the start (Z30), end (ZSE), and length (LSE) of rapid stem
elongation (Kiss et al., 2011). The steepness of the regression line (bmax) is indicative of the rate of rapid stem elongation (1/bmax, the time required for 1 cm of stem growth). In addition, the timing of three distinct developmental phases was also recorded based on the Zadoks scale (Tottman and Makepeace, 1979) as Z31 (first node appearance at the base of the main stem), Z49 (spike located in the upper part of the flag-leaf sheath), and Z59 (spike fully emerged from the flag-leaf sheath). Instead of using the standard thermal time protocol, the effective thermal time (ETT) was calculated based on the method of Bogard et al. (2015) for all developmental phases.
TOC Head: ; Section Head: ; Article Type: ARTICLE
The ETT is the sum of the daily average thermal time, modified with the daylength value and the saturation level of the average vernalization requirement of the plants: ETT = (TT FV FP), where TT is daily average thermal time, FV is the vernalization factor (being 0 before the saturation of the vernalization requirement), and FP is the photoperiod factor (being <1 under a 12-h photoperiod, proportional to the actual daylength).
The length of the last internode or peduncle (LIN) and the average plant height measured from the base of the main stem to the base of the main spike (PH2) or to the top of the main spike (PH3) were determined at the end of physiological maturity. The plants were grown to full maturity, and the following yield components were determined on five plants from all the
genotypes in each treatment: spikelet number on the main spike (SPIK), seed number on the main spike (MS), seed weight on the main spike (MSW), and total number and weight of seeds per plant. Using these data, the spike density, the number of seeds per spikelet (SSP), the thousand-kernel weight in the main spike (MET), the average seed number per spike (AS), and the average thousand-kernel weight (AET) were calculated.
Data Analysis
The STATISTICA 6 software package (StatSoft. 2008. User’s guide: ANOVA. StatSoft Inst., Tulsa, OK) was used for ANOVA with all effects (genotype, year, and sowing time) considered as random to estimate variance components (2) and broad-sense heritability (h2) representing the repeatability in this case. As there were no replicates available, the error term actually contained the genotype year sowing time components (Gebruers et al., 2010; Shewry et al., 2010). In addition, principal component analysis, linear and multiple regressions, and
multivariable analyses were also performed. GenStat (VSN International. 2015. User’ guide:
GGE biplot. VSN International Ltd., Hemel Hempstead, Hertfordshire) was used to apply the GGE (genotype main effect plus genotype environment interactions) principal biplot model (Yan, 2001). The GGE biplot analysis was conducted on the mean best linear unbiased estimate values of 188 wheat genotypes. The LSD values of the traits were calculated from the seven replications of the two control cultivars (‘Mv Toborzó’ and ‘Mv Verbunkos’).
RESULTS
The basic meteorological characteristics of the three growing seasons are presented in
Supplemental Fig. S1. All three growing seasons differed notably from each other and from the 30-yr means. What was common to all three seasons was the unusually warm November (monthly mean temperatures were 3C higher than the 30-yr mean) and the dry April, when the rainfall shortage was between −20 and −48 mm compared with the 30-yr mean. The temperature conditions in 2013 were close to average with the exception of an extremely cold March. Both 2014 and 2015, however, were warmer than the 30-yr mean, but although this warm period lasted from October to January in 2015, in 2014, the warm conditions prevailed almost throughout the growing season, from October to April. The total amount of rainfall during the three growing seasons was similar or close to the 30-yr mean (377 mm compared with 361 mm in 2013, 321 mm in 2014, and 322 mm in 2015). There were anomalies, however, in the
distribution of precipitation during the seasons in all 3 yr. In 2013, a dry autumn (October–
December) was followed by a wet winter (January–March) and a close to average spring. In 2014, a dry winter (December–January) was followed by a dry early spring (March–April) and
an unusually rainy May. In 2015, an autumn with average rainfall was followed by a wet January and an extremely dry spring from February to April.
In summary, the weather conditions in 2013 were close to the average, whereas both 2014 and 2015 represented unusual and unique combinations of various anomalies in temperature and precipitation. These changeable conditions had significant effects on most of the developmental and yield-related properties of the wheat cultivars, though to various extents (Supplemental Table S2).
Developmental Parameters
Sowing time, as a main factor, influenced the early developmental phases (Z30 and Z31) to a great extent, explaining the majority of the phenotypic variance (48.5 and 50.2%, respectively), whereas the individual effects of the other factors and the interactions were <20%. In later developmental phases (Z49, Z59, and ZSE), however, the effect of sowing time decreased, dropping below 20% by the end of rapid stem elongation. Parallel to this, the year and genotype main effects increased considerably, the year effect explaining a large portion of the phenotypic variance, with values of 42.0, 36.8, and 52.7% for Z49, Z59, and ZSE, respectively, whereas the genotype effects were 26.2% for Z49, 29.4% for Z59, and 19.5% for ZSE (Fig. 1, Supplemental Table S2).
The repeatability values (h2) of the developmental parameters clearly reflected the
significance of the genotype main effect in the variance components. The early developmental phases showed lower values (0.80 and 0.70 in Z30 and Z31, respectively), whereas the late developmental phases had higher h2 values (0.96, 0.95, and 0.93 for Z49, Z59, and ZSE,
respectively) (Supplemental Table S2). There were significant differences in the developmental phases across seasons and sowing times, as illustrated by the values for the Z31 and Z49 phases, averaged over genotypes (Fig. 2) and by the distribution patterns of Z30, Z31, and Z49
(Supplemental Fig. S2).
The ETT values of the earlier developmental phases clearly differentiated the two sowing time experiments, irrespective of the season, and seasonal effects were mostly apparent within the sowing times. In the case of Z31, significantly lower ETT was required to reach Z31 in the normal sowing time compared with late sowing, and there was no significant difference between the values for 2013 and 2015 (Fig. 2). In contrast, in the late sowing experiments, a highly significant difference (P 0.001) was detected between all three seasons (Fig. 2). These trends were clearly reflected in the GGE biplot analysis, which also revealed that the genotypic values of Z31 measured with late sowing in 2013 and 2014 were in the closest positive correlation with each other (Fig. 2). For the later developmental phases, the difference between the seasons became more pronounced than that of the sowing times. For instance, significantly lower ETT was required to reach Z49 with late sowing in 2 yr (2013 and 2015) than with normal sowing in 2014. In the GGE biplot analysis, the Z49 values of the genotypes differentiated the six
environments into two contrasting groups, with very strong similarities within each group.
Normal sowing in 2014 and late sowing in 2013 and 2014 belonged to one group, whereas normal sowing in 2013 and 2015 and late sowing in 2015 belonged to the other (Fig. 2). Thus, the difference in the developmental responses of the genotypes between the two sowing time experiments was the greatest in 2013, which had a cold December and unusually cold March,
TOC Head: ; Section Head: ; Article Type: ARTICLE
whereas the reactions across sowing times were the most similar in 2015, which had a warm winter and dry spring.
The correlations between the ETT values of the developmental phases in the two sowing times were significant and positive in all three seasons (Supplemental Fig. S2). The r values ranged from 0.505 (2013) to 0.733 (2015) for Z31, and from 0.494 (2013) to 0.614 (2014) for Z30. There was, however, a complete lack of significant correlations of the Z31 to Z30 interval between normal and late sowing times in all 3 yr (Supplemental Fig. S2). The Z30 to Z31 interval was the shortest in 2015 and the longest in 2013 (−33 to +46 ETT and −49 to +94 ETT, respectively) for both sowing times.
Morphological Parameters
The sowing time and the year, as principal components, had a lesser effect on the morphological characteristics than on the developmental parameters, based on the two-way ANOVA
(Supplemental Table S2). For these traits, the genotype often played a major role in determining the variance components, explaining from 20.2 (in the case of LSE) to 58.3% (in the case of LIN) of the phenotypic variance. This was followed by the year, the effect of which was between 11.1% (stem growth rate [SG]) and 20.3% (PH3). Sowing time only had a significant effect on PH2, PH3, and SG. Furthermore, no correlation was found between the sowing time and the interval of rapid stem elongation (LSE). For almost all morphological parameters, the values recorded in 2014 were significantly different from the mean values of 2013 and 2015. In 2014, the plants were significantly taller with a longer last internode or peduncle (Supplemental Table S2). In spite of this, the PH2 values showed a very strong correlation with each other at a high level of significance in all 3 yr and for both sowing times (P 0.001, Supplemental Fig. S2).
The characteristics of shooting differed in all 3 yr, in terms of both length and rate of rapid stem elongation, but the values measured in 2014 were quite distinct from those in the other 2 yr (Fig. 3). Of the 3 yr, the duration of rapid stem elongation (LSE) was the longest in 2014 and was accompanied by the slowest SG for both sowing dates. Although the overall tendencies were more similar in 2013 and 2015, there was a marked difference between the effects of sowing date in these 2 yr. In 2013, all the characteristics of shooting differed to a greater extent with normal and late sowing than in 2015. In 2014, the minimum and maximum values of the effective thermal time based on the LSE of the wheat genotypes were in a similar range for both sowing dates (301–541 and 301–562 ETT for normal and late sowing, respectively). In 2013, the ETT values of LSE exhibited the narrowest range in all six environments for normal sowing (228–
415) and the widest range for late sowing (190–471). In 2015, these values were 193 to 421 (normal sowing) and 204 to 439 (late sowing).
The rate of rapid stem elongation (SG) was the slowest in 2014, with similar ETT values required for 1 cm stem growth with both normal and late sowing, as proved by the b value being close to 1 in the linear regression equation (0.97, significant at P 0.001), whereas in both 2013 and 2015, the rapid stem growth was faster for normal than for late sowing (b values of 0.720 and 0.714, respectively, both significant at P 0.001; Fig. 3). In the normal sowing date experiment, 9.67 ETT was required for 1 cm of stem growth in 2014, whereas this value exceeded 11 ETT for the late sowing date (11.17, Fig. 3). The maximum ETT values for SG were 8.66 and 8.84 in 2013 and 6.84 and 7.42 in 2015, for the normal and late sowing dates,
respectively (Fig. 3). In terms of sowing date, the average values for SG were significantly higher in the late sowing date experiment than with normal sowing, irrespective of the year.
Yield Components
Similarly to the morphological traits, the genotype, as a main factor, had the strongest effect on most of the yield components, explaining between 17.7 (SSP) and 60.6% (MET) of the
phenotypic variance. This variance component explained the highest portion of phenotypic variance for both the thousand-kernel weight of the main spike (MET) and the average thousand- kernel weight (AET), being responsible for 60.6 and 48.9% of the phenotypic variance,
respectively. The genotype was followed by the year, which had a smaller effect on these traits, although it was significant in most cases, the only exceptions being AET and MET
(Supplemental Table S2). The year effect was the strongest for SPIK, explaining 15.9% of the phenotypic variance. Unlike these two factors, sowing time only had a significant effect on a few of the yield components. The only yield component where phenotypic variance was determined to the greatest extent by sowing time was the number of grains per spikelet (SSP), the sowing time being responsible for 40.8% of the phenotypic variance. The sowing time also contributed
>10% of the phenotypic variance in SPIK, but it had no significant effect on the average thousand-kernel weight (AET), the grain number (MS), or the grain weight of the main spike (MSW).
Highly significant (P 0.001) differences in the mean values of the spikelet number on the main spike (SPIK) were found between the sowing time experiments in all 3 yr. The genotype had the most noticeable effect on the thousand-kernel weight, although the difference between the 3 yr was also significant, averaged over the 188 varieties. The sowing date, on the other hand, only resulted in different thousand-kernel weights in 1 yr. The AET was the highest (44.7 g) with normal sowing in 2014, which differed significantly (P 0.001 and P 0.01,
respectively) from the mean values for normal sowing in 2013 and 2015 (41.3 and 42.9 g, respectively; Fig. 4). The grain number per spike (AS) was higher (41, 44, and 38) with normal sowing in all 3 yr, differing significantly from the mean values for late sowing (37 [P 0.001], 41 [P 0.001], and 36 [P 0.05] in 2013, 2014, and 2015, respectively; Fig. 4). Despite the higher value of AS for the late sowing time in 2014, a lower thousand-kernel weight was
observed, mostly due to the high proportion of shriveled seeds. The normal and late sowing dates were also more distinct from each other in 2014 than in the other 2 yr based on GGE biplot analysis.
There was no significant difference among the 3 yr for the grain number per spikelet (SSP) with normal sowing, but significant differences could be detected in the late sowing experiments (P 0.001): SSP was the highest in 2014, followed by the late sowing of 2013 (2.8 and 2.7, respectively), whereas in all the other environments, the values were statistically the same.
Interactive Effects of Developmental Patterns and Yield Components
To study the associations between plant development and yield components, the data of the six environments (3 yr 2 sowings) were pooled in two matrices along the sowing dates to make a separate analysis of how seasonal effects influence plant development and how differences in plant development then affect the various yield components. The two sowing dates thus served
TOC Head: ; Section Head: ; Article Type: ARTICLE
as distinctive conditions giving a better simulation of the possible effects of climatic anomalies.
In this context, normal sowing would represent mild and late sowing medium climatic
anomalies. The seasonal differences in the developmental phases exerted significant effects on most of the yield components, but the rate and extent of the correlation depended greatly on the sowing date (Fig. 5).
With normal sowing, plant development had no significant effect on the thousand-kernel weight but significantly influenced both the seed number and the seed weight, tending to
increase towards the later developmental phases, reaching a maximum at Z59 and then declining (Fig. 5). This tendency was true for both main and average spikes, but the magnitude was greater for the latter. At Z59, the differences in development explained 10.9 and 5.1% of the phenotypic variance in AS and MS, respectively, whereas these values were 7.7 and 3.3% for average seed weight per spike (ASW) and MSW. With late sowing, however, the effect of plant development on yield-related traits was much greater, with the exception of seed weight and the average seed number per spike. Plant development was especially important in determining the seed number in the main spike again with a peak at Z59. At this developmental stage, 22.9% of the phenotypic variance was due to developmental differences between the wheat genotypes. With late sowing the thousand-kernel weight in both the main and average spikes was significantly influenced by plant development, with the highest values at Z30, then showing a gradual decline as
development progressed. Plant development had a much stronger effect on AET, explaining 27.4% of the phenotypic variance at Z30, compared with MET, where this value was 12.1%.
As the consecutive developmental phases are strongly related to each other, the intervals between two consecutive phases were also included into the multivariate analysis to determine the importance of specific phases in influencing yield components (Fig. 6, Table 1). As can be seen in the plots of principal component analysis, the developmental phases were always placed together, irrespective of the sowing date, forming a separate group from the other parameters (Fig. 6). With normal sowing, all the seed parameters (number, weight, and thousand- kernel weight) were in close grouping with each other, separated only along the main or average spike to a smaller extent. This group included the rate of stem elongation (SG) and the number of seeds per spikelet, which were closely correlated with the interval between booting and heading
(Z5949). The traits characterizing plant growth, such as PH2, LIN, and LSE, and the
developmental phase intervals spanning the rapid stem elongation (from first node appearance to booting [Z4931], from heading to the end of rapid stem elongation [ZSE59]) were placed
relatively independently of this group. With late sowing, however, these groupings changed. This was especially evident for the separate positioning of thousand-kernel weight and for the closer grouping of Z5949 with SG and SPIK.
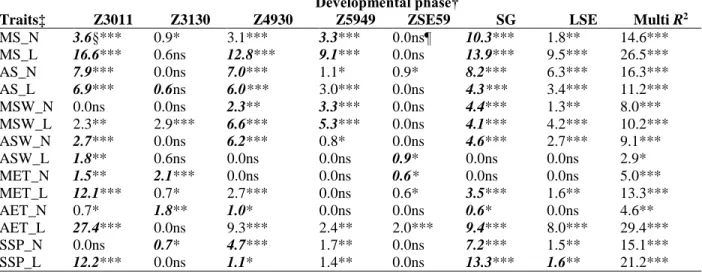
When the role of the intervals between the consecutive developmental phases was studied, the differences in how the yield components were influenced became more evident (Table 1).
Under these circumstances, neither the length (LSE) nor the latter part (ZSE59) of rapid stem elongation had a strong influence on any of the yield components. In the case of MS, the start (from germination to the start of rapid stem elongation [Z3011]) and the early and middle parts (Z4930 and Z5949) of rapid stem elongation played similar roles with normal sowing, but with late sowing, the significance of the start and the early part of rapid stem elongation increased to a greater extent. In all cases, the tendencies were similar, with longer ETT values being associated with higher seed number (Supplemental Fig. S3). For AS, again, the start and the early part of
rapid stem elongation were the significant components, but these were similar for both sowing times. The seed weight was mostly influenced by the early and middle phases of rapid stem elongation, whereas for thousand-kernel weight, the start of rapid stem elongation was the most decisive, especially with late sowing. It is interesting to note that with normal sowing, the phase length between first node appearance and the start of rapid stem elongation played a small, but significant role in determining both MET and AET, the correlation being negative. The rate of stem growth (SG) also significantly influenced most of the yield components, with the exception of MET for normal sowing and ASW for late sowing. It had the strongest effect on the seed number in the main spike (MS) for both sowing times and on both seed number per spikelet (SSP) and average thousand-kernel weight (AET) for the late sowing. Slower stem growth (larger ETT value required for 1 cm growth) correlated with larger seed number and
consequently with larger seed weight, but when SG had a significant correlation with thousand- kernel weight, this was always negative; slower stem growth led to smaller thousand-kernel weight.
DISCUSSION
The plant developmental patterns and yield components of 188 wheat genotypes with different geographic origin were studied in three consecutive years at the same location to evaluate the effects of climatic conditions on these traits, a study necessitated by the expected consequences of global climate change. As an additional extreme climatic situation, late sowing date was applied as well as normal sowing. The 3 yr represented unique combinations of weather
anomalies and differed to various extents from the average climatic conditions characteristic of the region.
Given the results, almost all the traits examined were significantly influenced by the genotype, which had the greatest effect on the morphological traits and yield components
(explaining 20–58 and 50–60% of phenotypic variance for the two trait groups, respectively). As the experiments were implemented on the same area, not only the genotypic effect but also the role of the two environmental factors, year and sowing date, could be analyzed in detail. Of the two, the year generally had a more notable effect on several traits than sowing time. It had a significant influence on the late developmental phases (being responsible for 37–53% of phenotypic variance) but was also an important factor in determining plant height and spikelet number. Sowing date had the greatest effect on the early developmental phases (explaining 50%
of phenotypic variance), but its contribution to seed number per spikelet and the rate of stem growth was also important.
Many authors have dealt with the effect of the starting date and length of individual phenophases on yield components in terms of photoperiod and temperature (González et al., 2002, 2003b, 2005; Whitechurch et al., 2007). By contrast, very little information is available on possible correlations between the changeable environmental factors (photoperiod and
temperature) and yield components in field sowing experiments. The present results showed that the application of different sowing times caused substantial differences in the growth dynamics of the wheat genotypes, plant development patterns, and yield components. As the yield is fundamentally determined by the quantity of assimilates produced by the plant and their distribution among the plant organs, it is obvious that the relative lengths of the various developmental phases have a decisive influence on the yield components (Slafer and Rawson,
TOC Head: ; Section Head: ; Article Type: ARTICLE
1996; Araus et al., 2002; González et al., 2005; McMaster, 2005; Chen et al., 2009; Foulkes et al., 2011; Kiss et al., 2011; Dreccer et al., 2014; González-Navarro et al., 2015, 2016). This was clearly reflected by the present findings. A substantial difference existed in the length of the vegetative phase, expressed indirectly as the time between sowing and first node appearance and also characterized by the cumulative and effective thermal time (Tottman and Makepeace, 1979;
Bogard et al., 2015). With respect to the classical thermal vs. effective thermal time, an inverse relationship was observed between the two sowing time experiments. This finding highlights that the transition from vegetative to reproductive growth is triggered by either accumulation of the needed number of vernalization units (cold units) and/or the daylength has become long enough.
Thus, the lower values of effective thermal time measured in the normal autumn sowing time experiments do not denote a shorter vegetative phase. The vegetative phase was longer with normal autumn sowing, resulting in increased tillering, a larger proportion of which was
productive. By contrast, the vegetative phase was considerably shorter with late autumn sowing, as the plants were exposed sooner to an inductive environment, so the period until the initiation of stem elongation was shorter in terms of calendar days (Kiss et al., 2014).
Under the contrasting changes in weather conditions across the 3 yr, the year effect,
magnified by the application of late sowing date, proved to be more significant than the genotype in determining plant development. The early developmental phases were more sensitive to weather conditions than the later ones, the turning point being around the booting stage. The phase between booting and heading was less influenced by the environment, but after heading sensitivity increased again towards the final part of rapid stem elongation. It is well documented that significant associations exist between plant development and various yield components (Fischer, 1985; Slafer and Rawson, 1994, 1996; Miralles et al., 2000; Whitechurch and Slafer, 2001, 2002; Araus et al., 2002; González et al., 2003a, 2003b; Reynolds et al., 2009; García et al., 2011; Dreccer et al., 2014; González-Navarro et al., 2015, 2016). The aim of the present work was to determine the extent to which the various phases influence yield components and how this depends on the weather conditions. Of the early developmental phases, the effect of the
“vegetative” phase (from the seedling stage to the start of rapid stem elongation) was accentuated by late sowing. In addition, the rate and the early phase of the rapid stem elongation (SG and Z4930) had a significant effect on almost all the yield components studied, having the largest influence on the grain number (MS, AS, and SSP). The relationship between the start of the rapid stem elongation phase and first node appearance (Z3130) was also examined. Some genotypes enter the rapid stem elongation phase without any gaps, but several were identified that needed to collect more effective thermal time between the first node appearance and the start of rapid stem elongation, depending on the environmental conditions. In general, genotypes with early heading enter the rapid stem elongation phase without a transition. This phase contributed slightly but significantly to the thousand-kernel weight with normal sowing; genotypes with smaller gaps tended to have larger thousand-kernel weight. Investigations on this parameter could provide valuable information for use in breeding programs. The length of the late developmental phase (Z5949) showed a significant correlation with the seed number in the main spike and with the grain number per average spike and per spikelet (AS and SSP), and to a lesser extent with the spikelets per spike (SPIK). Numerous authors have demonstrated that during wheat spike differentiation, the development of new spikelets ceases once the terminal spikelet has been formed, indicating that the maximum number of spikelets is genetically determined, whereas no such determination was observed for the number of flowers within the spikelets (Kirby, 1988;
Miralles et al., 1998; González et al., 2003a, 2005). The final number of flowers per spikelet is determined during the rapid stem elongation phase, depending on the quantity of assimilates accumulated as a function of the environment and plant status, whereas the fertilization rate of the flowers determines the number of grains per spikelet (Miralles and Richards, 2000; González et al., 2003b, 2005). However, a significant correlation was found between the second stage of rapid stem elongation (from booting to heading) and the number of spikelets per spike in both the present and previous work (Kiss et al., 2014). A significant correlation was also demonstrated with the spike density (Schuler et al., 1994), which was confirmed in the present work.
CONCLUSIONS
A set of plant developmental, morphological, and yield components and their interactions was studied in detail on a large panel of wheat cultivars in a series of 3-yr two-sowing-time field experiments. These were set up at the same location using similar dates for normal and late sowing in each year, allowing the effects of climatic factors to be analyzed in greater detail. The climatic anomalies in the 3 yr did not include severe drought or heat stress but were
characterized more by weather conditions that were unusual at the given time of year. Climatic factors were found to have a significant impact on the groups of traits examined, among which plant development was influenced to the greatest extent. The changes in developmental patterns then led to significant changes in yield components as well. The developmental changes
observed in the normal sowing date experiments caused by the mild to medium weather
anomalies led to 5 to 15% differences in various yield components, suggesting that similar yield losses may be expected simply due to disruptions in the developmental pattern. The late sowing time experiments simulated the effects of medium to strong weather anomalies. Under these more adverse conditions, the yield loss due to disrupted plant developmental patterns alone could be as high as 15 to 25%. A detailed biological and genetic analysis of plant developmental phases of hexaploid wheat will be helpful in the various breeding programs, because the breeders can find easier those genetic resources, which are best suited to local environmental conditions.
Conflict of Interest The authors declare that there is no conflict of interest.
Supplemental Material Available Supplemental material for this article is available online.
ACKNOWLEDGMENTS
This research was funded by the following grants: OTKA NK72813, OTKA 80781, EU-FP7 ADAPTAWHEAT, and EU_BONUS_12-1-2012-0024.
REFERENCES
Araus, J.L., G.A. Slafer, M.P. Reynolds, and C. Royo. 2002. Plant breeding and water relations in C3 cereals: What to breed for? Ann. Bot. 89:925–940. doi:10.1093/aob/mcf049
Bauer, A., A.B. Frank, and A.L. Black. 1984. Estimation of spring wheat leaf growth rates and anthesis from air temperature. Agron. J. 76:829–835. doi:10.2134/agronj1984.00021962007600050027x
TOC Head: ; Section Head: ; Article Type: ARTICLE
Bogard, M., J.B. Pierre, B. Huguenin-Bizot, D. Hourcade, E. Paux, X. Le Bris, and D. Gouache. 2015. A simple approach to predict growth stages in winter wheat (Triticum aestivum L.) combining prediction of a crop model and marker based prediction of the deviation to a reference cultivar: A case study in France. Eur. J. Agron.
68:57–68. doi:10.1016/j.eja.2015.04.007
Borràs, G., I. Romagosa, F. van Eeuwijk, and G.A. Slafer. 2009. Genetic variability in duration of pre-heading phases and relationships with leaf appearance and tillering dynamics in a barley population. Field Crops Res.
113:95–104. doi:10.1016/j.fcr.2009.03.012
Borrill, P., B. Fahy, A.M. Smith, and C. Uauy. 2015. Wheat grain filling is limited by grain filling capacity rather than the duration of flag leaf photosynthesis: A case study using NAM RNAi plants. PLoS One 10:e0134947.
doi:10.1371/journal.pone.0134947
Chen, Y., B.F. Carver, S. Wang, S. Cao, and L. Yan. 2010. Genetic regulation of developmental phases in winter wheat. Mol. Breed. 26:573–582. doi:10.1007/s11032-010-9392-6
Chen, Y., B.F. Carver, S. Wang, F. Zhang, and L. Yan. 2009. Genetic loci associated with stem elongation and winter dormancy release in wheat. Theor. Appl. Genet. 118:881–889. doi:10.1007/s00122-008-0946-5
Clerget, B., M. Dingkuhn, E. Gozé, H.F.W. Rattunde, and B. Ney. 2008. Variability of phyllochron, plastochron and rate of increase in height in photoperiod-sensitive sorghum varieties. Ann. Bot. 101:579–594.
doi:10.1093/aob/mcm327
Dreccer, M.F., K.B. Wockner, J.A. Palta, C.L. McIntyre, M.G. Borgognone, M. Bourgault, et al. 2014. More fertile florets and grains per spike can be achieved at higher temperature in wheat lines with high spike biomass and sugar content at booting. Funct. Plant Biol. 41:482–495. doi:10.1071/FP13232
Fischer, R.A. 1985. Number of kernels in wheat crops and the influence of solar radiation and temperature. J. Agric.
Sci. 105:447–461. doi:10.1017/S0021859600056495
Fornara, F., A. de Montaigu, and G. Coupland. 2010. SnapShot: Control of flowering in Arabidopsis. Cell 141:550.
doi:10.1016/j.cell.2010.04.024
Foulkes, M.J., G.A. Slafer, W.J. Davies, P.M. Berry, R. Sylvester-Bradley, P. Martre, et al. 2011. Raising yield potential of wheat. III. Optimizing partitioning to grain while maintaining lodging resistance. J. Exp. Bot.
62:469–486. doi:10.1093/jxb/erq300
Gaju, O., V. Allard, P. Martre, J.W. Snape, E. Heumez, J. LeGouis, et al. 2011. Identification of traits to improve the nitrogen-use efficiency of wheat genotypes. Field Crops Res. 123:139–152. doi:10.1016/j.fcr.2011.05.010 Gallagher, J.N. 1979. Field studies of cereal leaf growth. I. Initiation and expansion in relation to temperature and
ontogeny. J. Exp. Bot. 30:625–636. doi:10.1093/jxb/30.4.625
García, G.A., R.A. Serrago, M.L. Appendino, L.A. Lombardo, L.S. Vanzetti, M. Helguera, and D.J. Miralles. 2011.
Variability of duration of preanthesis phases as a strategy for increasing wheat grain yield. Field Crops Res.
124:408–416. doi:10.1016/j.fcr.2011.07.006
Gebruers, K., E. Dornez, Z. Bedő, M. Rakszegi, A. Frás, D. Boros, et al. 2010. Environment and genotype effects on the content of dietary fiber and its components in wheat in the HEALTHGRAIN diversity screen. J. Agric. Food Chem. 58:9353–9361. doi:10.1021/jf100447g
Golzarian, M.R., R.A. Frick, K. Rajendran, B. Berger, S. Roy, and M. Tester. 2011. Accurate inference of shoot biomass from high-throughput images of cereal plants. Plant Methods 7:2. doi:10.1186/1746-4811-7-2 González, F.G., G.A. Slafer, and D.J. Miralles. 2002. Vernalization and photoperiod response in wheat pre-
flowering reproductive phases. Field Crops Res. 74:183–195. doi:10.1016/S0378-4290(01)00210-6
González, F.G., G.A. Slafer, and D.J. Miralles. 2003a. Floret development, spike growth as affected by photoperiod during stem elongation in wheat. Field Crops Res. 81:29–38. doi:10.1016/S0378-4290(02)00196-X
González, F.G., G.A. Slafer, and D.J. Miralles. 2003b. Grain and floret number in response to photoperiod during stem elongation in fully and slightly vernalized wheats. Field Crops Res. 81:17–27. doi:10.1016/S0378- 4290(02)00195-8
González, F.G., G.A. Slafer, and D.J. Miralles. 2005. Photoperiod during stem elongation in wheat: Is its impact on fertile floret and grain number determination similar to that of radiation? Funct. Plant Biol. 32:181–188.
doi:10.1071/FP04103
González-Navarro, O.E., S. Griffiths, G. Molero, M.P. Reynolds, and G.A. Slafer. 2015. Dynamics of floret development determining differences in spike fertility in an elite population of wheat. Field Crops Res. 172:21–
31. doi:10.1016/j.fcr.2014.12.001
González-Navarro, O.E., S. Griffiths, G. Molero, M.P. Reynolds, and G.A. Slafer. 2016. Variation in developmental patterns among elite wheat lines and relationships with yield, yield components and spike fertility. Field Crops Res. 196:294–304. doi:10.1016/j.fcr.2016.07.019
Gouache, D., X. Le Bris, M. Bogard, O. Deudon, C. Pagé, and P. Gate. 2012. Evaluating agronomic adaptation options to increasing heat stress under climate change during wheat grain filling in France. Eur. J. Agron.
39:62–70. doi:10.1016/j.eja.2012.01.009
Haun, J.R. 1973. Visual quantification of wheat development. Agron. J. 65:116–119.
doi:10.2134/agronj1973.00021962006500010035x
Jamieson, P.D., M.A. Semenov, I.R. Brooking, and G.S. Francis. 1998. Sirius: A mechanistic model of wheat response to environmental variation. Eur. J. Agron. 8:161–179. doi:10.1016/S1161-0301(98)00020-3
Kabesh, M.O., M.F. El-Kramany, G.A. Sary, H.M. El-Naggar, and S.H.B. Gehan. 2009. Effects of sowing methods and some bio-organic fertilization treatments on yield and components of wheat. Res. J. Agric. Biol. Sci. 5:97–
102.
Kato, K., H. Miura, and S. Sawada. 2000. Mapping QTLs controlling grain yield and its components on chromosome 5A of wheat. Theor. Appl. Genet. 101:1114–1121. doi:10.1007/s001220051587
Kirby, E.J.M. 1988. Analysis of leaf, stem and ear growth in wheat from terminal spikelet stage to anthesis. Field Crops Res. 18:127–140. doi:10.1016/0378-4290(88)90004-4
Kiss, T., K. Balla, J. Bányai, O. Veisz, and I. Karsai. 2014. Effect of different sowing times on the plant developmental parameters of wheat (Triticum aestivum L.). Cereal Res. Commun. 42:239–251.
doi:10.1556/CRC.2013.0064
Kiss, T., K. Balla, O. Veisz, and I. Karsai. 2011. Elaboration of a non-destructive methodology for establishing plant developmental patterns in cereals. Acta Agron. Hung. 59:293–301. doi:10.1556/AAgr.59.2011.4.1
Large, E.C. 1954. Growth stages in cereals. Illustrations of the Feekes’ scale. Plant Pathol. 3:128–129.
doi:10.1111/j.1365-3059.1954.tb00716.x
McMaster, G.S. 2005. Phytomers, phyllochrons, phenology and temperate cereal development. J. Agric. Sci.
143:137–150. doi:10.1017/S0021859605005083
Miralles, D.J., S.D. Katz, A. Colloca, and G.A. Slafer. 1998. Floret development in near isogenic lines differing in plant height. Field Crops Res. 59:21–30. doi:10.1016/S0378-4290(98)00103-8
Miralles, D.J., and R.A. Richards. 2000. Responses of leaf and tiller emergence and primordium initiation in wheat and barley to interchanged photoperiod. Ann. Bot. 85:655–663. doi:10.1006/anbo.2000.1121
Miralles, D.J., R.A. Richards, and G.A. Slafer. 2000. Duration of the stem elongation period influences the number of fertile florets in wheat and barley. Aust. J. Plant Physiol. 27:931–940.
Nakano, H., and S. Morita. 2009. Effects of seeding rate and nitrogen application rate on yield and protein content of the bread wheat cultivar ‘Minaminokaori’ in southwestern Japan. Plant Prod. Sci. 12:109–115.
doi:10.1626/pps.12.109
TOC Head: ; Section Head: ; Article Type: ARTICLE
Porter, J.R. 1993. AFRCWHEAT2: A model of the growth and development of wheat incorporating responses to water and nitrogen. Eur. J. Agron. 2:69–82. doi:10.1016/S1161-0301(14)80136-6
Porter, J.R., and M.A. Semenov. 2005. Crop responses to climatic variation. Philos. Trans. R. Soc. Lond. B Biol.
Sci. 360:2021–2035. doi:10.1098/rstb.2005.1752
Reynolds, M., M.J. Foulkes, G.A. Slafer, P. Berry, M.A.J. Parry, J.W. Snape, and W.J. Angus. 2009. Raising yield potential in wheat. J. Exp. Bot. 60:1899–1918. doi:10.1093/jxb/erp016
Schuler, S.F., R.K. Bacon, and E.E. Gbur. 1994. Kernel and spike character influence on test weight of soft red winter wheat. Crop Sci. 34:1309–1313. doi:10.2135/cropsci1994.0011183X003400050031x
Shewry, P.R., V. Piironen, A.-M. Lampi, M. Edelmann, S. Kariluoto, T. Nurmi, et al. 2010. The HEALTHGRAIN wheat diversity screen: Effects of genotype and environment on phytochemicals and dietary fiber components.
J. Agric. Food Chem. 58:9291–9298. doi:10.1021/jf100039b
Serrago, R.A., I. Alzueta, R. Savin, and G.A. Slafer. 2013. Understanding grain yield responses to source–sink ratios during grain filling in wheat and barley under contrasting environments. Field Crops Res. 150:42–51.
doi:10.1016/j.fcr.2013.05.016
Slafer, G.A., and H.M. Rawson. 1994. Sensitivity of wheat phasic development to major environmental factors: A re-examination of some assumptions made by physiologists and modellers. Aust. J. Plant Physiol. 21:393–426.
Slafer, G.A., and H.M. Rawson. 1996. Responses to photoperiod change with phenophase and temperature during wheat development. Field Crops Res. 46:1–13. doi:10.1016/0378-4290(95)00081-X
Snape, J.W., C.N. Law, B.B. Parker, and A.J. Worland. 1985. Genetical analysis of chromosome 5A of wheat and its influence on important agronomic characters. Theor. Appl. Genet. 71:518–526. doi:10.1007/BF00251199 Tottman, D.R., and R.J. Makepeace. 1979. An explanation of the decimal code for the growth stages of cereals, with
illustrations. Ann. Appl. Biol. 93:221–234. doi:10.1111/j.1744-7348.1979.tb06534.x
Waddington, S.R., P.M. Cartwright, and P.C. Wall. 1983. A quantitative scale of spike initial and pistil development in barley and wheat. Ann. Bot. 51:119–130. doi:10.1093/oxfordjournals.aob.a086434
Weir, A.H., P.L. Bragg, J.R. Porter, and J.H. Rayner. 1984. A winter wheat crop simulation model without water or nutrient limitations. J. Agric. Sci. 102:371–382. doi:10.1017/S0021859600042702
Whitechurch, E.M., and G.A. Slafer. 2001. Responses to photoperiod before and after jointing in wheat substitution lines. Euphytica 118:47–51. doi:10.1023/A:1004031722435
Whitechurch, E.M., and G.A. Slafer. 2002. Contrasting Ppd alleles in wheat: Effects on sensitivity to photoperiod in different phases. Field Crops Res. 73:95–105. doi:10.1016/S0378-4290(01)00188-5
Whitechurch, E.M., G.A. Slafer, and D.J. Miralles. 2007. Variability in the duration of stem elongation in wheat genotypes and sensitivity to photoperiod and vernalization. J. Agron. Crop Sci. 193:131–137.
doi:10.1111/j.1439-037X.2007.00259.x
Worland, A.J. 1996. The influence of flowering time genes on environmental adaptability in European wheats.
Euphytica 89:49–57. doi:10.1007/BF00015718
Worland, A.J., A. Börner, V. Korzun, W.M. Li, S. Petrovíc, and E.J. Sayers. 1998. The influence of photoperiod genes on the adaptability of European winter wheats. Euphytica 100:385–394. doi:10.1023/A:1018327700985 Yan, W. 2001. GGE Biplot: A Windows application for graphical analysis of multi-environment trial data and other
types of two-way data. Agron. J. 93:1111–1118. doi:10.2134/agronj2001.9351111x
Zadoks, J.C., T.T. Chang, and C.F. Konzak. 1974. A decimal code for the growth stages of cereals. Weed Res.
14:415–421. doi:10.1111/j.1365-3180.1974.tb01084.x
Fig. 1. Composition of phenotypic variance in consecutive developmental phases as explained by the three main factors (genotype [G], year [Y], and sowing time [S]) and their interactions:
variance component (2) values for G Y are between 0.7 and 1.7; for G S, the values are between 0.3 and 1.5.
Fig. 2. Boxplot of (a) the first node appearance at the base of the main stem (Z31) and (c) spike located in the upper part of the flag-leaf sheath (Z49) in the three experimental years and two sowing times. Principal genotype main effect plus genotype environment interactions (GGE) biplot analysis of the (b) Z31 and (d) Z49 developmental phases. PC, principal component.
Boxes with different letters are significantly different at P ≤ 0.05 probability level.
Fig. 3. Linear regression between the effective thermal times for normal and late sowing in the 3 yr based on (a) the length of rapid stem elongation (LSE) and (b) the rate of rapid stem
elongation (SG).
Fig. 4. Boxplot and principal genotype main effect plus genotype environment interactions (GGE) biplot analysis of (a) average grain number per spike (AS) and (b) average thousand- kernel weight (AET) in the three experimental years and two sowing dates. PC, principal component. Boxes with different letters are significantly different at P ≤ 0.05 probability level.
Fig. 5. Portion of phenotypic variance of different yield components explained by the consecutive developmental phases of wheat cultivars in the normal (N) and late sowing (L) experiments, as expressed by the R2 values of regression analysis: (a) seed number in spikelets on the main spike (SSP), seed number in the main spike (MS) and in an average spike (AS), (b) seed weight in the main spike (MSW) and in an average spike (ASW), and (c) thousand-kernel weight in the main spike (MET) and in an average spike (AET). All values of R2 > 1 are significant at P 0.001 level.
Fig. 6. Principal component analysis on developmental and yield-related traits in the data matrices of the 188 wheat cultivars grouped for (a) the normal and (b) the late sowing dates in the 3 yr.
Table 1. Effect of developmental patterns on yield as expressed by the R2 values of regression analysis between the consecutive developmental phase lengths and various yield components in the two matrices of 188 wheat cultivars formed by the sowing dates of the 3 yr.
Developmental phase†
Traits‡ Z3011 Z3130 Z4930 Z5949 ZSE59 SG LSE Multi R2
MS_N 3.6§*** 0.9* 3.1*** 3.3*** 0.0ns¶ 10.3*** 1.8** 14.6***
MS_L 16.6*** 0.6ns 12.8*** 9.1*** 0.0ns 13.9*** 9.5*** 26.5***
AS_N 7.9*** 0.0ns 7.0*** 1.1* 0.9* 8.2*** 6.3*** 16.3***
AS_L 6.9*** 0.6ns 6.0*** 3.0*** 0.0ns 4.3*** 3.4*** 11.2***
MSW_N 0.0ns 0.0ns 2.3** 3.3*** 0.0ns 4.4*** 1.3** 8.0***
MSW_L 2.3** 2.9*** 6.6*** 5.3*** 0.0ns 4.1*** 4.2*** 10.2***
ASW_N 2.7*** 0.0ns 6.2*** 0.8* 0.0ns 4.6*** 2.7*** 9.1***
ASW_L 1.8** 0.6ns 0.0ns 0.0ns 0.9* 0.0ns 0.0ns 2.9*
MET_N 1.5** 2.1*** 0.0ns 0.0ns 0.6* 0.0ns 0.0ns 5.0***
MET_L 12.1*** 0.7* 2.7*** 0.0ns 0.6* 3.5*** 1.6** 13.3***
AET_N 0.7* 1.8** 1.0* 0.0ns 0.0ns 0.6* 0.0ns 4.6**
AET_L 27.4*** 0.0ns 9.3*** 2.4** 2.0*** 9.4*** 8.0*** 29.4***
SSP_N 0.0ns 0.7* 4.7*** 1.7** 0.0ns 7.2*** 1.5** 15.1***
SSP_L 12.2*** 0.0ns 1.1* 1.4** 0.0ns 13.3*** 1.6** 21.2***
TOC Head: ; Section Head: ; Article Type: ARTICLE
*, **, *** Significant at the 0.05, 0.01, and 0.001 probability levels, respectively.
† Z3011, from germination to the start of rapid stem elongation; Z3130, from the start of rapid stem elongation to the appearance of the first node; Z4930, from first node appearance to booting; Z5949, from booting to heading;
ZSE59, from heading to the end of rapid stem elongation; SG, rate of rapid stem growth; LSE, length of rapid stem growth.
‡ MS, seed number in the main spike; AS, average seed number per spike; MSW, seed weight in the main spike;
ASW, average seed weight per spike; MET, thousand-kernel weight in the main spike; AET, average thousand- kernel weight per spike; SSP, seed number per spikelet in the main spike; N, normal sowing; L, late sowing.
§ Numbers in bold italics represent developmental phases and parameters making a significant contribution to the multiple R2.
¶ ns, not significant.
TOC Head: ; Section Head: ; Article Type: ARTICLE
TOC Head: ; Section Head: ; Article Type: ARTICLE
Supporting information for the article of
Comparative study of the developmental traits and yield components of bread wheat (Triticum aestivum L.) in multi-annual field conditions using multi-
sowing time experiments
Tibor Kiss,*, Judit Bányai, Krisztina Balla, Marianna Mayer, Zita Berki, Ádám Horváth, Ottó Veisz, Zoltán Bedő, Ildikó Karsai
Legend of Supplemental Figures and Tables
Supplemental Table 1 Origin and heading date (measured over the average of the six environments) of the 188 wheat genotypes examined.
Supplemental Table 2 Summary of the analysis of variance and the mean values of developmental and morphological parameters and yield components.
Supplemental Fig. 1 Mean monthly temperature (a, [Ta]) and rainfall (b, [Pa]) datasets for the growing seasons in the field experiments, and the deviation of the two parameters from the mean of 30 years (1971-2000) (∆T; ∆P /bar charts/).
Supplemental Fig. 2 Relationship between the values of Z31 (a), Z30 (b), Z3031 (c) and PH_final (d) measured with normal and late sowing in the three years. Lines were fitted with linear regression.
Supplemental Fig. 3 Correlations between plant developmental phases and the seed number in the main spike with (a) normal sowing and (b) late sowing.