ICN_Atlas: Automated description and quanti fi cation of functional MRI activation patterns in the framework of intrinsic connectivity networks
Lajos R. Koz ak
a,*, Louis Andr e van Graan
b,c, Umair J. Chaudhary
b,c, Ad am Gy€ orgy Szab o
a, Louis Lemieux
b,c,**aMR Research Center, Semmelweis University, 1085, Budapest, Hungary
bDepartment of Clinical and Experimental Epilepsy, UCL Institute of Neurology, University College London, WC1N 3BG, London, UK
cEpilepsy Society, SL9 0RJ Chalfont St. Peter, Buckinghamshire, UK
A R T I C L E I N F O Keywords:
Brain atlas
Functional characterization
Functional magnetic resonance imaging Resting-state networks
Intrinsic connectivity networks Data analysis
A B S T R A C T
Generally, the interpretation of functional MRI (fMRI) activation maps continues to rely on assessing their relationship to anatomical structures, mostly in a qualitative and often subjective way. Recently, the existence of persistent and stable brain networks of functional nature has been revealed; in particular these so-called intrinsic connectivity networks (ICNs) appear to link patterns of resting state and task-related state connectivity. These networks provide an opportunity of functionally-derived description and interpretation of fMRI maps, that may be especially important in cases where the maps are predominantly task-unrelated, such as studies of spontaneous brain activity e.g. in the case of seizure-related fMRI maps in epilepsy patients or sleep states. Here we present a new toolbox (ICN_Atlas) aimed at facilitating the interpretation of fMRI data in the context of ICN. More spe- cifically, the new methodology was designed to describe fMRI maps in function-oriented, objective and quanti- tative way using a set of 15 metrics conceived to quantify the degree of‘engagement’of ICNs for any given fMRI- derived statistical map of interest. We demonstrate that the proposed framework provides a highly reliable quantification of fMRI activation maps using a publicly available longitudinal (test-retest) resting-state fMRI dataset. The utility of theICN_Atlasis also illustrated on a parametric task-modulation fMRI dataset, and on a dataset of a patient who had repeated seizures during resting-state fMRI, confirmed on simultaneously recorded EEG. The proposedICN_Atlastoolbox is freely available for download athttp://icnatlas.comand athttp://www.
nitrc.orgfor researchers to use in their fMRI investigations.
1. Introduction
The analysis and interpretation of functional MRI data activation patterns is usually performed in the framework of brain anatomy. In particular, activation clusters are usually described in terms of their extent and centre of gravity coordinates as defined in standard template spaces, e.g. MNI (Montreal Neurological Institute) or Talairach (Evans et al., 1993; Fox and Lancaster, 2002; Talairach and Tournoux, 1988). A variety of macro- and micro-structural atlasing approaches have been proposed to relate activation clusters to anatomical landmarks, e.g.
automated anatomical labelling or parcellations based on gyral and sulcal structure (Damoiseaux et al., 2006; Tzourio-Mazoyer et al., 2002), or on cytoarchitectonic structure, e.g. the Talairach Demon or the SPM
Anatomy toolbox (Eickhoff et al., 2005; Lancaster et al., 2000).
Another widely used approach to the description of fMRI activation patterns is based on functional localizers. For example, a target area is identified through a separate localisation measurement after which ac- tivations of interest are described with respect to the localizer's func- tional activations (Saxe et al., 2006). There is some criticism regarding the improper use of functional localizers, especially when used to constrain the analyses per se or due to the risk of circularity (Friston et al., 2006; Kriegeskorte et al., 2009). Furthermore, in the context of patho- logical activity and in particular in view of the spatio-temporal hetero- geneity of epileptic activity-related BOLD patterns this approach may be sub-optimal since it may not provide a comprehensive mapping of all relevant activation foci.
* Corresponding author. MR Research Center, Semmelweis University, Üll}oi út 26, 1085, Budapest Hungary.
** Corresponding author. Department of Clinical and Experimental Epilepsy, UCL Institute of Neurology, University College London, 33 Queen Square, WC1N 3BG, London, UK.
E-mail addresses: lrkozak@gmail.com (L.R. Kozak), louis.graan.12@ucl.ac.uk (L.A. van Graan), umair.chaudhary@alumni.ucl.ac.uk (U.J. Chaudhary), szabadam@gmail.com (A.G. Szab o),louis.lemieux@ucl.ac.uk(L. Lemieux).
Contents lists available atScienceDirect
NeuroImage
j ourna l home page:www.el se vier.com/loca te/ ne uroi ma ge
https://doi.org/10.1016/j.neuroimage.2017.09.014
Received 12 July 2017; Received in revised form 30 August 2017; Accepted 6 September 2017 Available online 9 September 2017
1053-8119/©2017 The Authors. Published by Elsevier Inc. This is an open access article under the CC BY license (http://creativecommons.org/licenses/by/4.0/).
Recent developments showing the correspondence of maps obtained with resting-state and task-based fMRI (Laird et al., 2011; Ray et al., 2013; Smith et al., 2009) may provide a solid background for developing a whole-brain functional networks-based atlasing tool for the interpre- tation of BOLD patterns derived either from task-based or task-free measurements. Specifically, the pattern of low frequency correlations in the resting brain have been shown to form well identifiable intrinsic connectivity networks (ICNs) or resting state networks (RSN) (Beckmann et al., 2005; Biswal et al., 1995; Laird et al., 2011). ICNs are spatially segregated areas representing underlying functional connectivity (Fox and Raichle, 2007), i.e. intrinsic connectivity, which is important for development, maintenance, and function of the brain (Doria et al., 2010;
Pizoli et al., 2011; Raichle, 2010; Raichle and Mintun, 2006; Supekar et al., 2010; Zielinski et al., 2010). As functional units they show syn- chronized BOLDfluctuations both at rest and while performing specific tasks (Damoiseaux et al., 2006; Laird et al., 2011; Smith et al., 2009).
These networks have been observed consistently across imaging sessions (Biswal et al., 2010; Shehzad et al., 2009; Zuo et al., 2010b) and between subjects (Damoiseaux et al., 2006; Shehzad et al., 2009) and can essen- tially be seen as forming two large anti-correlated systems corresponding to task disengagement and task engagement, respectively; the former is the so-called default mode network (DMN) and the latter is composed of several task-based networks: somatosensory, visual, or attention ICN, etc.
(Chai et al., 2012; Golland et al., 2008; Power et al., 2011; Zhang et al., 2011). Data-driven meta-analyses of task-activation data have shown a strong correspondence between the configurations of RSNs and task-based fMRI co-activations both for low and high independent component analysis (ICA) model orders (Laird et al., 2011; Ray et al., 2013; Smith et al., 2009).
In thefield of epilepsy, there is an increasing interest of a functional network-based interpretation of the pathological activity. In the partic- ular case of fMRI localisation of epileptic events and discharges (such as observed on simultaneously-recorded EEG) a functionally-derived framework may be more appropriate than an anatomical approach, specifically for the discussion of EEG discharge-related activation and deactivation patterns (Chaudhary et al., 2012), given the relationship between activation patterns and the seizure's clinical signs (semiology) (Chaudhary et al., 2012; Thornton et al., 2010; Tyvaert et al., 2008).
Several studies employing independent component analysis to derive
spatio-temporal components related to epileptic discharges evidenced networked activation/deactivation patterns partly overlapping and coexisting with ICN-related components (LeVan et al., 2010; Moeller et al., 2011; Rodionov et al., 2007; Thornton et al., 2010). There is also evidence for altered connectivity outside the core epileptic networks, affecting the ICNs possibly as an effect of epilepsy (Centeno and Carmi- chael, 2014). A study of BOLD changes associated with different electro-clinical phases of epileptic seizures has shown a link between involvement of the DMN and loss of consciousness (Chaudhary et al., 2012). A recently proposed framework emphasizes the importance of the proportion of change produced by epileptic transients relative to steady-state network connectivity in normal controls (Centeno and Car- michael, 2014). This underlines the necessity to interpret epileptic discharge-related activation with respect to the whole connectome.
Here we propose an atlasing tool, calledICN_Atlas, for the interpre- tation of BOLD maps based on the objective quantification of the degree ofengagementof a set of intrinsic connectivity networks (used here as a set of atlas base maps). Specifically, we aimed to develop a means to describe activations in the framework of ICN by matching data to atlas templates in a similar fashion as anatomy-based atlases do and to calculate various measures of activation extent and level in relation to the chosen atlas maps. We first present the engagement quantification formalism, followed by a validation study andfinally an illustration of the new tool's application in the study of epileptic networks.
1.1. Principles and implementation of ICN_Atlas 1.1.1. The ICN_Atlas framework
ICN_Atlasis a collection of Matlab (Mathworks Inc., Natick, MA, USA) scripts that serves as an extension to the SPM toolbox (http://www.fil.
ion.ucl.ac.uk/spm/) and, as such, works across multiple platforms (Windows PC, Unix, Mac). It is an extensible non-commercial package that is freely available athttp://icnatlas.comand athttp://www.nitrc.
org. The aim was to provide a toolbox with atlasing capabilities analo- gous to previously published anatomical information-based tools such as the 3D Talairach atlas (Lancaster et al., 2000), or the Automated Anatomical Labelling (Tzourio-Mazoyer et al., 2002). The novelty of the framework lies in the following: (1) it uses functionally-derived atlas base maps based on ICNs; (2) it outputs a series of estimated activation-based Abbreviations
AAL automated anatomical labelling ANOVA analysis of variance
BOLD blood oxygenation-level dependent DMN default mode network
EEG electroencephalography EFA exploratory factor analysis EPI echo-planar imaging
fMRI functional magnetic resonance imaging FWHM full width at half maximum
GLM generalized linear model Ii ICNiSpatial Involvement
IMi Normalised Mean ICNiActivation Density IT Total ICN Spatial Involvement
IMT Normalised Global Mean ICN Activation Density IC independent component
ICA independent component analysis ICC intra-class correlation coefficient ICCB between-session ICC
ICCW within-session ICC
ICN intrinsic connectivity network IRi ICNiRelative Spatial Involvement
IRMi Relative Normalised Mean ICNiActivation Ji Jaccard index with ICNi
MA Global Mean ICN Activation MAi Mean ICNiActivation
MAN Normalised Global Mean ICN Activation MAN,i Normalised Mean ICNiActivation
MELODIC Multivariate Exploratory Linear Optimized Decomposition into Independent Components, ICA analysis tool
MNI Montreal Neurological Institute MRI magnetic resonance imaging
NIfTI Neuroimaging Informatics Technology Initiative NYU New York University
NYU-TRT NYU resting-state fMRI test-retest data OLi Spatial Overlap with ICNi
PCA principal component analysis ri Pearson's spatial correlation with ICNi
RAN,i Normalised Relative ICNiActivation rs-fMRI resting-state fMRI
RSN resting state network
SPM statistical parametric map/Statistical Parametric Mapping SQi Sørensen-Dice coefficient with ICNi
TC-GICA temporally concatenated group ICA TRT test-retest
NeuroImage 163 (2017) 319–341
metric values to describe the functional activations (input) based on intrinsic functional connectivity (embodied in the atlas base maps).
In brief,ICN_Atlas'input consists of a volumetric statistical parametric map (SPM) representing an fMRI activation pattern (input map) and its output consists of a series of numeric values representing different measures of the map's degree of involvement for each atlas base map, for an overview seeFig. 1.
As theICN_Atlastoolbox is integrated to the SPM toolbox environ- ment its inputs can be either (1) the currently available SPM in the
workspace, (2) exportedSPMfTgandSPMfFgmaps, or (3) any kind of data in Analyze of NIfTI format. The current version of the ICN_Atlas toolbox expects input data to be presented in the Montreal Neurological Institute (MNI) atlas space (Evans et al., 1993).
The atlasing algorithm performs labelling of the input map's active voxels (activation map) according to membership based on voxel-wise correspondence analysis of the activation map and the atlas base maps (see below), and calculates a series of overlap, activation extent, and activation density metrics (described below and inAppendix A) based on the labelling.
1.1.2. Atlas base maps: ICN and anatomical atlases
InICN_Atlas’current implementation, three sets of ICN base atlases are available based on labelled Gaussianised statistical maps representing ICNs resulting from group-wise resting-state fMRI data (Smith et al., 2009) and BrainMap Project meta-analysis data (Laird et al., 2011; Smith et al., 2009), see below. In addition, an integer label map representing the whole brain Automated Anatomical Labelling (AAL) atlas is also included as an anatomical reference (Tzourio-Mazoyer et al., 2002). N.B., the atlasing framework is extensible and other atlases (either functionally or anatomically-derived, and/or atlases from other species) can easily be integrated.
The three sets of ICN base atlases are as follows:
SMITH10: the 10 adult ICNs based on ICA decomposition (d¼20) of resting-state fMRI data (http://fsl.fmrib.ox.ac.uk/analysis/
brainmapþrsns/), where d is the dimensionality, representing the constraint on the number of independent spatio-temporal components (Smith et al., 2009);
BRAINMAP20: the 18 BrainMap co-activation networks and 2 noise/
artefact components based on ICA decomposition (d ¼ 20) of the BrainMap Project large-scale neuroimaging experiment meta-analysis data available at http://brainmap.org/icns/maps.zip (Laird et al., 2005, 2011).
BRAINMAP70: the 65 BrainMap co-activation networks and 5 noise/
artefact components based on ICA decomposition (d ¼ 70) of the BrainMap Project large-scale neuroimaging experiment meta-analysis data available at http://brainmap.org/icns/Archive.zip, (Laird et al., 2005; Ray et al., 2013).
For each of these, we have a set ofKatlas base maps that represent ICNs (with the exception of 2 and 5 artefactual components for BRAIN- MAP20 and BRAINMAP70, respectively):ICieach being a statistical map corresponding to an ICA component (IC) which in turn corresponds to one of theKfunctionally stereotypicalICNior artefactual component.
Given this, an ICN-based atlas can be thought of as the union of ICN- specific statistical base maps,ICNi:
Atlas:∪Ki
ICNi;n
; with ICNi;n¼
〈ICi;n〉if ICi;n>T
NaN if〈ICi;n〉T; (1) whereICi;n represents the Z-score ofICiat voxeln, andTis a user-defined
threshold that defaults toZ¼3 for both the SMITH10, BRAINMAP20 and BRAINMAP70 atlases. However, the prototypeICNirequire further treatment for use inICN_Atlasas base maps by assigning each voxelna unique labellncorresponding to the index of the prototypeICNi;nwith the highest Z-score. In other words each base atlas A is an array (represented byf g) of voxel labelslas follows:
A¼ flng; (2)
wherexn represents the Z-score ofxat voxeln; therefore,lnhas a value between 1 andK, orNaN. This scheme ensures that any given voxel belongs to at most one ICN or artefactual component.
Binary versions of the ICN base maps, ICNiBcan also be obtained as follows:
ICNiB;n¼
1if〈ICi;n〉>T
0if〈ICi;n〉T (3)
Each of the resulting atlas base maps are then saved as a matrix of labels and Z-scores, plus information on the defining space (NIfTI affine coordinate definitions) and other descriptive data (including the atlas name and reference of origin.)
The anatomical atlas included with theICN_Atlastool, CONN132, is based on theCONN:functional connectivity toolbox's(https://www.nitrc.
org/projects/conn) combined representation of the cortical and subcor- tical ROIs from the Harvard-Oxford Atlas (Desikan et al., 2006; Frazier et al., 2005; Goldstein et al., 2007; Makris et al., 2006) and the cerebellar ROIs from the AAL atlas (Tzourio-Mazoyer et al., 2002), transformed from 11x1mm to 22x2mm resolution using the SPM toolbox to match the functional atlases' base maps spatial characteristics.
1.1.3. The input map labelling scheme
Voxel-wise labelling of the input maps is based on the label of the corresponding base map voxel:
Ln¼An∩SPMn (4)
whereSPMrepresents the input map, which can be thresholded (SPMt) or unthresholded.
1.1.4. ICN engagement metrics
In addition to the labelling scheme, in an attempt to capture the essence of ICN involvement embodied in the input map quantitatively as completely as possible, we considered a range of ICN ‘engagement’
metrics. The metrics were inspiredfirstly by basic descriptive spatial overlap statistics, and secondly by considering the statistical nature of the input maps; for example, the metric Ii (ICNi Spatial Involvement; see Equation(5)below) represents the ratio of activated ICNivoxels to ICNi
volume and is purely spatial; another,MAi(Mean ICNiActivation), is the ratio of the mean of voxel-wise statistical values over the number of activated voxels in ICNi. The metrics fall into the following categories:
spatial extent (overlap), activation strength, activation density and cor- relation. Furthermore, the proposed metrics are either ICN-specific (vector quantities: one value for each ICN) or global (scalar quantities:
calculated over all ICNs). A total of 11 ICN-specific metrics and 4 global metrics are implemented inICN_Atlasand their definitions can be found inAppendix A. In the following, we focus on 4 metrics in order to simplify with ln¼
argmaxj
〈ICNj;n〉
; where j runs from1to K; if n belongs to any of the K ICNi
NaN; if n belongs to none of the K ICNi
NeuroImage 163 (2017) 319–341
the presentation. This choice is informed by the results of a Factor Analysis (See section2.2‘Demonstration’)aimed at identifying a parsi- monious set of metrics that captureandsummarise ICN engagement for a given dataset.
We used the following variables and symbols in the engagement metrics definitions:
n:voxel index (n¼1, 2,…,M, whereMis the number of voxels in the maps);
jXj: is the number of non-zero valued voxels inX;
Xn: is the statistical value of voxelninX;
: represent the voxel-wise product;
i: represents the ICN index.
The following two metrics are designed to capture the degree of engagement of an ICN in a given input (activation) map in purely spatial terms:
ICNiSpatial Involvement (Ii): ratio of the number of activated ICNi
voxels (jSPMtT
ICNij) to ICNivolume:
Ii¼jSPMt
TICNij
jICNij (5)
In other words,Iiis the proportion of ICNithat is activated in the input map.
Total ICN Spatial Involvement (IT): is a global metric expressing the ratio of the number of activated ICN voxels over the ICN volume over all ICNs:
IT¼ P
ijSPMt
TICNijP P i
ijICNij (6)
The following two ICNiengagement metrics take each voxel's statis- tical score (‘activation strength’) into consideration; these are designed to better distinguish between two input maps with similar degrees of spatial involvement of ICNi(Ii) but different activation strengths, each taking into account the input map's values in the ICNs in different ways:
Normalised Mean ICNiActivation (MAN,i): mean of the normalised voxel-wise statistical values relative to the number of activated voxels in ICNi:
MAN;i¼ P
n
〈SPMt〉nICNi;nBmin〈SPMt〉 max〈SPMt〉min〈SPMt〉
jSPMt
TICNij (7)
where〈SPMt〉nrepresents the statistical value of input map voxeln; min
〈SPMt>and max〈SPMt>are the minimum and maximum, respectively, input map statistical values within or outside the ICNs. The numerator therefore represents the input map's total statistical score within ICNi
(relative to the map's minimum statistical score), normalised to the range of statistical scores over the map. By dividing this by the number of activated ICNi voxels (jSPMtT
ICNij) we obtain a measure of engage- ment‘intensity’.
Relative Normalised ICNiActivation (RAN,i)is the ratio of the normalised mean activation in a given ICN over the total normalised ICN activation and has the same numerator asMAN,i:
RAN;i¼ P
n
〈SPMt〉nICNi;nBmin〈SPMt〉 max〈SPMt〉min〈SPMt〉
P
j
P
n
〈SPMt〉nICNBj;nmin〈SPMt〉 max〈SPMt〉min〈SPMt〉
(8)
The denominator being the sum of the numerator over all ICN, therefore representing the input map's total statistical ICN score,RAN,iis therefore a metric similar toMAN,ibut that is relative to the engagement intensity of all ICNs.
The metrics are applicable either to input maps previously subjected to statistical significance thresholding (SPMt, as in the above definitions) or to‘raw’(un-thresholded) statistical maps. The former may be more appropriate for involvement metrics where the spatial extent of activa- tion is the determining factor, while the latter can possibly be advanta- geous for activation metrics depending on the research question, e.g. to compare activation profiles over whole ICNs for different task or behavioural conditions.
1.1.5. ICN_Atlas output
The toolbox's primary outputs consist of a table containing the values for all 11 ICN specific and 4 global metrics, and a range of visualization options in the form of bar charts and polar plots, some of which will be illustrated below.
2. Material and methods
This section consists of two parts: 1. Validation, on repeat resting- Fig. 1. Schematic of atlasing steps. The input of the toolbox can either be an SPM in the workspace, a thresholded activation map or an activation mask, the input is then up-sampled and/or iso-voxel transformed if needed to match the selected atlas' resolution, then the output metrics are calculated.
NeuroImage 163 (2017) 319–341
state fMRI scanning data from 25 healthy volunteers. 2. Demonstrations, of a methodology for the identification of a parsimonious set ofICN_Atlas engagement metrics in a particular fMRI dataset, and two illustrative applications of ICN_Atlas on task fMRI data and fMRI maps of epileptic seizures.
2.1. Validation
We validated theICN_Atlasatlasing methodology using the New York University (NYU) resting-state test-retest fMRI dataset (https://www.
nitrc.org/projects/nyu_trt), which consists of three rs-fMRI scans ac- quired in twenty-six participants (mean age 20.5±4.8 years, 11 males) who had no history of psychiatric or neurological illness (in accordance with protocols approved by the institutional review boards of NYU and the NYU School of Medicine). The second and third scans were collected between 5 and 16 months (mean: 11) following the baseline scan, in a single scanning session 45 min apart (for details seeZuo et al., 2010b).
In summary, the validation process consists of: First, we performed group and individual-level ICA analyses of the NYU test-retest (NYU- TRT) data. The results of this analysis are sets of group-level and indi- vidual ICs that were subjected to atlasing using SMITH10, BRAINMAP20 and BRAINMAP70 as atlas base maps, to evaluate the proposed meth- odology's robustness in terms of its ability to identify functionally ste- reotypical ICNs. Second, we assessedICN_Atlasatlasing repeatability by quantifying ICN engagement at the individual level across the repeat scans in the NYU dataset.
2.1.1. Group- and individual-level IC analyses
Data pre-processing was performed using the spm8 toolbox (http://
www.fil.ion.ucl.ac.uk/spm/software/spm8/) with the following steps:
(1) realignment and unwarp, (2) normalization to MNI space using the spm8 EPI template as target image, (3) Gaussian spatial smoothing with 6 mm FWHM.
The pre-processed NYU dataset was then analysed by means of in- dependent component analysis (ICA) using MELODIC (http://fsl.fmrib.
ox.ac.uk/fsl/fslwiki/MELODIC) with the temporal concatenation group ICA (TC-GICA) approach (Beckmann et al., 2005) followed by dual regression, resulting in1500 (25 subjects * 3 sessions * 20 component) individual-level ICs (Beckmann et al., 2009). Data from the three scan- ning sessions were included in the same group ICA, and the number of resulting group-level independent components (IC) was limited to 20 (Smith et al., 2009; Zuo et al., 2010b).
2.1.1.1. Group-level ICN engagement quantification. The resulting group- level IC statistical maps were then thresholded atZ>3, and submitted toICN_Atlasatlasing using the SMITH10, BRAIMAP20 and BRAINMAP70 atlases (all thresholded at Z > 3). Correspondence to the ICNs was quantified using the metricsIi,MAN,iandRAN,i, where the indexiis the name of the relevant atlas base map, for exampleIICN9represents ICNi
Spatial Involvement calculated based on ICN9 of the SMITH10 atlas and RAN,BM20-8 represents Normalised Relative ICNiActivation calculated based on BRAINMAP20 atlas co-activation network BM20-8, while MAN,BM70-2 represents Normalised Mean ICNi Activation calculated based on BRAINMAP70 atlas co-activation network BM70-2.
To obtain an overview of the agreement between base atlases we determined whether the highest three engagement values (for each metric) pertain to the same atlas base maps for any given IC (SeeFig. 3 andSupplementary Fig. 1for details). This number was chosen based on the fact that the top 3 values correspond to between 61-99% and 48–95%
of the totalIifor SMITH10 and BRAINMAP20 respectively, and between 21 and 80% of the totalIifor BRAINMAP70 (see the last rows ofSup- plementary Tables 2–10for details).
2.1.1.2. Test-retest repeatability
2.1.1.2.1. IC voxel-wise repeatability at the group level. Within- and
between-session repeatability of the ICs were quantified as the mode of the intra-class correlation coefficient (<ICCW> and <ICCB>, respec- tively);ICCwas calculated using a formula that does not penalize for systematic differences between scanning sessions (Shrout and Fleiss, 1979; Zuo et al., 2010b), for details of the formulae, seeAppendix B. The mode ofICCwas calculated over voxel-wise values greater than zero using an 80-bin histogram spanning the [0–1] interval (Zuo et al., 2010b).
2.1.1.2.2. ICN engagement repeatability at the individual subject lev- el. Each dual-regressed individual IC was thresholded at Z >3, and submitted to ICN_Atlas atlasing using SMITH10, BRAINMAP20 and BRAINMAP70 (all thresholded at Z>3). Within- and between-session ICC were calculated for each metric on three different levels: (1) on the level of individual atlasing steps i.e. for every IC and individual atlas base map combination; (2) at the level of atlas base maps, i.e. collapsed across ICs; and (3) on a global level, i.e. collapsed across ICs and atlas base maps. This allowed us to capture and characterize the inflated variability caused by the different overlap of activations and atlas base maps at the level of individual atlasing steps, while on the other hand we could es- timate the stability of metrics at the level of the atlas base maps and globally, by averaging this variability out. The normalization bounds (max SPMtmin SPMt) for the normalised activation metricsMAN,iand RAN,iwere matched across input IC maps within any given session for each subject individually to ensure that the relative activation differences between ICs resulting from the same sessions are taken into account.
2.2. Demonstrations
In this section we describe two demonstrations of the application of ICN_Atlas: Firstly, we illustrate the problem of selecting a parsimonious subset of the proposed ICN engagement metrics for a given dataset;
secondly, we show the results of two applications ofICN_Atlas: using a task-based dataset and in the field of epilepsy by quantifying ICN engagement evolution during epileptic seizures.
2.2.1. ICN_Atlas engagement metrics factor analysis
ICN_Atlas' output for each input map consists of the value of each metric for each ICN; for example, for the full set of 11 ICN-specific metrics and using the SMITH10 atlas, this represents an output of 110 values per input map, in addition to the 4 global metrics. While a full set of metrics captures a greater amount of the variance than a subset, and therefore may be more useful for a complete analysis, we propose that a reduced subset may be more efficient for many applications and for the illustrative purposes of this report. We therefore sought to identify a subset of three ICN-specific metrics that satisfies the following criteria: 1) captures a sufficient amount of engagement across a given group or type of data; 2) has limited redundancy; 3) represents a summary of the level of engagement. To this effect, we performed a two-stage metrics set reduction procedure using the NYU rs-fMRI data; in each stage we per- formed a principal component analysis (PCA) and an exploratory factor analysis (EFA). In each variable reduction was performed through a Varimaxrotation that identifies latent factors that represent linear com- binations of existing variables that maximize the shared portion of the variance in the dataset. This was donefirst on the full set of 11 ICN- specific metrics, ICNi Spatial Involvement (Ii), ICNi Relative Spatial Involvement (IRi), Spatial Overlap with ICNi(OLi), Sørensen-Dice coef- ficient with ICNi(SQi), Jaccard index with ICNi(Ji), Mean ICNiActiva- tion (MAi), Normalised Mean ICNi Activation (MAN,i), Relative Normalised Mean ICNi Activation (IRMi), Normalised Relative ICNi Activation (RAN,i), Normalised Mean ICNiActivation Density (IMi), and Pearson's spatial correlation with ICNi(ri) (seeAppendix Afor details on the calculated metrics) and repeated in a second stage on the metrics identified at thefirst stage based on high unicity and highest loadings on the two factors with the highest explained variance with the aim of identifying three metrics.
NeuroImage 163 (2017) 319–341
2.2.2. Parametric variation of ICN engagement in a task-based fMRI experiment
To demonstrateICN_Atlas' utility on task-based fMRI data, we selected an open access fMRI dataset from the NeuroVault database (http://
neurovault.org/collections/659/) corresponding to the experiment described in Vagharchakian et al. (2012), which aimed to investigate how the language processing networks cope with fast visual and auditory sentence presentation rates. Briefly, neural activations for visual and auditory sentence presentation rates representing 20, 40, 60, 80 and 100 percent sentence durations with respect to a baseline of 5.9 syllables/s presentation rate were collected using fMRI and then analysed using GLM ANOVA with specific linear and non-linear contrasts and exclusive/in- clusive contrast masking (for details see Vagharchakian et al., 2012).
Three distinct response profiles were identified corresponding to (A):
linear increase with stimulus duration, denoted as ‘Sensory profile’ characteristic for bilateral sensory cortices; (B): response collapse for the shortest presentation times, described by the authors as the ‘Post-bot- tleneck profile’, characteristic of activations in the bilateral superior and middle temporal gyri, left inferior frontal and precentral gyri, bilateral occipitotemporal cortex and visual word form area; and (C): maximum activation for intermediate rates, denoted as‘Buffer profile’, character- istic of activity in the insulae, supplementary motor area bilaterally, anterior cingulate cortex, and left premotor cortex. The authors concluded that these response profiles are consistent with a processing bottleneck that is independent of the sensory limitation.
The data available from NeuroVault, consisted of simple group level compression rate vs. baseline contrast maps for each modality and pre- sentation rate, each represented as Z-maps in MNI space according to the available metadata. Here we aimed to show the utility ofICN_Atlasfor parametric data by (1) comparing whether atlasing results obtained with anatomical ROI-based atlasing using the CONN132 anatomical atlas for the available maps are consistent with the voxel-wise results published previously (for details seeVagharchakian et al., 2012), and by (2) eval- uating whether the proposed ICN-level engagement metrics for the BRAINMAP20 atlas can enhance the interpretation of the study's results.
For the anatomical ROI comparison, we selected the following CONN132 atlas ROIs based on their correspondence with the activation clusters detailed in (Vagharchakian et al., 2012): the right and left insular cortices (ROIs CONN132-3 and CONN132-4), inferior frontal gyrus, pars triangularis left (CONN132-10), inferior frontal gyrus, pars opercularis left (CONN132-12), precentral gyrus, left (CONN132-14), superior tem- poral gyrus, anterior division right and left (CONN132-17 and CONN132-18), superior temporal gyrus, posterior division left (CONN132-20), lateral occipital cortex, inferior division, right and left (CONN132-45 and CONN132-46), frontal medial cortex (CONN132-49), supplementary motor area (SMA), left (CONN132-51), Heschl's gyrus right and left (CONN132-84 and CONN132-85). Atlasing was performed on unthresholded input maps, reflecting the lack of information in the NeuroVault metadata to support appropriate significance thresholding.
Nevertheless, for visualization purposes an input map threshold ofZ¼3 was also applied, seeFig. 10, below.
2.2.3. ICN engagement evolution during epileptic seizures
To illustrateICN_Atlas’potential utility in relating BOLD changes to functional networks, we quantified ICN engagement during epileptic seizures in a patient with severe epilepsy (case #4 from Chaudhary et al., 2012).
2.2.3.1. Case report. The patient underwent simultaneous scalp EEG and video recording and functional MRI scanning, during which 7 sponta- neous seizures were captured (SeeChaudhary et al. (2012)for details of the data acquisition and analysis). The seizures originating in the left temporal lobe were classified as typical, meaning that they are associated with clinical manifestations that are well characterised on clinical video EEG recordings. Ictal semiology was characterised by behavioural arrest,
orofacial movements (oral automatisms), manual automatisms and loss of awareness. The seizure developed from stage II of sleep with indication that typical semiology did not fully develop given the constraints of the scanner environment. The patient appeared unaware/unconscious dur- ing the whole seizure. The ictal onset phase was characterised with a left temporal theta rhythm on EEG and no signs or symptoms. During the ictal established phase the abnormal activity on EEG became widespread. The patient exhibited orofacial movements (chewing and jaw clenching) and some jerks involving his head and hands. We considered that the patient did not only show such elementary motor signs, but probably aborted manual automatisms. During the late ictal phase left temporal slowing was evident on EEG and there was no semiology.
2.2.3.2. fMRI analysis and ICN engagement quantification. As described in Chaudhary et al. (2012) the seizures captured during video-EEG-fMRI were partitioned into three‘ictal phases’based on close review of the EEG and video:‘Early ictal’(the start of the seizure),‘Ictal established’
(characterised by rhythmic activity) and‘Late ictal’.
The ictal phase-based analysis of the fMRI data is designed to reveal BOLD patterns associated with the specific electro-clinical manifestations characteristic of each phase The BOLD changes associated with each phase were mapped in the form of SPM [F]-maps at a significance threshold of p< 0.001 uncorrected for multiple comparisons with a cluster size threshold of 5 voxels, and co-registered with the patient's anatomical MRI scan and normalised to MNI space (Evans et al., 1993).
ICN_Atlaswas applied using the SMITH10 atlas to the fMRI map obtained for each ictal phase and ICN engagement was quantified for each ictal phase using the metricsIi,RAN,iandMAN,iwhich were identified in the factor analysis described above (see sub-section 3.2.1 ‘ICN_Atlas involvement metrics factor analysis’in Results).
3. Results
3.1. 1.Validation
3.1.1. Group-level independent components
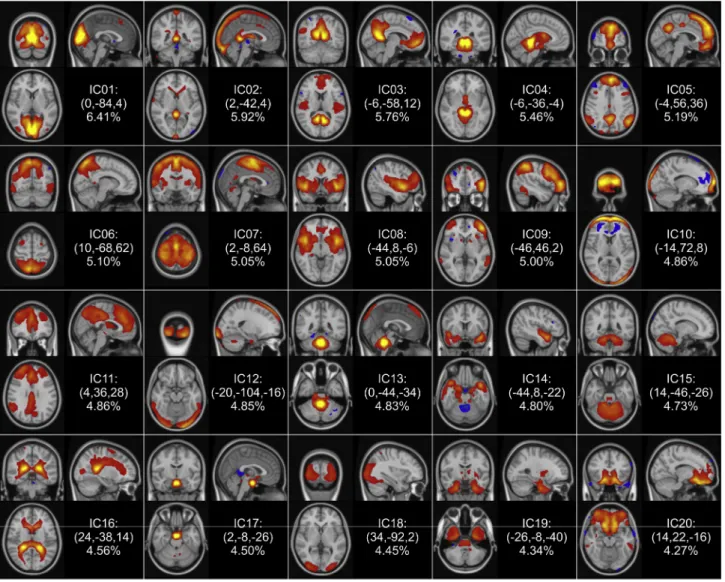
The components obtained with temporal concatenation group ICA (Fig. 2) were consistent with previously published ICNs (Beckmann et al., 2005; Damoiseaux et al., 2006; Laird et al., 2011; Smith et al., 2009; Zuo et al., 2010b) and in particular showed strong similarities with those identified byZuo et al. (2010b), although their ranking in terms of per- centage of variance explained differed.
Thirteen ICs were identified that represent parts or combinations of functionally stereotypical ICNs (Beckmann et al., 2005; Damoiseaux et al., 2006; Laird et al., 2011; Smith et al., 2009) and therefore labelled functional components; these were IC1, IC3, IC5, IC6-IC9, IC11, IC14, IC15 and IC18-IC20. Based on their spatio-temporal characteristics, 7 com- ponents (IC2, IC4, IC10, IC12, IC13, IC16 and IC17) were labelled asnoise components (e.g. typically scanner or physiological noise, head move- ment), which accounted for 34.98% of the variability present in the data.
Concerning the functional ICs, IC1, IC6 and IC18 were found to relate to vision, IC6 also covering the superior parietal cortex and the premotor cortex, IC7 corresponded to the primary motor areas along with the as- sociation auditory cortices, and IC8 was related to the primary auditory cortices and the medial frontal, cingulate and paracingulate cortices, and the insula, and parts of the executive-control network. We observed that some ICNs were distributed across ICs, e.g. IC3 and IC5 represented the default mode network (DMN), IC9 the fronto-parietal networks corre- sponding to cognition and language bilaterally, IC11 the executive con- trol and cingulate/paracingulate networks (complementing IC8). In addition, similarly to Zou et al.: cerebellar (IC18), temporal lobe, tem- poral pole, posterior insula and hippocampus (IC14 and IC19), brainstem (in IC19), and ventromedial prefrontal (IC20) components (Zuo et al., 2010b) were also identified.
NeuroImage 163 (2017) 319–341
3.1.2. Group-level ICN engagement quantification
For all ICs and for each metric at least two of the top three engage- ment values pertained to the same atlas base maps for SMITH10 and BRAINMAP20 while at least one of the top three engagement values pertained to the same atlas base maps for BRAINMAP70 atlasing (Fig. 3 andSupplementary Fig. 1). Comparison of the matching atlas base maps in the top 3 values across engagement metrics and over all IC showed the following: the average numbers of matching atlas base maps were 2.05, 2.10, and 1.80 for theIivs.MAN,i; 2.75, 2.60, and 2.10 for theIivs.RAN,I;
and 2.10, 2.40, and 1.80 for the MAN,i vs. RAN,i comparisons for SMITH10, BRAINMAP20 and BRAINMAP70, respectively. Taken together, the number of matches is significantly lower for theIivs.RAN,I
comparison for BRAINMAP70 compared against the other atlases, and also significantly lower for theMAN,ivs.RAN,icomparison for BRAIN- MAP70 vs. BRAIMAP20. Moreover for SMITH10 the (Iivs.MAN,iandIi
vs.RAN,i) and the (Iivs.MAN,iandMAN,ivs.RAN,i) comparisons were significantly different (p<0.0001), and for BRAINMAP20 theIivs.MAN,i
andIivs.RAN,icomparison was significantly different (p<0.05).
For the sake of brevity, in the following we summarise thefindings by presenting only the highestICNiSpatial Involvement (Ii)metric value across all ICN for any given input map (group-level IC in this instance);
the descriptions of the results for metricsMAN,iandRAN,ican be found in theSupplementary Materials.
Iivalues for SMITH10, BRAINMAP20 and BRAINMAP70 are plotted
inFigs. 4 and 5andSupplementary Fig. 2respectively (for numerical details seeSupplementary Tables 2–4), showing the differing ICN rep- resentations in the three atlases (for details see andTable 1,Supple- mentary Table 1andSupplementary Figs. 3, 4, and 5). The difference in the total extent of the ICN atlases was reflected in the global spatial engagement metricIT(Table 2) with generally lower involvement for BRAINMAP20 and BRAINMAP70 than for SMITH10, since BRAINMAP atlases cover greater part of the brain (and therefore have greater total ICN coverage, which is the denominator ofIT); moreover, as BRAIN- MAP70 can be considered as a subnetwork representation of BRAIN- MAP20 it is not surprising that theirITresults were highly similar. For SMITH10 the temporal lobe and hippocampal components IC14 and IC19 showed low involvement (the highest involvement for IC14 was IICN7¼0.09; for IC19 it wasIICN5¼0.09), compared to BRAINMAP20 (IBM20-1¼0.30 for IC14 andIBM20-1¼0.18 for IC19) and BRAINMAP70 (IBM70-41¼0.44 for IC14 andIBM70-39¼0.48 for IC19).
Overall, the ICN engagement results of the group ICA matched well their functional role; for SMITH10, for visual components IC1, IC6, and IC18 the highest involvement values wereIICN1¼0.97,IICN3¼0.45 and IICN2 ¼0.61, respectively; for IC3 and IC5 (DMN),IICN4¼ 0.75 and IICN4¼0.47, respectively; for the sensory-motor and auditory component IC7,IICN6:¼0.84; for the auditory and executive control component IC8, IICN7 ¼ 0.87; for the bilateral fronto-parietal component IC9, IICN10¼0.82; for cerebellar component IC15,IICN5¼0.64; for executive
Fig. 2. Group-level components of the NYU-TRT data.The 20 group-level independent components (ICs) obtained with temporal concatenation group ICA are shown in coronal, sagittal and axial planes going through the peak coordinates (shown in parentheses in MNI standard coordinates) according to radiological convention. The z-statistic maps are ordered according to the percentage of explained variance, and thresholded based on MELODIC's spatial mixture model at Z>3.
NeuroImage 163 (2017) 319–341
control component IC11, IICN8¼ 0.56; and for prefrontal component IC20,IICN8¼0.24 (seeFig. 4andSupplementary Table 2for details).
The engagement results for BRAINMAP20 showed a similar pattern, for the visual components IC1, IC6 and IC18 the highest involvement values were IBM20-12 ¼ 0.83, IBM20-7 ¼ 0.75 and IBM20-11 ¼ 0.55 respectively; for IC3 and IC5 (DMN),IBM20-13¼0.54 andIBM20-13¼0.58, respectively; for the sensory-motor and auditory component IC7,IBM20- 9¼0.93 (note, that high involvement were found also forIBM20-6¼0.88 andIBM20-8¼0.82); for the auditory and executive control component IC8, IBM20-4¼ 0.88; for the bilateral fronto-parietal component IC9, IBM20-18¼ 0.85; for cerebellar component IC15,IBM20-14 ¼0.62; for executive control component IC11, IBM20-20 ¼ 0.49 (with minimally differentIBM20-15¼0.48); and for prefrontal component IC20,IBM20- 2¼0.60 (seeFig. 5andSupplementary Table 3for details).
The engagement results for BRAINMAP70 showed a pattern consis- tent with subnetwork fractionation, when considered against those for BRAINMAP20, in having similarly high involvement values in some of atlas base maps for most ICs (e.g. for visual component IC1 the highest involvement values wereIBM70-2¼0.98 andIBM70-1¼0.97; for visual component IC6 the highest involvement values wereIBM70-7¼0.85 and IBM70-9¼ 0.80) while for visual component IC18 there was a single highest involvement value of IBM70-3 ¼ 0.61. For the default mode network, components IC3 and IC5 the highest involvement values were IBM70-61¼0.82 andIBM70-38¼0.89, respectively; for the sensory-motor and auditory component IC7,IBM70-35¼0.98; for the auditory and ex- ecutive control component IC8,IBM70-52¼0.98; for the bilateral fronto- parietal component IC9, IBM70-12¼ 0.96, (with high involvement for IBM70-49¼0.89 andIBM70-51¼0.86); for cerebellar component IC15, IBM70-60¼0.83; for executive control component IC11,IBM70-17¼0.74;
and for prefrontal component IC20,IBM70-20¼0.79 (seeSupplementary Fig. 2andSupplementary Table 4for details).
The spatial involvement values for the‘noise’ICs IC2, IC4, IC10, IC16 and IC17 were all<0.3 for SMITH10, with noise component IC12 and IC13 having the highest values:IICN2¼0.39 andIICN5¼0.38, respec- tively. Similarly, for BRAINMAP20 the involvement values for noise ICs IC2, IC10, IC16 and IC17 were<0.30, with IC4, IC12, and IC13 showing
IBM20-3 ¼ 0.31, IBM20-11 ¼ 0.39, and IBM20-5 ¼ 0.32, respectively.
Consistent with the sub-network representation in BRAIMAP70, the
‘noise’ICs had wider range of maximumIi, ranging fromIBM70-56¼0.17
for IC17 toIBM70-58¼0.78 for IC16 (for details seeSupplementary Fig. 2 andSupplementary Table 4).
3.1.3. Test-retest repeatability
3.1.3.1. IC voxel-wise group level repeatability. Across all ICs the modes of the within- and between-session intra-class correlation coefficients
<ICCW>and<ICCB>were in the range of 0.18–0.65. Of the functional
ICs, IC9 (bilateral fronto-parietal network), IC3 and IC5 (parts of the DMN), and IC1 (vision) exhibited the highest repeatability, with (<ICCW>,<ICCB>)¼(0.63, 0.65), (0.64, 0.61), (0.61, 0.60), and (0.61, 0.59) respectively. Most other functional ICs (IC6, IC7, IC8, IC11, and IC14) had <ICCW> and <ICCB> values in the ranges ([0.44–0.58], [0.43–0.53]) while IC19 (temporal lobe) and IC20 (cerebellar) had lower repeatability ([0.21–0.44], [0.20–0.41]), similar to most of the noise ICs (IC4, IC10, IC12, IC13, IC16 and IC17). Note the high repeatability for noise component IC2 (venous sinuses) with<ICCW>¼<ICCB>¼0.65.
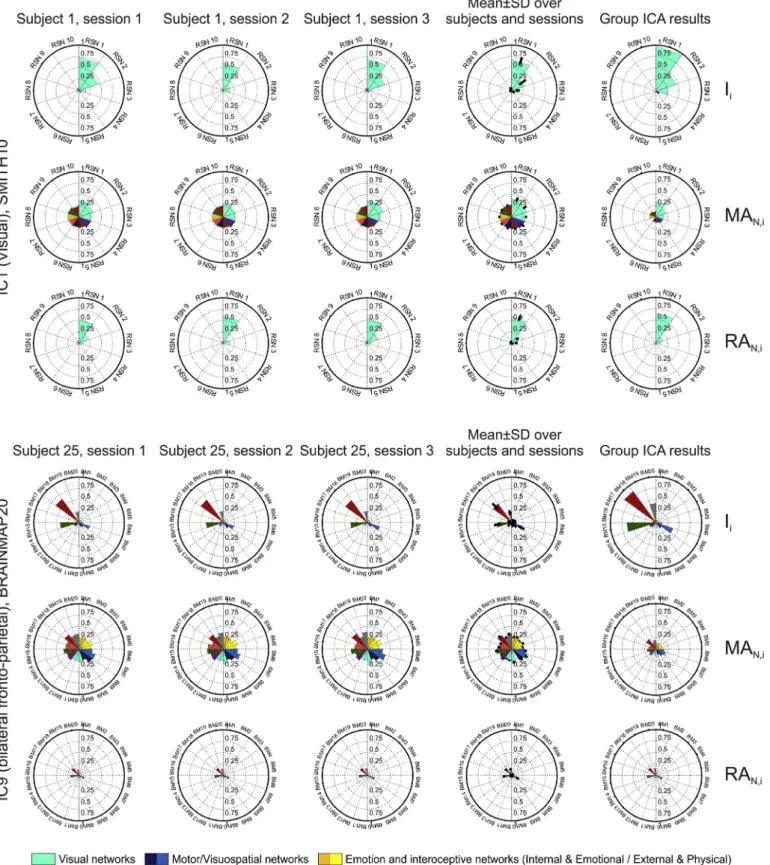
3.1.3.2. ICN engagement repeatability at the individual subject level. The distribution of engagement metric values for individual dual-regressed single-session ICA maps across base maps were similar to those ob- tained by atlasing of the group ICA maps; for a visual comparison seeFig. 6.
At the level of atlasing for every IC and individual base map combi- nation, within- and between-session ICN engagement repeatability var- ied considerably; nevertheless median values indicated fair-to-moderate agreement (seeTable 3,Fig. 7, andSupplementary Fig. 8for details). As expected, within-session ICC tended to be higher than the between- session (Fig. 8). In summary, median test-retest repeatability (<ICCW>;
<ICCB>) for the SMITH10 atlas were (0.37; 0.28) forIi, and (0.63; 0.16)
and (0.30; 0.23) forMAN,iandRAN,irespectively. The results were very similar for the BRAINMAP20 atlas, with test-retestIirepeatability of Fig. 3. Correspondence of the Ii, MAN,iand RAN,imetrics for the SMITH10 (top row) and the BRAINMAP20 (bottom row) atlases. Colour coding is according to engagement values for each IC (columns in each panel) and each atlas base map (rows in each panel), the three highest values for each IC (each column) are marked with white dots in each panel. White vertical bars separate functional ICs from noise ICs, black squares onMAN,ipanels show atlas base maps for given ICs where no voxel was active (i.e. Ii¼0), thereforeMAN,iis not calculated. The highest threeIivalues for any given IC represent 61–99%, 48–95% and 21–80% of the totalIifor the given IC for SMITH10, BRAINMAP20 and BRAINMAP70, respectively (see the last rows ofSupplementary Tables 2–10for details, andSupplementary Fig. 1for BRAINMAP70).
NeuroImage 163 (2017) 319–341
(0.36; 0.28), and (0.66; 0.18) and (0.28; 0.25) for MAN,i and RAN,i
respectively; for the BRAINMAP70 atlas, with test-retestIirepeatability of (0.30; 0.25), and (0.39; 0.16) and (0.24; 0.22) forMAN,iandRAN,i
respectively (see Supplementary Tables 11–28for details). We note a small number of negative ICC values, which were found to reflect mini- mal or null overlap between the ICs and the atlas base maps, as shown in Supplementary Fig. 9.
At the base map level, i.e. collapsed across ICs (hence eliminating most of the IC-related variability), test-retest ICN engagement repeat- ability ranged between moderate and very strong, with median (<ICCW>;
<ICCB>)¼(0.90; 0.90) forIi, while forMAN,iandRAN,ithese were (0.80;
0.60) and (0.90; 0.92), respectively for the SMITH10 atlas. The results were very similar for the BRAINMAP20 atlas, with test-retest atlas base map repeatability forIiof (0.89; 0.87), and (0.78; 0.60) and (0.90; 0.91) forMAN,iandRAN,irespectively; and for the BRAINMAP70 atlas, with test-retest atlas base mapIirepeatability of (0.84; 0.83), and (0.46; 0.46) and (0.83; 0.84) forMAN,iandRAN,irespectively (seeTable 3,Fig. 7, and Supplementary Materials for details).
Finally, ICN engagement metric reliability calculated over all sub- jects, atlas base maps, and ICs, showed strong to very strong agreement, with (<ICCW>;<ICCB>) values of: (0.92; 0.91) forIi, (0.79; 0.61) for MAN,iand (0.91; 0.92) forRAN,ifor SMITH10; for BRAINMAP20, the corresponding values were (0.89; 0.88), (0.78; 0.62) and (0.91; 0.93);
and for BRAINMAP70, the corresponding values were (0.85; 0.84), (0.48;
0.49) and (0.87; 0.89) (seeTable 3,Fig. 7, andSupplementary Materials for details).
3.2. Demonstrations
3.2.1. ICN_Atlas involvement metrics factor analysis
Thefive metrics identified at thefirst stage of the factor analysis using the NYU rs-fMRI data were: two spatial involvement metrics:IiandIRi, and three activation strength-weighted metrics:MAi,MAN,i, andRAN,i. The second-stage factor analysis, performed to limit the number of metrics to three, revealed thatIiandRAN,i, contributed most to the two latent factors, which explained 68% of the variance, and thatMAN,ihad a Fig. 4. ICNiSpatial Involvement (Ii) of the NYU-TRT group-ICA components for the SMITH10 atlas.The ICNiinvolvement metrics are calculated based on the group-level TC-GICA results, ordered according to the percentage of explained variance. This ordering is similar to the one shown inFig. 2. Noise ICs are marked with an asterisk.
NeuroImage 163 (2017) 319–341
high degree of uniqueness.
3.2.2. Parametric variation of ICN engagement in a task-based fMRI experiment
Engagement as estimated byMAN,iwas found to match the‘Sensory profile’(linear increase with stimulus duration) for the visual stimulus modality in the left and right inferior lateral occipital cortex ROIs (CONN132-45 and CONN132-46) and for the auditory stimulus modality in the left and right Heschl's gyri (CONN132-84 and CONN132-85). In addition, theMAN,ivalues for the auditory presentations followed the so- called ‘post-bottleneck profile’ (sudden collapse of activation for the shortest stimulus duration) in the left superior temporal gyrus (CONN132-18 and CONN132-20); for visual stimulation the similar ef- fect was observed for the left posterior superior temporal gyrus (CONN132-20), the left inferior frontal gyrus (CONN132-10 and CONN132-12), left precentral gyrus (CONN132-14), left SMA (CONN132-51), while a pattern of ICN engagement resembling the
‘buffer profile’ (highest activation for intermediate durations) was
observed in the insular cortices (CONN132-3 and CONN132-4) for visual stimulation (Fig. 9).
ICN engagement as estimated byMAN,iand Iishowed differential involvement of ICNs depending on stimulus modality and stimulus duration (compression ratio). Stimulus modality was clearly visible in the differential engagement of visual and auditory/language ICNs.
Regarding stimulus duration, the individualMAN,i andIivalues were found to be stable or increase slightly for easily understood auditory stimuli (60–100% compression ratio), with peak values for the difficult but intelligible (40% compression ratio) and a collapse for the unintel- ligible (20% compression ratio) stimuli, regardless of stimulus modality (Fig. 10). This behavior resembled the phase profile suggested for inte- grative regions (Vagharchakian et al., 2012). These parametric changes depending on stimulus duration represented a network-wide behavior, i.e. they were not exclusively driven by a single or a small group of ICNs.
3.2.3. ICN involvement evolution during epileptic seizures
As illustrated in Fig. 11, ICN engagement as assessed using the Fig. 5. ICNiSpatial Involvement (Ii) of the NYU-TRT group-ICA components for the BRAINMAP20 atlas. The ICNiinvolvement metrics are calculated based on the group-level TC- GICA results, ordered according to the percentage of explained variance. This ordering is similar to the one shown inFig. 2. Noise ICs are marked with an asterisk.
NeuroImage 163 (2017) 319–341
SMITH10 atlasfluctuated across ictal phases. Total spatial involvement (IT) was generally low, with a value of 0.017 in the ictal onset phase, doubling to 0.035 in the ictal established phase and decreasing to 0.020 in the late ictal phase.
With respect to individual ICNs, we note a high degree of involvement in ICN4 (DMN), ICN5 (cerebellum), ICN8 (executive control) and in ICN9 and ICN10 (fronto-parietal) during the Early Ictal phase. Significant involvement intensity changes were seen in ICN6 (sensorimotor network) and ICN8 (executive control) during the Ictal Established phase. The Late Ictal phase was characterised by significantly reduced spatial engagement globally. DMN involvement intensity is maintained throughout the seizures.
We now focus on three ICN, namely the DMN (ICN4), sensorimotor network (ICN6) and executive network (ICN8), in a top down/semio- logical interpretation perspective on ICN engagement.
The DMN shows a pattern of increasing engagement relative to other ICNs across phases. It ranks 5th in terms of ICN spatial involvement at the Early Ictal phase and shows a pattern of increase and subsequent decrease in the Ictal Established and Late Ictal phases, respectively. Its activation level (MAN,ICN4) is roughly constant throughout the phases, but goes from being negligible in intensity relative to globally-observed activation (RAN,ICN4) in the Early Ictal phase to approximately 4th in importance in the subsequent phases.
The sensorimotor network (ICN6), is the second most spatially involved network (after the cerebellum (ICN5)) at the early ictal phase and its activation level grows consistently across phases as does its in- tensity relative to the whole-brain activation level, becoming the most prominent in the late ictal phase.
For the executive network (ICN8) the level of spatial involvement is relatively low in the Early Ictal phase while its activation level (MAN,- ICN8) is roughly constant throughout the phases similarly to the DMN;
however in contrast to the DMN, the executive network becomes very prominent relative to globally-observed activation in the ictal established phase (RAN,ICN8).
4. Discussion
The main objective of the proposed ICN_Atlas methodology is to provide a quantitative and objective framework to characterize fMRI activation (and deactivation) maps in terms of‘functional engagement’in contrast to methods based on anatomically defined coverage and in particular those based purely on visual description of fMRI map anatomical coverage. To this effect it seems appropriate to base the quantification on atlases derived from maps obtained ‘functionally’, namely sets of intrinsic connectivity (or resting state) networks (ICNs) derived based on fMRI data.
We have addressed the issue of validity in terms of repeatability and reproducibility, by applying a commonly used methodology to extract independent components (putative ICNs) from a publically available longitudinally-acquired resting-state fMRI dataset (NYU-TRT dataset).
The resulting ICNs were then subjected to the proposed atlasing scheme using three ICN base maps (SMITH10, BRAINMAP20 and BRAIN- MAP70), thereby providing an assessment of ICN_Atlas’robustness in terms of its ability to identify functionally stereotypical ICNs across scanning sessions. The results of this analysis showed that repeatability as measured by the intra-class correlation coefficient is dependent both on the atlased activation maps and the atlas base map used for atlasing.
Repeatability for the atlas base maps showed moderate to very strong agreement depending on the metric considered. The overall repeatability calculated by collapsing data across subjects, IC maps, and atlas base maps, showed strong to very strong within- and between-session agree- ment. The outcome of the repeatability analysis is on par with previous repeatability estimates obtained on the same data with other approaches (Shehzad et al., 2009; Zuo et al., 2010a, 2010b).
To demonstrate the potential utility ofICN_Atlaswe applied it to two datasets:firstly, an independently obtained, open access task-based fMRI dataset (Vagharchakian et al., 2012), selected to show how our tool can capture variations due to parametric modulations; secondly, we also wanted to demonstrateICN_Atlas’potential utility in clinical research by illustrating its application to fMRI data in one of own areas of expertise, namely fMRI of human epileptic activity.
Conceiving ICN_Atlasas a descriptive tool implies data reduction:
from a whole-brain functional map to a set of numbers of a size that that facilitate comprehension and communication. We therefore considered the issue of the atlas' output, in particular the quasi-infinite number of conceivable engagement metrics (to be calculated for every ICN). Start- ing with a wide-ranging set of ICN engagement metrics devised based on general considerations of fMRI maps' spatial and activation intensity, we Table 1
Functional-anatomical and/or Intrinsic Connectivity Network correspondence of atlas base maps in the BRAINMAP20 and the SMITH10 atlases (for the BRAINMAP70 atlas, see Supplementary Table 1).
ICN
#
Atlas base map (ICN) descriptions
BRAINMAP20 Atlas SMITH10 Atlas
1 Limbic and medial-temporal areas Visual–medial
2 Subgenual ACC and OFC Visual–occipital pole
3 Bilateral BG and thalamus Visual–lateral
4 Bilateral anterior insula/frontal opercula and the anterior aspect of the body of the cingulate gyrus
DMN
5 Midbrain Cerebellum
6 Superior and middle frontal gyri Sensorimotor 7 Middle frontal gyri and superior parietal lobules Auditory 8 Ventral precentral gyri, central sulci, postcentral
gyri, superior and inferior cerebellum
Executive control
9 Superior parietal lobule Frontoparietal
(perception-somesthesis- pain)
10 Middle and inferior temporal gyri Frontoparietal (cognition-language) 11 Lateral posterior occipital cortex
12 Medial posterior occipital cortex 13 Medial prefrontal and posterior cingulate/
precuneus areas, DMN 14 Cerebellum
15 Right-lateralized fronto-parietal regions 16 Transverse temporal gyri
17 Dorsal precentral gyri, central sulci, postcentral gyri, superior and inferior cerebellum 18 Left-lateralized fronto-parietal regions 19 Artefactual component
20 Artefactual component
Table 2
Global ICN Spatial Involvement (IT) for each NYU-TRT group ICA IC.
Global ICN Spatial Involvement:IT
SMITH10 BRAINMAP20 BRAINMAP70
Functional ICs IC01 0.15 0.08 0.08
IC03 0.15 0.10 0.10
IC05 0.15 0.15 0.15
IC06 0.13 0.10 0.09
IC07 0.21 0.17 0.17
IC08 0.23 0.16 0.15
IC09 0.19 0.15 0.14
IC11 0.19 0.12 0.12
IC14 0.02 0.04 0.03
IC15 0.06 0.05 0.04
IC18 0.07 0.04 0.03
IC19 0.01 0.03 0.03
IC20 0.05 0.07 0.07
Noise ICs IC02 0.04 0.06 0.06
IC04 0.03 0.04 0.04
IC10 0.03 0.05 0.05
IC12 0.03 0.05 0.06
IC13 0.03 0.03 0.03
IC16 0.03 0.05 0.08
IC17 0.00 0.01 0.01
NeuroImage 163 (2017) 319–341
Fig. 6. Representative examples of atlasing on dual-regressed individual data, compared to group results. Top panel: IC1 (visual IC) for subject #1 atlased using the SMITH10 atlas;
Bottom panel: IC9 (bilateral fronto-parietal IC) for subject #25 atlased using the BRAINMAP20 atlas. Engagement metrics:Ii,MAN,iandRAN,i. The left three columns show the result for each of the 3 scanning sessions; the fourth column shows engagement metric mean±SD over all subjects and across the 3 sessions; thefifth column shows the Group ICA results.
NeuroImage 163 (2017) 319–341