Journal of Physics: Conference Series
PAPER • OPEN ACCESS
CFD investigation of backward - facing step nanofluid flow
To cite this article: M M Klazly and G Bognár 2020 J. Phys.: Conf. Ser. 1564 012010
View the article online for updates and enhancements.
MMCTSE 2020
Journal of Physics: Conference Series 1564 (2020) 012010
IOP Publishing doi:10.1088/1742-6596/1564/1/012010
CFD investigation of backward - facing step nanofluid flow
M M Klazly1 and G Bognár1
1 University of Miskolc, Department of Machine and Product Design, 3515, Miskolc- Egyetemváros, Hungary
E-mail: v.bognar.gabriella@uni-miskolc.hu
Abstract. Heat transfer enhancement of different nanofluid laminar flow over backward facing step is numerically studied in this paper. The expansion ratio is chosen according to the experimental setup suggested by Armaly H/h = 1.9432. The Reynolds number is taken in a range of 10 ≤ Re ≤ 400. The result showed a primary recirculation region developed after the sudden expansion before it starts to change to become fully developed flow downstream of the reattachment point. The length of the reattachment point increases as Reynolds number increases. The effect of the volume fraction has observed along the downstream wall for Al2O3 -
waternanofluid. Moreover, the impact of the volume fraction on the thermal boundary layer and heat transfer is investigated.
1. Introduction
The flow separation and reattachment of the fluid is one of the common phenomena that happen in many engineering applications. Backward facing step geometry, where the flow separation happens due to a sudden expansion is one of the structures that can be found in heating and cooling devices such as:
nuclear reactors, combustion chambers, flow in valves, cooling compressors blade, electronic cooling equipment, wide angle diffusers, and high-performance heat exchangers. The separation of the flow is unwanted in many of the previous examples due to the pressure drop, which causes energy losses by the additional fan or pumping power. However, in some applications for instance in the burner flame stabilization, the flow separation can enhance the heat transfer, where it is used for turbulence promotion.
In 1950, a study on the separation and reattachment flow over a backward facing (BWF) step was conducted, which was considered as the first study and effort on the BWF flow. Then, due to the improvement in the numerical codes and computational tools the number of researches has started to investigate more types of geometrical and boundary conditions such as horizontal, inclined and vertical cases. A review on the fluid flow and heat transfer using a single phase for laminar mixed convective flow over different orientations steps is made by Abu-Mulaweh [1].
The 2D backward facing step forced convection flow behaviour has been studied both experimentally and numerically. Denham and Patrick studied the flow without investigating the heat transfer effects [2]. In the experimental work, Armaly found that the reattachment point position moves downstream far from the sudden expansion as Reynolds number increases [3]. Furthermore, Shih, Chiang, and others investigated the 3D forced convection flow; the result of their studies shows that the reattachment zone is greater near the sidewall compared to the centre plane of the channel [4-12]. Also, the heat transfer
MMCTSE 2020
Journal of Physics: Conference Series 1564 (2020) 012010
IOP Publishing doi:10.1088/1742-6596/1564/1/012010
phenomena over the BWF is investigated extensively in the literature. This phenomenon has an influence on the fluid flow characteristics due to the buoyancy force. The horizontal flow has shown an irrelevant effect on the buoyancy effect compared to inclined and vertical flow due to the height limitation. The authors of the experiment and numerical works for the 2D airflow over a horizontal BWF heating with uniform heat flux or constant wall temperature have reported that the higher value of the local Nusselt number was noticed to be near the reattachment point while the lower value close to the step, and the recirculation region and Nusselt number decreases as the buoyancy force increases [13- 17].
The 3D backward-facing step has been investigated using various parameters [18-24]. The results showed that the maximum local Nusselt number observed at the area of the reattachment point approximately between the centre-plane and the sidewall. Moreover, the effect of the backward facing step duct orientation was studied [25-29]. The authors reported that the inclination angle between 0° to 180° has a significant effect on the reattachment length, where the increase in the inclination increases the reattachment length and decrease the wall fraction and Nusselt number. However, the opposite behaviour was noticed between 180° to 360° on the reattachment length and Nusselt number. The flow and heat transfer of nanofluid over a backward facing step behaviour was studied for the first time by Abu-Nada [30]. He investigated Reynolds number between 200 and 600 with volume fraction 0 to 0.2 the study includes five different mixtures of nanofluids. In the literature, the number of studies dealing with such a problem is slightly small.
Our goal is to investigate the flow behaviour and heat transfer for a higher concentration of nanoparticles flows. In section 2, the governing equations describe the model are given. In section 3, the geometry generated, the mesh dependency study and the numerical solution method are presented in section 4. The numerical simulations for forced convective flow over a BWF are carried out using different volume fractions. Our aim is to examine the velocity distribution, walls shear and the heat enhancement of the heat transfer at the bottom wall.
2. Model description and governing equations
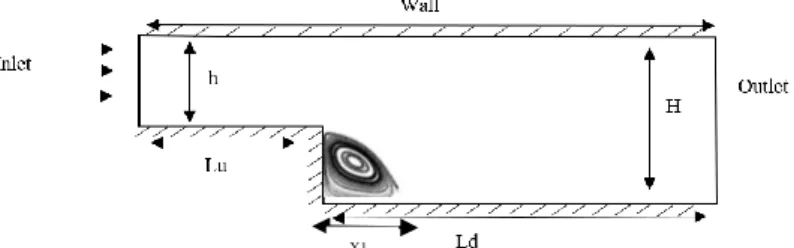
The computational domain is schematically shown in Figure 1. The expansion ratio has been chosen as H/h=1.9432, and the length of the upstream wall, and downstream were Lu = 5 m, and Ld =10 m, respectively. The flow at the inlet was considered to be hydrodynamically steady with temperature of 274 K and the velocity specified by Reynolds number 10 ≤ Re ≤ 400. The downstream stepped wall was heated with constant temperature of 400 K, and all the other walls were fixed to be adiabatic. The single- phase approach for solving the flow of nanofluid problem is adopted in this numerical study. In this approach the following assumptions are used:
The nanoparticles and the base fluid (water) are to be perfectly mixed and treated as a homogenous mixture. Moreover, the fluid phase and the solid particles are assumed to be in thermal equilibrium and move with the same velocity.
Steady, Newtonian and incompressible fluid flow is considered.
The thermophysical properties of the nanofluid are temperature independent and assumed to be dependent on the volume fraction of the nanoparticles.
Figure 1. The schematic diagram of the computational domain
X1
MMCTSE 2020
Journal of Physics: Conference Series 1564 (2020) 012010
IOP Publishing doi:10.1088/1742-6596/1564/1/012010
2.1. Governing equations
Equations (1) to (3) are continuity, momentum, and energy governing equations that present the mathematical formulation of the single-phase model [39][40].
𝑑𝑖𝑣(𝜌𝑛𝑓𝑉⃗ ) = 0 (1) 𝑑𝑖𝑣(𝜌𝑛𝑓𝑉⃗ 𝑉⃗ ) = −∇𝑃 + 𝜇𝑛𝑓∇2𝑉⃗ (2) 𝑑𝑖𝑣(𝜌𝑛𝑓𝑉⃗ 𝐶𝑝𝑛𝑓𝑇) = 𝑑𝑖𝑣(𝑘𝑛𝑓∇𝑇) (3) where the following notations are used:
𝑉⃗ , P, and T present the velocity vector, pressure, and temperature, respectively. 𝜇𝑛𝑓 is the viscosity of nanofluid, 𝜌𝑛𝑓 is density of the nanofluid, 𝑘𝑛𝑓, and 𝐶𝑝𝑛𝑓 are the thermal conductivity and thermal capacity, respectively.
2.2. Thermal properties of the nanofluid
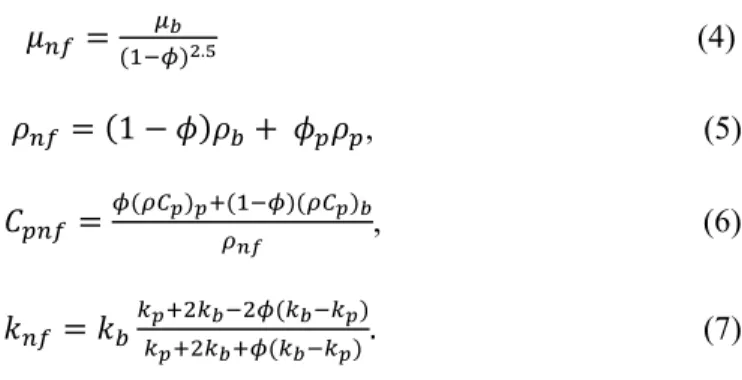
The thermal properties of the nanofluid are modelled as a function of the volume fraction. The viscosity, density, thermal capacity, and the thermal conductivity are approximated depending on the concentration of the nanoparticles in the base fluid using equation (4)-(7) as defined in [31-36]. Table 1. Shows the thermo-physical properties for Al2O3-water at a different values of 𝜙 [37].
𝜇𝑛𝑓 = 𝜇𝑏
(1−𝜙)2.5 (4) 𝜌𝑛𝑓 = (1 − 𝜙)𝜌𝑏+ 𝜙𝑝𝜌𝑝, (5)
𝐶𝑝𝑛𝑓 =𝜙(𝜌𝐶𝑝)𝑝+(1−𝜙)(𝜌𝐶𝑝)𝑏
𝜌𝑛𝑓 , (6) 𝑘𝑛𝑓= 𝑘𝑏𝑘𝑝+2𝑘𝑏−2𝜙(𝑘𝑏−𝑘𝑝)
𝑘𝑝+2𝑘𝑏+𝜙(𝑘𝑏−𝑘𝑝). (7)
Table 1. The thermo-physical properties of water-Al2O3 at different value of 𝜙
Parameter Pure water (0%)
Al2O3-water (1%)
Al2O3-water (2%)
Al2O3-water (3%)
Al2O3-water (4%)
𝜌[𝑘𝑔/𝑚3] 997.1 1026.829 1056.558 1086.287 1116.016
𝐶𝑝[𝐽/𝑘𝑔. 𝐾] 4179 4047.005 3922.4389 3804.6906 3693.2155
k[w/m. K] 0.613 0.63073914 0.6488238 0.6672642 0.6860711
μ[Pa. s] 0.001 0.001025444 0.001051180 0.001079122 0.001107444
MMCTSE 2020
Journal of Physics: Conference Series 1564 (2020) 012010
IOP Publishing doi:10.1088/1742-6596/1564/1/012010
3. Numerical procedure and validation 3.1. Geometry
The geometry is generated by using ICEM CFD, and the two-dimensional flow problem was chosen according to the experimental setup published by Armaly et al [3], where H/h=1.9432 is the expansion ratio. H is the channel height downstream, and h is the height of the inflow channel. In the present study, all the geometrical length is made based on the channel height, Lu =5h is the upstream channel length, while Ld =10 h is the downstream channel length.
3.2. Mesh grid testing and model validation
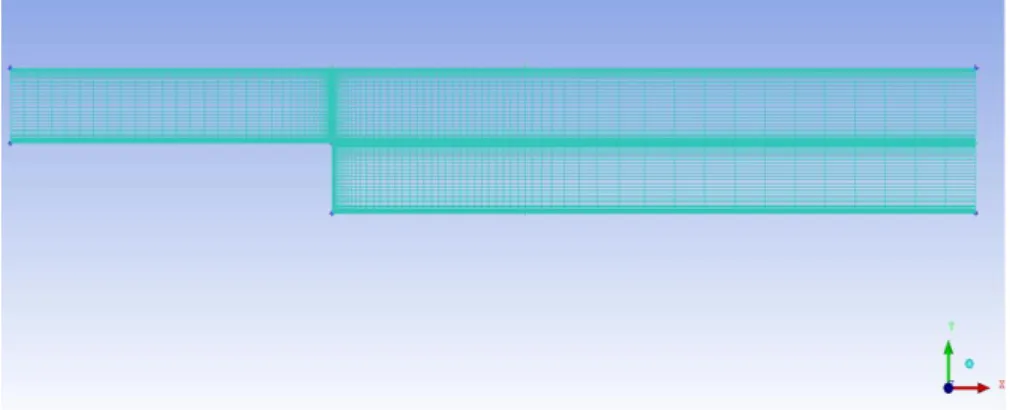
Non-uniform quadrilateral grid system is employed for meshing the domain generated by Blocking method in ICEM CFD as shown in Figure 4. The grid is centred on the walls and the step will give greater simulation accuracy and more efficient computing time. The maximum face size of the mesh was 0.005 m and the maximum aspect ratio 1:2. Four different meshes represent the criteria of grid independency at Re=100 (see Table 1).
The purpose of this mesh dependency study for X1 is to avoid the result relying on the mesh. After the 3rd mesh, the grid difference is less than 1%, which can be considered as grid-independent. For further validation, the result of the reattachment point compared to Armaly's work, where the result showed excellent agreement, as shown in Figure 3.
Table 2. The grid independency
Mesh Size X1
1 25*80 2.6891
2 35*90 2.7078
3 40*100 2.7191
4 50*110 2.7192
3.3. Numerical solution method
A finite volume method (FVM) was used for discretizing the equations of mass, momentum, and energy.
ANSYS fluent solver used to perform the calculations by solving the system of equations (1) – (3) together with the boundary conditions. The solution method was as follows: a simple algorithm was used to resolve the velocity-pressure coupling. The convection and diffusion terms in the governing equations were discretized using a second-order upwind scheme. The convergence criteria of the solutions monitored by a residual monitor of 10-6.
Figure 2. Mesh generation for the model
MMCTSE 2020
Journal of Physics: Conference Series 1564 (2020) 012010
IOP Publishing doi:10.1088/1742-6596/1564/1/012010
3.4. Validation
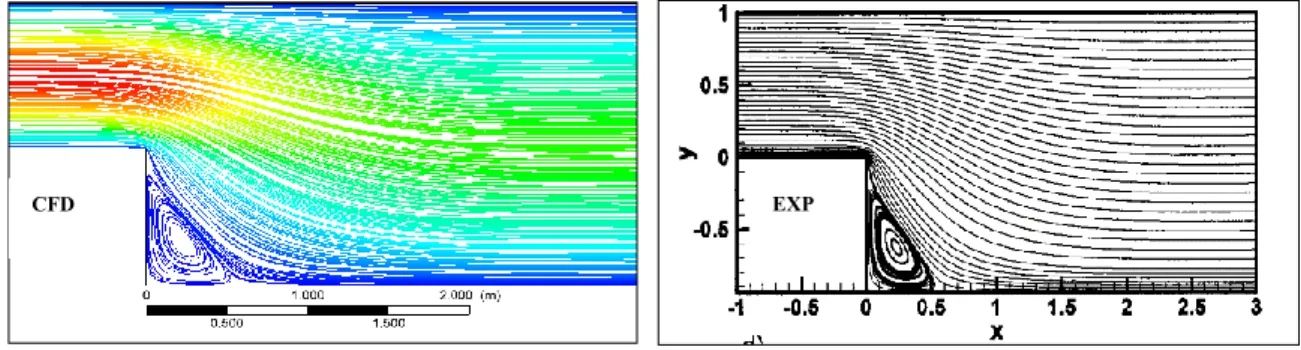
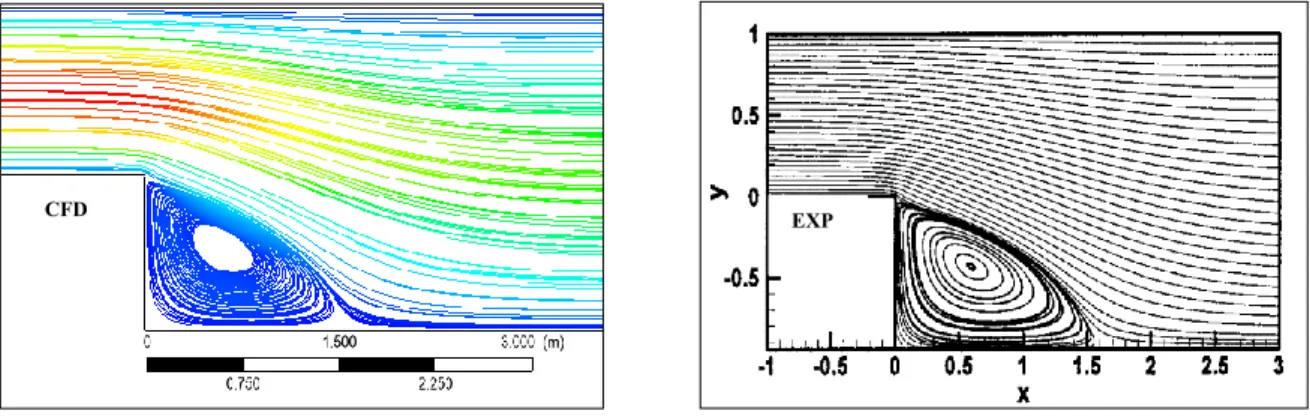
The streamlines of the steady state flow of water are compared with the results of Armaly’s flow field for the same expansion ratio. For Reynolds number Re=10 the flow follows the upper convex corner without revealing a flow separation and a corner vortex is formed in the concave corner after the step.
Figure 4 shows the experimental and numerical simulation result for Re =10. Moreover, for a higher value of Reynolds number, the corner vortex strongly increases in size. At Re=50 it can be seen that the corner vortex reaches up to the corner of the step and covers the complete face of the step. For Re=100 the same behaviour is observed, i.e., with increasing the Reynolds number the size of the recirculation region steady increases. Figure 3 exhibits the variation reattachment length as a function of the Reynolds number and the excellent agreement of the present simulation with the experimental results of Armaly, and Biswas [3], [38].
0 50 100 150 200 250 300 350 400 450
0 1 2 3 4 5 6 7 8
Re
X1
x1[CFD] x1[EXP]
Figure 3. Comparison length X1 of present study with Armaly’s experimental results
Figure 4. Stream line patterns for the flow separation at Re=10
EXP CFD
MMCTSE 2020
Journal of Physics: Conference Series 1564 (2020) 012010
IOP Publishing doi:10.1088/1742-6596/1564/1/012010
Figure 7. Streamline patterns for the flow separation at Re = 400 Figure 6. Streamline patterns for the flow separation at Re=100 Figure 5. Stream line patterns for the flow separation at Re=50
CFD EXP CFD EXP
MMCTSE 2020
Journal of Physics: Conference Series 1564 (2020) 012010
IOP Publishing doi:10.1088/1742-6596/1564/1/012010
4. Result
4.1. Hydrodynamic effect of nanofluid
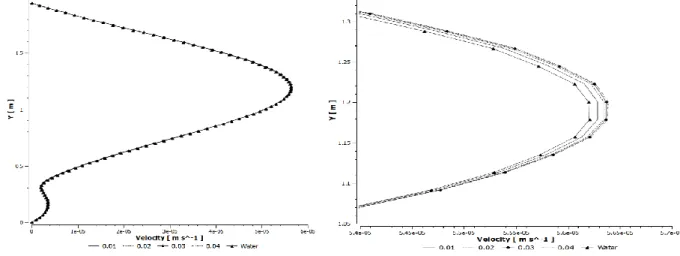
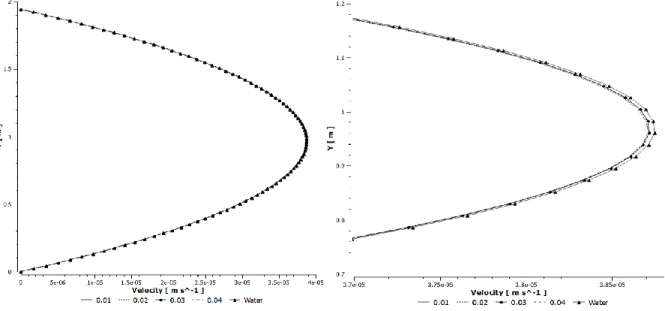
The distributions of the velocity for different nanoparticle volume fractions for Re=100 and at different sections along the downstream channel are shown in Figures 8-10 for volume fraction ϕ=1, 2, 3, or 4%.
The numerical simulations show that the velocity increases as the volume fraction increase at the location x=2, and after the reattachment point the velocity starts to decrease as the volume fraction increases. Two observations are made for the velocity distribution along the downstream wall. The first is for the area between the side wall and the reattachment point, where the result shows that the velocity of the nanoparticles is independent from the sudden expansion and was influenced by the volume fraction, where the velocity increase as the concentration of the particles in the base fluid increases. The second observation after the recirculation zone is that the velocity starts to decrease as the volume fraction increases and that can be seen in Figure 10 at the outlet x=10, and that is shown in Figure 10 at the outlet x=10.
Figure 8. Velocity distribution for different value of volume fraction at x=2m
x=3 x=5
MMCTSE 2020
Journal of Physics: Conference Series 1564 (2020) 012010
IOP Publishing doi:10.1088/1742-6596/1564/1/012010
The effect of the volume fraction on the wall shear stress is presented in Figure 9 along the downstream wall. It can be seen that the wall shear stress has negative value in the recirculation zone, where that is due to the reverse flow in that area. The magnitude of the wall shear stress increases as the volume fraction increases. After the reattachment point, the value of the wall shear stress decreases as the volume fraction increases which explains why the velocity in Figure 8 has its maximum value for 𝜙 = 0.04. Then, the value of wall shear stress increases with the increase in the concentration of the particles after the velocity profile reattached and redeveloped approaching a fully developed flow. As the fluid flows toward the outlet that effect can be seen in the velocity profile Figure 10, where the water has the highest velocity at the outlet.
Figure 11. Wall shear stress at different volume fraction along the downstream wall
-8E-08 -6E-08 -4E-08 -2E-08 0 2E-08 4E-08 6E-08 8E-08 0,0000001
0 1 2 3 4 5 6 7 8 9 10
𝜏w
x[m]
Water 0.01 0.02 0.03 0.04
Figure 10. Velocity distribution for different value of volume fraction at x=10
MMCTSE 2020
Journal of Physics: Conference Series 1564 (2020) 012010
IOP Publishing doi:10.1088/1742-6596/1564/1/012010
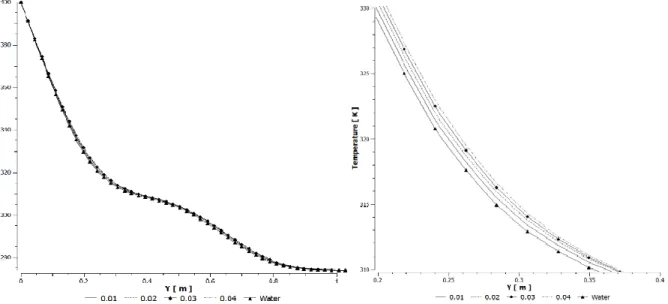
4.2. Thermal effect of nanofluid
Numerical results for the thermal boundary layers at different locations along the downstream wall are presented. Figures 12-14 present the impact of the nanoparticle volume fraction on the temperature profile for Al2O3-water for different concentrations. The thermal boundary layer thickness increases with an increase in the parameter ϕ. Comparison of the temperature profiles for different nanofluid concentration shows that Al2O3-water at 0.04 has the thickest thermal boundary layer. Therefore, it is observed that the nanoparticles change the flow and heat transfer characteristics and causes an increase in the thermal boundary layer.
Figure 13. Temperature profile for Al2O3 for different value of volume fraction at x=3 and x=5 Figure 12. Temperature profile for Al2O3 for different value of volume fraction at x=2
x=3 x=5
MMCTSE 2020
Journal of Physics: Conference Series 1564 (2020) 012010
IOP Publishing doi:10.1088/1742-6596/1564/1/012010
The effect of the nanoparticles concentration on the heat transfer is studied and the result is introduced in Figure 15. The result shows the variation of the average heat transfer along the downstream wall for the five-volume fractions tested fluids 0,1,2,3,4 %. It can be observed an improvement in the heat performance with the increase in the volume fraction. The nanofluid with a 4% volume concentration showed the highest heat transfer values along the downstream wall. From the graph, a remarkable increase in the average heat transfer is located in the reattachment point. This increase is due to the increase in the temperature gradient at the lower wall, which implies an increase in the inertia forces, more, the increase in the concentration results in augmentation in the thermal conductivity.
Figure 15. The average heat transfer along the plate (Al2O3 -water case)
0 0,5 1 1,5 2 2,5 3
0 1 2 3 4 5 6 7 8 9 10
h[w.mk]
x[m]
Water 0.01 0.02 0.03 0.04
Figure 14. Temperature profile for Al2O3 for different value of volume fraction at x=10
MMCTSE 2020
Journal of Physics: Conference Series 1564 (2020) 012010
IOP Publishing doi:10.1088/1742-6596/1564/1/012010
5. Conclusion
CFD simulations of the forced convection flow over backward facing step were carried out. We can summarize our findings as follows:
The flow reattachment points calculated in this paper have excellent agreement with those obtained experimentally by Armaly et al. [3]. We have an excellent agreement with result got simulation by Biswas et al. [38]. Validating the numerical result with measured data given in [3]. In our paper we have pointed on the impact of the Al2O3 nanoparticles in water base fluid. We examined how the velocity distribution, the wall shear stress, the temperature distribution and the heat transfer change with volume fraction of the nanoparticles. The maximum velocity shows an increase with increasing volume fraction at x=2, however at the outlet the impact of ϕ is opposite. It is obtained that the temperature is increased with increasing the volume fraction of Al2O3everywhere. The heat transfer is higher when the volume fraction is bigger. For the downstream wall, the highest heat transfer performance was obtained for maximal ϕ of tested fluids. Our aim is to investigate the impact of the nanoparticle’s material on the velocity and thermal profiles.
Acknowledgment:
The described study was carried out as part of the EFOP-3.6.1-16-2016-00011 Younger and Renewing University – Innovative Knowledge City – institutional development of the University of Miskolc aiming at intelligent specialisation project implemented in the framework of the Széchenyi 2020 program. The realization of this project is supported by the European Union, co-financed by the European Social Fund. The second author was supported by project no. 129257 implemented with the support provided from the National Research, Development and Innovation Fund of Hungary, financed under the K_18 funding scheme.
References
[1] Abu-Mulaweh H I 2003 Int. J. Therm. Sci 42 897
[2] Denhum M K and Patrick M A 1974 Trans. Instn. Chem. Eng 52 361
[3] Armaly B F Durst F Pereira J C F and Schonung B 2006 J. Fluid Mech 127 473 [4] Shih C and Ho C M 1994 J. Fluids Eng 116 228
[5] Chiang T P Sheu T W H and Tsai S F 1997 Comput. Fluids 26 321 [6] De Brederode V and Bradshaw P 1972 I. C Aero Report 72 9 [7] Hertzberg J and Ho C M 1992 AIAA J 30 2420
[8] Tylli N Kaiktsis L and Ineichen B 2002 Am. Inst. Phys 14 3835 [9] Armaly B F Li A and Nie J H 2003 Int. J. Heat Mass Transfer 46 3573 [10] Nie J H and Armaly B F 2004 Int. J. Heat Mass Transfer 47 4713 [11] Hsieh T Y Hong Z C and Pan Y C 2010 Numer. Heat Transfer 57 331 [12] Chiang T P and Sheu T W H 1997 Numer. Heat Transfer 31 167 [13] Aung W 1983 J. Heat Transfer 105 823
[14] Sparrow E M and Chuck W 1987 Numer. Heat Transfer 12 19
[15] Khanafer K Al-Azmi B Al-Shammari A and Pop L 2008 Int. J. Heat Mass Transfer 51 5785 [16] Chen Y T Nie J H Armaly BF and Hsieh H 2006 Int. J. Heat Mass Transfer 49 3670 [17] Kanna P R and Das M K 2006 Numer. Heat Transfer 50 165
[18] Iwai H Nakabe K and Suzuki K 2000 Int. J. Heat Mass Transfer 43 457 [19] Nie J H and Armaly B F 2002 Int. J. Heat Mass Transfer 45 2431
[20] Armaly B F Li A and Nie J H 2002 J. Thermophys. Heat Transfer 16 222
[21] Barbosa J G Saldana and Anand N K 2005 Int. J. Comput. Meth. Eng. Sci. Mech 6 225 [22] Barbosa J G Saldana,. Anand N K and Sarin V 2005 J. Heat Transfer 127 1027 [23] Lan H Armaly B F and Drameier J A 2009 Int. J. Heat Mass Transfer 52 1690 [24] Carrington D B and Pepper D W 2002 Numer. Heat Transfer 41 555
MMCTSE 2020
Journal of Physics: Conference Series 1564 (2020) 012010
IOP Publishing doi:10.1088/1742-6596/1564/1/012010
[27] Hong B Armaly B F and Chen T S 1993 Int. J. Heat Mass Transfer 36 3059
[28] Abu-Mulaweh H I Armaly B F and Chen T S 1993 Int. J. Heat Mass Transfer 36 1883 [29] Iwai H Nakabe K Suzuki K and Matsubara K 2000 Int. J. Heat Mass Transfer 43 473 [30] Abu-Nada E 2008 Int. J. Heat Mass Transfer 29 242
[31] Brinkman H C 1952 J. Chemistry Physics 20 571
[32] Mahbubul I M Saidur R and Amalina M A 2012 Int. J. Heat Mass Transf 55 874 [33] Abu-Nada E 2008 Int. J. Heat Fluid Flow 29 242
[34] Khanafer K and Vafai K 2011 Int. J. Heat Mass Transf 54 4410 [35] Xuan Y and Li Q 2000 Int. J. Heat Fluid Flow 21 58
[36] Kakaç S and Pramuanjaroenkij A 2009 Int. J. Heat Mass Transf 52 3187 [37] Oztop H F and Abu-Nada E 2008 Int. J. Heat Fluid Flow 29 1326 [38] Biswas G Breuer M and Durst F 2003 J Fluid Eng 126 362
[39] Abdullah A Alrashed Omid A Akbari Ali H Davood Majid Z Gholamreza A SShabani Ali Reza S and Marjan G 2018 Physica B: Physics of Condensed Matter 18 30141
[40] Mustafa T 2019 Comput. Meth. Progr. Bio. 19 31698