9
STUDIES
The Goals and Consequences of the Centralization of Public Education in Hungary
1András Semjén – Marcell Le – Zoltán Hermann
DOI: 10.2478/atd-2018-0015
Received: September 19, 2018; received in revised form: November 20, 2018;
accepted: November 21, 2018 Abstract:
Introduction: A robust process of centralization in education administration and school finance has taken place in Hungary in the course of the present decade. The governance, control, and funding of schools has been taken from local government by the state, and the autonomy of headmasters and teachers has diminished.
However, neither the objectives of, nor the motives behind this centralization seem to be completely clear. This paper aims to contribute to the clarification of these objectives and motives, and explores whether the reform has been successful in achieving its declared objectives.
Methods: The clarification of the objectives and motives relies not only on an analysis of the existing literature, but on the textual analysis of various legal texts, together with the use of structured research interviews and press interviews with education policy makers and people working in education administration. Simple statistical methods (including inequality measures and concentration indicators) are employed to determine the impact of the centralization process via the analysis of administrative data on school finances, teacher earnings and student performance.
Results: It was found that while the declared objectives of the centralization included the reduction of inequalities in resource availability and teachers’ wages, and an improvement in equality of educational opportunity, in the first two post- reform years there was a significant drop in the level of resources per student, resulting in a slight increase of inequality of resources. A drop in expenditure may in principle indicate a growth in efficiency, but in this instance this seems actually to have been achieved at the expense of shortages and other school-level problems with a negative effect on the quality of education.
Discussion: The usual requirements to be observed in public sector governance reforms were deliberately neglected, and the reform was carried through in the
1 A revised version of the paper presented at the Kornai90 Conference in Budapest in February, 2018. The research project was made possible by an NKFIH K_17 research grant (contract identification No. K 124867). The authors are grateful to Paul Thatcher for his comments on an earlier version of the paper.
* András Semjén, Institute of Economics of the Hungarian Academy of Sciences, Centre of Economic and Regional Studies, Budapest, Hungary; semjen.andras@krtk.mta.hu
Marcell Le, ELTEcon, Faculty of Social Sciences of Eötvös Loránd University, Budapest, Hungary; lmarci121@gmail.com
Zoltán Hermann, Institute of Economics of the Hungarian Academy of Sciences, Centre of Economic and Regional Studies, Budapest, Hungary; hermann.zoltan@krtk.mta.hu
10
absence of any pilot study or systematic impact assessment. This is all the more problematic as the recent literature on the experience of other countries does not provide unanimous support for centralization. Further, given the declared objectives of the reforms, it is rather remarkable that no systematic monitoring of results was put into place.
Limitations: The analysis offered here is confined to the short term effects of the reform. A more complete evaluation of the reform will only be possible later, when the longer term effects of the process become clear. The relatively short time since the reform does not allow the definitive identification and evaluation of the effects of the centralization on student performance. However, the short-term effects on inequalities in school finances and teacher salaries are worth investigating at this point. The limited availability of school budget data from the pre-reform period restricts somewhat the reliability of the analysis of the effects of the reform on school expenditure. A further limitation is that the statistical analysis presented here is restricted to basic schools2 only, in the interests of simplifying comparisons.
However, a preliminary analysis of secondary schools showed very similar patterns.
Conclusions: The empirical results are to a certain degree inconclusive. As far as school funding is concerned, the inequality of funding increased right after the centralization, then stagnated and started to diminish significantly only after 2015.
At the same time, from the perspective of school funding per student on the basis of the income of various local authorities, the results seem somewhat more satisfactory, and it is possible to identify some positive effects in this respect.
Key words: education administration, school finance, equality of educational opportunity, inequality of resources, teacher earnings.
Introduction
There has been considerable disagreement over the merits of centralized and decentralized approaches to public service provision in the literature. The performance of centralized or decentralized public management in general is an important and much disputed topic in public economics. Proponents of decentralization usually refer to theories of fiscal federalism: they expect better information at the local level, competition between municipalities, and better incentives, all leading to the more efficient provision of services and gains in efficiency (Oates, 1992). Others emphasize the possible disadvantages: externalities, common pool related problems and greater inequalities, an important concern for education policy (Weingast, 2008). Bishop and Wössmann (2010) set up a model of educational production incorporating the effects of institutional arrangements on student performance, and demonstrated that a lower level of administrative decision-making can lead to more informed decisions, but may also divert spending, due to collusion, the result of close ties with headmasters and school- based interest groups, for example. On the other hand, centralized decision-making and administration may increase monitoring costs and lead to excessive bureaucracy.
As in other fields of public management (see e.g. Shah et al., 2004), the issue of centralization or decentralization remains controversial in the governance, funding and provision of education, as well. It is not difficult to present a case for centralization: one
2See footnote 10 for explanation of the term.
11
can find a number of countries with fairly centralized education policy decision-making and school funding systems that perform quite well (cf. Green, 1997a; Leung, 2004 or Györgyi, 2015). Based on the comparative analysis of IEA and IALS results for a small group of selected countries, Green (1997b) also concludes that centralized educational systems rate higher in educational achievement than decentralized ones. Both elementary and secondary education exhibited a significant move towards greater centralization in the US under the first and second George W. Bush administration according to Manna (2013). However, in several countries, regarded formerly as examples supporting the advantages of centralized systems, there has been a marked shift towards decentralization recently (see Bajomi, 2013 on France; Leung, 2004 on some East Asian countries, or Lundahl, 2002 on Sweden). In the US there was a subsequent shift towards decentralization under the two terms of the Obama administration: the former punitive consequences for low-performing states and school districts were mostly eliminated, and the “Every Student Succeeds Act” restricted the power of the federal government to impose academic requirements on schools. The positive impact of decentralization on school quality improvement in the US is dealt with in, among others, Cohen (2004) and Bernbaum (2011). There is also an extensive literature on successful decentralized and school-based management systems (e.g. Barrera-Osorio et al., 2009; McGinn & Welsh, 1999; Zajda & Gamage, 2009).
It seems that there is a balance to be struck between the centralized and decentralized elements in public education. Analyzing the behavior of various American states, Manna observes that the three dimensions of education governance along which a state might decide to centralize are the political, the administrative, and the fiscal (2013, pp. 686- 687). According to his findings, greater political and administrative centralization is strongly associated with more equitable outcomes via smaller achievement gaps and better achievement, respectively, while the centralization of finances seems to be unrelated to student performance (Manna, 2013, p. 688). Wössmann (2001) provides similar findings after analyzing how various institutional features and policies affect student performance. The conclusion reached is that the setting of school budgets, performance goals and curriculum is best left to the central authorities, while the purchase of supplies or the choice of teaching techniques should be decided at school level, as long as there are adequate monitoring and assessment systems in place.
The present paper analyzes the objectives and results of a policy reform in public education in Hungary which changed a broadly decentralized system of local government-run public education3 to one governed and run at the national level. It should be noted that the direction of the reform (from decentralized to centralized) is somewhat unusual, given the international trend towards decentralization. Centralization in economic administration is known to be inefficient; in public sector service provision,
3This earlier system was also not free from inherent problems, e.g. there were extreme differences between local governments in their size or revenue-generating potential, and although they had a high degree of autonomy in terms of their expenditures, they had little autonomy on the revenue side. (Central government gave a student-based education grant to each local government to fund their education expenditure partially. However, the student-based grant was not earmarked for education, and there was no obligatory student-based formula for the funding of schools. Local governments were supposed to supplement the grant from their other revenues.) Many small local government units also lacked the necessary expertise and personnel to run local education services smoothly and professionally.
12
however, a centralized system may perhaps be effective and might further government goals (including a better quality of service and smaller inequality). The question posed here is whether the results of the Hungarian reform support this hypothesis.
The real motives behind centralization are examined by contrasting its actual consequences to expected results. First, the motivation of the central government in introducing this reform is looked at in the context of several explicit policy objectives, including the curbing of public education expenditures in the short run to ensure macroeconomic stability, increasing the efficiency of schools, and decreasing inequalities between jurisdictions. Second, the impact of the centralization reform on the level and distribution of resources (school spending, teacher compensation) and outcomes (student achievement) is described.
The analysis offered here has certain limitations. First of all, in the analysis of school- level financial data the investigation was restricted to the years between 2012 and 2016.
Due to the lack of reliable school-level data for the years of the pre-reform era, only 2012, the last pre-reform year, could be used as a basis for comparisons. Even for this year, data were missing or obviously erroneous for many of the schools, so it was necessary to restrict the analysis to those schools which had reliable financial data for 2012 (and also had data for the 2013-2016 period). In the analysis of teacher earnings, based on wage survey data, however, data for a longer pre-reform period (starting in 2009) were available; here, unfortunately, due to some changes in the survey methodology (see footnote 14), 2016 had to be omitted from the post-reform period.
Nonetheless, the results of some simple statistical analyses do illustrate what happened after the centralization. The centralization of education governance and finance was, however, not the only change over the years: the amount of fund allocated to the financing of public education also changed considerably within the post-reform period, and there were some other, less important changes in education administration in the course of these years. In such a situation, it would be extremely difficult to identify and separate the individual effects of the parallel administrative and financial changes.
However, the centralization of school governance and the changes in the level of funding may reasonably be considered different parts of the same package. And even if it is not possible on the basis of the calculations performed to claim that the findings in the field of (in)equality of opportunity per student resources or teacher earnings are a direct consequence of centralization, it is possible to say that they are probably the result of the package as a whole. The picture is even more complex regarding the results in relation to student performance indicators, as the changes in student performance can reflect many other factors, and there is likely to be a considerable time lag between changes effected in education administration, school governance and funding and consequent changes being observable in performance indicators. Nevertheless, it is reasonable to believe that in spite of all these limitations there is some utility in examining changes in student performance indicators during the investigated period.
The contribution of the present paper to the literature on the effects of decentralization is twofold. First, evidence on the effects of an unusual shift from decentralized to centralized education governance is provided, while the literature mostly focuses on the impact of a move towards more decentralization. Second, these effects are analyzed in the context of the policy goals of the reform. The re-centralization of Hungarian education administration and funding serves as a case study illustrating that, although there may be certain good examples of centralized service provision in the public sector
13
internationally, in the absence of a well thought-out system of incentives, abrupt centralization and a military-type organization in public services may quickly lead to manifest failures. It should be stated, though, that the lack of positive results of centralization does not prove that it cannot work; what it does show is that it will not work automatically.
1 Centralization reinvented
Excessive centralization in economic administration was a well-known and much- criticized phenomenon of socialist command economies, and its numerous problems were demonstrated quite early (Kornai, 1959). These centrally managed economies worked through direct bureaucratic control. Once the transition to market economy started together with the change of the economic and political system, most economists, including Kornai himself (Kornai, 2012, pp. 569-570) supposed that this would lose its relevance to economic policy, and would only be discussed perhaps on courses on the history of economic thought. However, after 2010, there came a U-turn in Hungary (Kornai, 2015), where now the topic appears to be once again relevant, and it may also spread to other transition economies flirting with the concept of illiberal democracy.
"The obsession with centralization, which is intertwined in many ways with the aforementioned tendency to nationalize, affects almost all spheres of society", writes Kornai (2015, p. 6). This obsession has certainly left its impact on many facets of life in Hungary over the last 8 years, most notably on the government itself (including local government, see Dobos & Soós, 2014), public utilities (state-owned monopolies instead of privatized utility companies) and public services (health care and public education).
The strengthening role of government in the provision of public services and utilities is a manifestation of a broader general trend towards centralization (Rosta, 2014; Kornai, 2015). In a recent online interview, a political scientist and a former FIDESZ MP, Péter Tölgyessy, talks of the permanent centralization of power as a characteristic feature of the present Hungarian political system (plankog, 2018). He sees centralization as a consequence of a political logic that trusts government actions or interventions far more than the invisible hand: "The idea of market capitalism, envisioned in '89, has changed into state-managed capitalism. Results are once again expected from governmental action. The permanent centralization of power is only a consequence of this logic. This permanent centralization, however, continuously trims down the institutional feedback that is essential to government efficiency."
It was no coincidence that Government's Bill T/8888, introduced in Parliament in October, 2012, from which the later "Act CLXXXVIII of 2012 on taking over the control and funding of some education institutions from local governments by the State"
evolved, mentioned the facilitation of the establishment of the “Good State” in the first place when listing the main objectives of this piece of legislation in its preamble. The appearance of this term probably reflects the influence of G. Fodor and Stumpf (2007), consciously misinterpreting good governance as a neoliberal paradigm when contrasting it to the good government model. According to this perspective, by emphasizing the rule of law, voice and accountability, transparency, and the lack of corruption, good governance "speaks the idiom of liberalism" (Fodor & Stumpf, 2007, p. 79). They claim that the concept of good governance aims at demolishing the state, by entrusting the provision of public services to the market, emphasizing the role of the individual's own responsibility in the provision for the of old age and taking the principle of economic
14
rationality valid in every sphere of life (Fodor & Stumpf, 2007, pp. 86-87). Their caricature interpretation of this concept and their views on democracy (a political construction not having any internal value per se, but valued only in as much as it can contribute to the well-being of society) must have influenced the process of re- centralization of education in Hungary. The consequences can be seen in the almost total neglect of the key principles of good governance in terms of those are generally perceived by the mainstream (Pollitt & Bouckaert, 2011, pp. 21-22; CIPFA & IFAC, 2013, p. 12). This neglect is especially manifest in the lack of definition of the expected social and economic benefits of centralization, in the complete lack of stakeholder participation in decision-making, in the absence of any clear targets and in the resulting lack of accountability. Their views, also echoed by Kákay (2013), are those which probably contributed to the transformation of the centralization of public education into an ideologically motivated ultimate goal, no matter the consequences.
2 Recentralization of public education in Hungary after 2010
2.1 The first phase of the reform
There has been a strong and rapid centralization process in education administration, school governance and education finance (school funding) in Hungary over the last 8 years. The cornerstones of this reform were laid during its first phase, in the first years of the present decade. These are the law on National Public Education (Act CXC of 2011);
and a law (Act CLXXXVIII of 2012) on the taking over of the control and funding of some education institutions from local government by the state (i.e. the central government).
The main characteristics of this reform process were the following:
- Educational institutions (schools) were no longer operated by local our county governments but by a central mammoth organization, the Klebelsberg Institution Governance Center (Klebelsberg Intézményfenntartó Központ, abbreviated as KLIK).
- Parallel to the reorganization of public administration through the reinstatement of districts (járás in Hungarian), the work of KLIK was organized according to school districts. However, school districts became completely independent of the district- level public administration, and they constitute the regional branches of KLIK, an independent government agency. Initially, there were 198 school districts, covering the 175 districts of the country and the 23 districts of Budapest.
- Eight-year basic schools providing elementary and lower secondary education (ISCED 1 and ISCED 2 levels), are generally operated by the local branch of KLIK.
Secondary schools including vocational schools, vocational secondary schools and academic secondary schools (called gimnázium in Hungarian) offering non- vocational ‘academic' upper secondary education programs are usually operated by the county center school district in each county.
- County center school districts had to some extent to organize and control the work of the school districts situated in their county. Nevertheless, most of the important decisions had to be approved by the Centre itself; it had to supervise the operation of each of the 198 units. This organizational structure made the work of the Centre extremely difficult.
- Current education expenses, including teacher wages, became centrally financed by KLIK, the new biggest employer in the country. Central budgetary allocations to
15
local governments were cut substantially. Local school districts have not become independent budgetary institutions and do not know their "budgets" exactly – so- called ‘soft’ budget constraints (Kornai, 1986) on local education were replaced by even less well defined, fuzzy ones.
- The previous salary scale for teachers practically set only the lower salary limits for the different categories of teachers (according to their degrees and length of service).
This was replaced by a far more strictly regulated universal salary system based on a national career path model.
- As a general rule, the ownership rights and maintenance duties with regard to school buildings remained in the hands of local governments initially. However, for small communities or for those not willing to cover maintenance costs, the task could be transferred to the central level. If a local government transferred its maintenance duties to the center, it was supposed to pay a contribution to the costs of maintenance. This system was a permanent source of conflict.
- The rights and powers (including employer rights, the choice of teachers and school personnel, or the autonomy in dealing with everyday management problems, purchase order placements, etc.) of headmasters or principals diminished drastically.
Decisions in trivial matters were often referred up to the Center, which had little information to base a proper decision on. The professional autonomy of schools and teachers diminished considerably. The freedom to use a licensed textbook was severely reduced, and the number of approved textbooks cut drastically. Officially- approved new textbooks contained serious mistakes and were often considered inferior to those previously used by teachers' associations and unions.
It was clear from the beginning that these changes must have far-reaching consequences on the operation of schools, the fairness and equity of school funding, the quality of education, and probably on student performance and outcomes, as well. However, the specific education policy objectives (final outcomes) these legal and administrative changes were expected to serve or supposed to bring about have never been clearly formulated in terms of measurable education performance indicators that would make accountability viable. The objectives of the reform in terms of final outcomes were not communicated clearly to the public.
Given the relatively short time since the most important legislative, regulatory and administrative changes in this centralization process took effect, it is quite understandable that the available Hungarian research literature related to the topic is somewhat limited. Most of the papers encountered in the course of the present research are either speculative or purely descriptive, or they attempt to place the process in an international and/or long-term historical context (see for instance Kozma, 2014; Madaras
& Varga, 2014; Péteri, 2015; Fehérvári & Szabó, 2015). Another paper, Györgyi (2015), is mostly based on qualitative research and case studies. As for the level of public support or the quantitative consequences of the changes reshaping education administration, school governance and school funding, little empirical research has been done so far. However, Péteri, 2014; Semjén, 2014 and Brecsok, 2014 do offer some results in this respect.
16 2.2 The second phase of the reform
It is difficult to tell exactly whether the various steps of this phase were already foreseen and pre-planned at the beginning of the centralization, or became only necessary in order to correct the faults and the unwanted consequences of the first phase. Based on the research interviews (for more on these, see later), however, the authors of the present study incline towards the belief that at least some of the later steps were not foreseen at the beginning of the reforms and were meant to correct the pitfalls of the earlier measures in some sort of a “trial and error” process.
From 2014 on it became increasingly accepted even within the administration that the middle level has to be strengthened and more tasks have to be delegated to county center school districts to make the new system work more smoothly. A pyramid-like structure was recommended at that time, together with the strengthening of the autonomy of the county center school districts. Although unpublished internal reports fiercely critical of the new system circulated within the Ministry, no independent appraisal of its results and problems was prepared and made available to the public.
After some former minor changes, the heavily criticized original organizational structure of KLIK was radically changed. This change took effect at the beginning of 2017.
Although the complete failure of the previous organizational structure was definitely not communicated that way4, the scope of the changes showed that the government had obviously recognized the failure of the 2013 centralization.
The main legal steps of the second phase were the amendment (Act LXVI of 2015) of the existing Vocational Training Act (Act CLXXXVII of 2011), and of another act on Adult Training (Act LXXVII of 2013,) together with some other related acts. Further, there came the amendment of some acts related to the regulation of education and some other related acts (Act LXXX of 2016), plus finally a decree (Government Decree 134/2016. [VI. 10.]) concerning organizations that perform state tasks in public education as school operators, and the Klebelsberg Centre. Here, the focus was on redefining school districts, and revising the problematic original organizational structure of KLIK. The important features of this phase of the reform are listed below.
- The task of overseeing vocational training institutions was moved to the Ministry of National Economy, and thus KLIK's former powers in relation to these schools were also transferred to a newly established organization.
- From the beginning of 2017, the nationalization of municipal schools progressed further and the asset management rights were transferred to the state (in practice to the regionally competent school district). Although local government formally remained the owner of school buildings (often constructed and financed from their own resources), practically they lost their ownership rights over the buildings almost entirely. Moreover, central budget subsidies to local governments were once again cut substantially, since the task of school building maintenance also became a responsibility of central government.
- A so-called solidarity contribution calculated according to the size of the municipality's local tax revenues (Kelemen, 2016) was introduced, and is now
4 Although the complete failure of the previous organizational structure was never admitted out loud, and the need for a new design was not communicated to the general public as a consequence of such a failure, in a press interview when a journalist’s question suggested that it was a failure, it was no longer denied officially by the leader of Center (see Miklós, 2017).
17
collected from more affluent local government districts to finance school maintenance expenses partially. Many municipalities found this contribution unfair and some of them turned to the courts, initiating litigation.
- Perhaps the most important feature of this second phase was that the extremely centralized “one center - 198 school districts” governance system of KLIK was completely redesigned. Each former regional branch was transferred to a newly established (bigger) school district. The (originally 58, now 60) new school districts became the employers of school staff, including the teachers. The new school districts are not only much bigger, but, since they also became autonomous budgetary organizations, they got far more autonomy than their predecessors ever had.
- The Center of KLIK was also renamed and remodeled: the Klebelsberg Center (Klebelsberg Központ or KK) now organizes the work of school districts and provides supervision and professional guidance to them, but the decisions are made by the individual school districts themselves. This change was at the same time a further step in centralization (as the number of school districts was reduced drastically), and a massive decentralization at that, as their responsibilities and degree of autonomy greatly increased. Headmasters and teachers did not, however, regain the level of autonomy they had in the decentralized system.
3 The objectives and motives of recentralization
Let us try to explore the objectives and motives of recentralization in the mirror of certain legal documents, research interviews and press interviews. Why is such an approach warranted? Given the scope of the changes in the course of the 2012 reform, one might have expected the government to organize a big public campaign to convince voters that the reform was justified and would serve the public good. Unfortunately, this never happened. The objectives, motives and justification of this centralization were never made completely clear to the general public., Neither the preamble of Act CLXXXVIII of 2012, nor the introductory chapter of the original bill offers a detailed explanation enumerating the reasons why legislators thought that the proposed administrative and legislative changes would be beneficial for Hungarian education or society as a whole.
As already mentioned, the original bill simply referred to ‘the establishment of the Good State’ as the main objective behind the new piece of legislation.5 During the parliamentary debate, even the backbenchers from the ruling parties (the government is composed of two parties, FIDESZ and the KDNP) probably felt that this was a rather vague aim, and does not provide a great degree of guidance in matters of education, and, indeed, a new objective was substituted for it. This was the creation of a public education system that provides equal opportunity to children. Press interviews with education policy leaders (e.g. Hoffmann, as cited in Teczár, 2014) or the research
5 Here the influence of a formerly-mentioned fashionable school of thought in Hungarian political science literature (e.g. G. Fodor and Stumpf, 2007 or Kákai, 2013) can be clearly detected.
Unfortunately, the leading exponents of this school completely neglect the usual requirements of the standard good governance literature, (depicted i. a. in Department of Economic and Social Affairs, 2007, Kuppens, 2016 or Holmberg and Rothstein, 2012).
18
interviews which form part of the present work6, conducted in the 2014-2018 period, indicate that the main objective of this drastic reform was to reduce the unfair differences and inequalities in school finance and student outcomes, and to guarantee an equal educational opportunity to every child. This certainly is better suited to an act dealing with education than the previous reference to a vague concept (the Good State), and it could have been more easily monitored and translated into governmental targets.
The other objectives featured in the preamble to the bill (and the law) are:
- the creation of the operating conditions of a state that provides public services fully;
- the improvement and unification of professional standards in the provision of public education; and
- the achievement of a more efficient and cost-effective system of institutional management.7
In most of the research interviews, as also in Teczár (2014), some of the above goals (or goals essentially synonymous with them) are mentioned. The abolition of some anomalies in school funding by local government, the creation of a uniform and more rational funding system, the facilitation of government enforcement of the state's responsibility for education, the raising and unification of professional standards in public education all seemed to be high priorities in the interviews. The people interviewed saw the main reason and justification for the reform in the increased differences in funding, resource availability and student performance occasioned mostly by the differences in the financial means and human resources of various local authorities and in the varying quality of their professional work.
The consequences of the differences between local authorities hit disadvantaged areas especially hard, hindering the ability of the central government to enforce its responsibility for the standards of education. Although the local government system of education funding and governance certainly had its fair share in the problems and failures, and the centralized funding and governance of schools may seem to offer an obvious solution to these problems, it is nonetheless startling that other options were not
6 Ten structured research interviews (nine in 2014, one in 2018) were conducted: two with top level (former) education policy makers in various Orbán governments, two with top level ministry officials dealing with public education, and six with the leaders of KLIK, including its president and five school district leaders. As at this stage of the research the focus was mainly on the motives for the reform, the research was restricted to people who played a role in the preparatory phases or the design or implementation of the reform. It is of course entirely possible that they were inclined to remain faithful to the “official” narrative. At a later stage of the research, however, the intention is to interview Opposition MPs dealing with education policy matters concerning their interpretation of the reform, and also school administrators and teachers in terms of the perceived motives and the actual effects of the reform.
7 In the two decades of decentralized, local government-run public education, some similar objectives (e.g. increasing efficiency by the amalgamation of small schools and encouraging local government cooperation in school provision, decreasing inequalities among municipalities by changing intergovernmental grant formulas and cutting education funding for macroeconomic reasons) appeared regularly on the policy agenda. The national government, however, failed to realize them for several reasons. On the one hand, the broad degree of local budgetary autonomy made supplementary earmarked education grants targeting poor schools ineffective. At the same time, local authorities were capable of resisting the reforms aiming at increasing efficiency.
19
even considered in the preparatory work on the reform. This happened in spite of the strong international evidence pointing towards the proper use of decentralization in education administration.
Since teachers are paid in Hungary according to a centrally set pay scale that determines the minimum level of salaries depending on the level of the teacher's degree and experience, teacher earnings cannot be set freely. In such regulated labor markets, the pay scale usually has a strong influence on the actual level of salaries. Despite this, the majority of our interviewees (education policymakers, government officials and KLIK leaders alike) were of the opinion that in the public school system run by local governments there existed considerable unjustifiable differences in teacher earnings. In well-to-do municipalities, teachers were paid much better than the minimum level in their wage category, while in poorer municipalities even meeting the centrally-set minimum levels often proved difficult. (A former education policy-maker interviewed for this research did not share this view: he thought that this problem was no more than a pretext, and had been inflated in order to justify the reform.)
Differences in the wealth and income of local authorities did affect the quality of education they provided. Directors of school districts mentioned encountering huge gaps even within a single school district: some local governments paid twice the legally required salary through various allowances and bonuses, while others struggled to pay any overtime. Richer local authorities were also able to hire better teachers and spend more on expenses other than salaries. Only a few interviewees noted that baselining expenditure will not bring about equal opportunities, and that such goal would require further structural changes, like the creation of well-equipped and staffed school centers in areas where poorly performing, underequipped small schools exist.
Although centralization in economic administration is known to be inefficient, one might think that in public sector service provision it may be effective and can further government goals regarding quality and equality of opportunity. Opinions of centralized systems vary considerably across groups. According to an education policy leader, the majority of teachers and principals supported the new system, as it benefitted them financially (Teczár, 2014). Especially teachers in poor, disadvantaged schools received a definite increase in salary. However, Péteri (2014) and Brecsok (2014) show that public support for the centralization was not uniform: it was strong within the population of small local authorities, and the age of the respondents was also an essential factor in determining their opinion of the success of centralization in achieving the desired equity aspects.
The most pressing issue experienced by the directors of school districts was that the districts did not know the size of their budgets at the time of the interviews (more than a year after the reform), making financial planning practically impossible. This fuzziness of budget constraint and a conscious underplanning of expenditures (originating in the lack of trust in the local level) probably played a role in the repeated solvency problems of KLIK and the recurring need for its financial consolidation (acknowledged officially in Miklós, 2017). Too much bureaucracy was also another often-mentioned complaint, as little authority and responsibility were delegated to district level, while the central office of KLIK was heavily loaded with tasks, but had little information as to how to solve them properly. Leaders of school districts complained of difficulties in getting resources from the Center to cover the material expenses of schools.
20
Many complained that the dividing line separating the tasks of operating and funding public schools (entrusted to KLIK) from school building maintenance (left in the hands of local governments in the default case) was unclear and uncertain. Local authorities were usually co-operative with the newly established school districts, but they tried to push any expense to KLIK, whenever it was legally ambiguous who the responsible party was. This, in turn, led to lags in financing such expenses, as most of these decisions were centralized. Many interviewees expressed their desire for more efficient school governance and task delegation. Unfortunately, autocorrection mechanisms in the system were barely existent, and the need for them was not a priority for the key educational policymakers. Still, the system underwent a process of continual change in the first years of its existence. As already mentioned, government officials found the answer to these issues in taking the centralization process and the ‘nationalization' of local government schools a step further, removing the maintenance of school buildings from the duties of local authorities. There was a difference between publicly declared and actual motives here: the centralization of school building maintenance was presented to the general public as a response to the demands of the 2016 teacher demonstrations.
However, the aspects of the reform specifically criticized by the demonstrating teachers were completely unrelated to building maintenance duties.
A former Minister of Education, serving now as a mayor in a rich district of Budapest suggested during the interviews that centralization could reflect a general lack of trust in decentralized political processes and the central government's desire for and need to control as many things as possible. (This is just the other side of what Tölgyessy said about the lack of trust in market automatisms, see plankog, 2018). This may well mean that the centralization of education administration is not seen by the government as a means to an end, but as an end itself, an objective per se, having its own, intrinsic value for the government.
Other possible explanations may also be considered. It may be that centralization serves a hidden agenda, or it may help the government achieve some other, undeclared or hidden, objectives. Indeed, many features characteristic to the creation and implementation of the centralization act seem to make sense only if interpreted as the actions of an incompetent government or if the real motives of this act are not those listed in its preamble. There was a complete lack of stakeholder participation in the preparation process. There was no pilot project preceding the general introduction of the new, centralized system over the whole country. A feasibility study and a thorough impact analysis were also missing. Intended outcomes and expected benefits were not defined clearly and translated into targets that could be readily monitored. The resulting lack of accountability was an inevitable consequence of this missing monitoring. These shortcomings led to ad hoc modifications of the system as a response to the occurrence of problems and frequent changes in the top positions of KLIK or the Klebelsberg Center.8
In an interview with the then freshly appointed president of the Klebelsberg Center, a journalist from PestiSrácok.hu (a portal with a reputation for being close to the ruling coalition) claims in her very first question that the centralization failed to achieve its declared goals. She further stated that this was because the management of the Center
8 There were four KLIK/KK presidents in less than five years: by the time a president got a firm grasp of the operation of the system, he or she had already been replaced.
21
was inefficient, and it was unable to fulfill its tasks as an economic unit. Despite one consolidation after another, it repeatedly fell into a debt spiral, had severe liquidity problems and, in the end, it was unable to cover even the most pressing expenses of schools (Miklós, 2017). The new president did not even try to deny this. Moreover, he admitted that in 2016 the original concept was revised and "it moved towards decentralization". He also admitted that the Center had had to be stabilized financially in order to avoid a liquidity crisis, further that "the necessity of decentralization is undisputed". However, he mainly emphasized the reduction of the number of school districts and improved communication between the Center and the management of school districts, as also between school district management and schools. At the same time, he did not even mention the financial independence of school districts.
4 Evidence from data
In this section, descriptive evidence on the effect of the reform on school resources and student outcomes is provided. While resources can be reorganized rather quickly to bring them into line with policy objectives, changes in student outcomes are more difficult (and take more time) to achieve. Consequently, the focus here will be mainly on school resources, offering only some preliminary results on student outcomes.
Here only two aspects of schools resources are analyzed, school expenditure and teachers’ wages. Teachers’ wages deserve particular attention, as these are more directly related to the quality of education than expenditure in general. Both theory and empirical evidence suggest that paying all teachers according to a uniform salary scale hampers equality of opportunity. In the absence of compensating wage differentials or related incentives, most teachers prefer jobs in schools with a more privileged student composition, resulting in positive student-teacher matching: good [bad] teachers work in the schools of good [bad] students (see e.g. Clotfelter et al., 2006, Lankford et al., 2002 and Varga, 2009 for Hungary). However, if teachers working with disadvantaged kids in backward areas are paid systematically less than those working with children with a far more favorable background and living in developed and well-to-do neighborhoods, even a shift towards the uniformity of wage schedules would probably help somewhat to reduce undesirable performance differences between schools.
There exist many different forms of educational institutions within the Hungarian education system. Different education programs (basic school, academic secondary school, vocational secondary school or vocational training school programs) may actually co-exist in the same school. As different education programs obviously have different requirements concerning the qualification of the teaching staff and thus have different cost structures, cost or expenditure levels cannot be directly compared across all schools. It is for this reason that this study narrows the scope of the empirical research to single-program basic schools only, providing education from grade 1 to grade 8.9 When basic schools are referred to later, it means this school type.10
9 However, it was also an aim of this research to check whether the main conclusions would hold for some other types of schools, so some of the calculations were repeated for ‘pure’ secondary schools offering only academic programs or semi-academic vocational programs for students in grades 9-12 leading to a Baccalaureate, thus enabling the students to apply for a place in higher education upon finishing the program. It was found that the average level of current school-level per-student educational expenses in such secondary schools evolved in a strikingly similar way
22
4.1 Equality of resources and of educational opportunity
Evidently, equity and equality have many faces, and equality of opportunity is only one of them (Le Grand, 1992). A just and fair system of education (or any other kind of in- kind benefits or publicly provided and financed services) does not necessarily mean equality in per capita resources, individual costs, use of services, or outcomes. As Levin writes, "the aim of public policy cannot and should not be equality in the sense that everyone is the same or achieves the same outcomes – a state that appears to be both impossible and undesirable. Rather, a commitment to equity suggests that differences in outcomes should not be attributable to differences in areas such as wealth, income, power or possessions." (Levin, 2003, p. 5) Nevertheless, since the research interviews conducted earlier seem to suggest that decision-makers often tend to translate the complex objective of equality of opportunity into some more easily apprehensible goals regarding the greater equality of per-student school-level resources and teacher remuneration, it is also worthwhile taking a closer look at how these were affected by the centralization of funding.
Equality of educational opportunity (the seminal reference here is Coleman (1968)) is a complex concept. Obviously, many factors that characterize children (gender, time spent in nursery and pre-school education, etc.), the household in which they live (i.e. the income, wealth, social status and educational and social background of parents) and their place of residence can have an impact on a child's educational career, achievement and opportunities. There is some agreement that the educational options and opportunities of disadvantaged children compared to the average child's can serve as a good proxy for equality of educational opportunity.
4.2 (In)equality in per-student resources
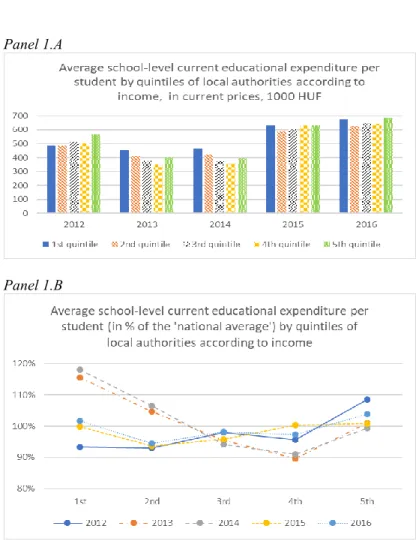
In Figure 1, equality of opportunity concerns are combined with equality of per-student resources as the development of per-student school-level educational expenditure is plotted against the personal income tax base of local authorities. The PIT base serves here as a proxy for the average income situation of parents in the absence of the availability of direct income data of families, and thus the figure may be used to indicate whether there has been any change in the government's preferences concerning the distribution of school-level resources, favoring less affluent local authorities.
to that found in basic schools. There was a stark drop in per-student spending in 2013, which recovered only two years later. The trend of the ratio of averages in the top and bottom quintiles also showed a similar pattern to that of basic schools: this simple inequality index increased greatly in 2013, but decreased below its 2012 level by the end of the period.
10 This 8-year school type (általános iskola in Hungarian) comprises two phases of education:
ISCED1 or primary education in grades 1-4, and ISCED2 or lower secondary education in grades 5-8. (In some texts this Hungarian school type is called the general school, which is the literal translation of the Hungarian term. Here, however, basic school is used throughout the paper.)
23 Panel 1.A
Panel 1.B
Note: The sample consists of schools that cover only grades 1-8, in operation between 2012 and 2016, were under KLIK management starting from 2013, and had reliable financial data available for the whole period (number of schools: 530). Quintiles of local authorities are defined with respect to their average per capita
personal income tax base in 2012. Local authorities are weighted according to the number of students.
Figure 1. Average school-level current educational expenditure per student in basic schools by quintiles of local authorities according to income (thousand HUF, current
prices in Panel 1.A and percentage of yearly ‘national average’ in Panel 1.B), 2012- 2016.
Figure 1 shows how the reform influenced the level of average financial resources and thus the average current educational expenses of public basic schools per student by quintiles of local authorities according to the average taxable income of their taxpayers in 2012 (weighed according to student numbers for 2012). Per-student expenses in current prices were well below their 2012 level for every quintile in the first two post- reform years (2013 and 2014) in absolute numbers, due to the drastic temporary fall in resources spent on basic education (Panel A). However, in 2015 and 2016 the level of expenses already exceeded the levels seen in the last-pre-reform year for every quintile.
24
Panel B shows per-student spending relative to the “national average”.11 While in 2012 current per-student expenditure was above average only in the top quintile, after the centralization there came a shift favouring the poorest local authorities. This shift was especially marked in 2013 and 2014. Relative per-student education expenses in every post-reform year were above their 2012 level in the poorest 40 percent of local authorities. In the second poorest 20 percent of local authorities, per-student expenses were above average in 2013 and 2014 only, and they fell well below average in the last two years of the period. Schools in the third quintile of local authorities spent below the average after the reform (see the dotted lines in Panel B). Basic schools in the second richest 20 percent of local authorities were especially unfavourably affected by the centralization: they show average per-student relative expenses only in 2015, and in the 2013-2014 period they fare much worse relatively than in 2012 (in 2016, however, they are slightly closer to the average than they were in 2012). In the richest 20 percent of local authorities per-student current relative expenses are at the average or above average level throughout the whole period (though lower and closer-to-average in post-reform years than in 2012). All in all, due to the changes at the bottom and top ends of the income distribution of local authorities the centralization was actually capable of diminishing the inequality of per-student spending. Its impact on the local authorities in the middle of the income distribution was more ambigous, and it seems especially unfavourable for the local authorities in the fourth quintile during the 2013-2014 period.
Note: The sample consists of schools that cover solely grades 1-8, were in operation between 2012 and 2016, were under KLIK management starting from 2013, and had reliable financial data available for the whole
period (number of schools: 530).
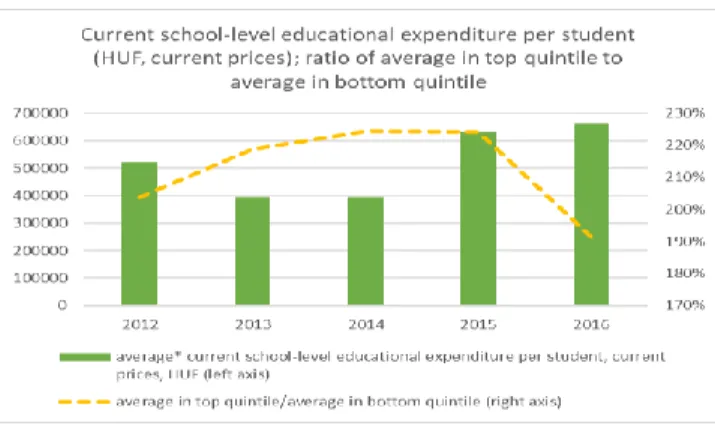
Figure 2. Average school-level current educational expenditure per student (HUF, current prices) and the development of its inequality (the ratio of average expenditure in the top quintile to average expenditure in the bottom quintile), basic schools, 2012-2016.
11 The national average is approximated here by the average in our sample (single-program public basic schools with 8 grades for full-time students, providing data for the whole period).
25
The green columns in Figure 2 show the actual values of average current school-level education expenses per student for each year in the 2012-2016 period in current prices.
They show clearly and more concisely what was also obvious in Panel A of Figure 1, that parallel to the implementation of centralization there was a drastic (more than 20 percent) drop in per-student current expenditure in 2013, and there was no visible change in 2014. Then, in 2015 there came a more than 50 percent increase in per-student expenditure, followed by a further slight increase in 2016.12 It would be reasonable to regard such hectic and awkward changes in the level of resources over such a short period as unhealthy, revealing that sustainability and stability have been in short supply in Hungarian education policy.
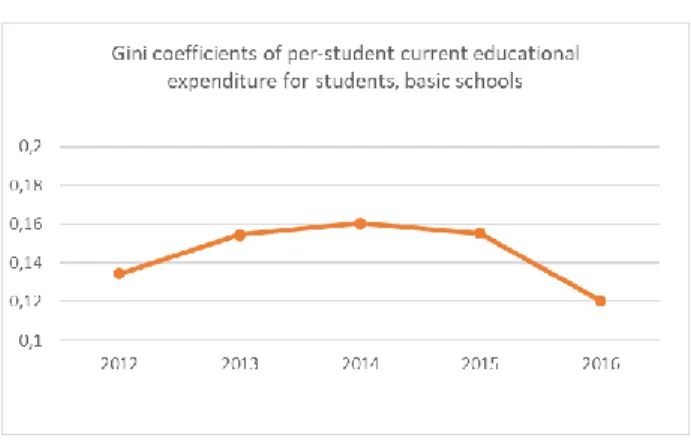
Figures 2 and 3 also investigate the development of equality of per-student school-level education spending more directly. The yellow dotted line in Figure 2 represents the ratio of average current school-level education expenditure per student in the top quintile to average expenditure in the bottom quintile, which is a simple but useful index of the inequality of school funding. Figure 3 illustrates the inequality of school funding in a more sophisticated way, with Gini-coefficients, measuring the concentration of per- student current school-level education expenditure in basic schools.
Needless to say, one cannot determine the actual amount spent on an individual student in a given school and year. However, it is always possible to determine the average spending (average current expenditure) per student in a given school and then assign this average to each student in that school. It is then possible to rank the students featuring in the investigation. Thus one can plot a Lorenz curve and calculate the Gini coefficient of per student school-level current eduactional expenditure (represented by the orange line in the figure).
12 The severe temporary cut in school resources and expenditure seen in Figure 2 caused serious problems in the smooth operation of the system. This cut can be interpreted as an increase in the efficiency of the system (one of the declared reform goals), but it is also possible to argue that the real motive behind the centralization was not the efficiency gain itself but achieving some short-term budgetary saving – i.e. this may be seen as a hidden objective. If one looks at what happened in the longer run, it can be seen that in spite of its initial decrease, per student current expenditure later started to rise and finally reached a higher level than that before the start of the centralization – so there was no lasting efficiency gain, and the lower cost level proved unsustainable. This suits the second interpretation better than the first one.
26
Note: The sample consists of schools (and their students) that cover solely grades 1-8, were in operation between 2012 and 2016, were under KLIK management starting from 2013, and had reliable financial data
available for the whole period (number of schools: 530).
Figure 3. Gini coefficients of per-student current school-level educational expenditure for students, basic schools, 2012-2016.
The yellow dotted line in Figure 2 and the orange line in Figure 3 basically tell the same story: in 2013 (right after the centralization of governance and funding) in spite of the declared objective of creating a more equal funding system, both inequality indices displayed sharp increases, and the growth of inequality continued in 2014 as well, although somewhat less steeply than before. In 2015 the inequality indices changed only very little, but after that they fell drastically, to well below their pre-reform levels.
4.3 (In)equality in teacher earnings
Unfortunately, individual earnings data for teachers at school level are not available.
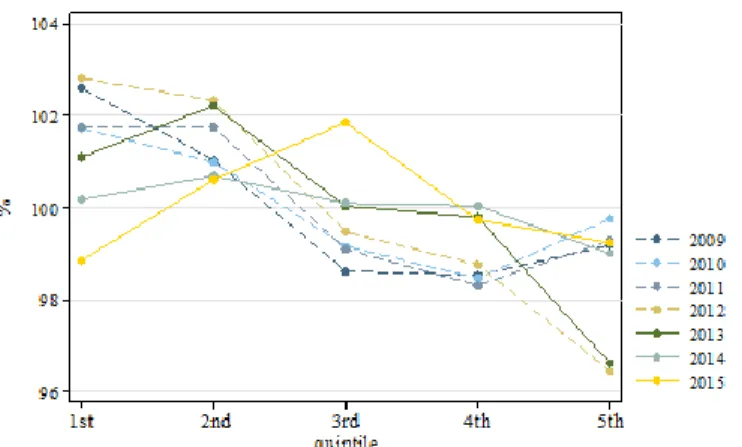
There are, however, individual data on teacher earnings in the public sector from the Wage Survey (Bértarifa Felvétel) Database of the National Employment Service. This database contains wage and earnings data for the competitive sector based on a representative survey; however, all employees of budgetary institutions in the public sector are covered by it. The survey also contains information on the occupation codes13 of the individual employees in the sample. Using earnings data for full-time teachers the development and the inequality of earnings for teachers teaching in basic schools will be investigated. Due to limitations on the availability of data, the analysis is confined to the 2009-2015 period.14
Figure 4 shows teacher earnings by quintiles of local authorities according to income, while Figure 5 shows teacher earnings by quintiles of local authorities according to the
13 According to the Unified Classification System of Occupations (FEOR-08).
14 From 2016 on, the city, town or village where a teacher actually works cannot be identified reliably. Before 2016, teachers were assigned in the wage survey database to the local authority where their school actually was. Starting from 2016, they were assigned to the city or town in which the center of the school district (their employer) can be found. As this would make comparisons by quintiles of local authorities (as in Figure 4 and 5) meaningless, 2016 data had to be omitted from these figures.
27
share of socially disadvantaged children. Both can help the reader to take a closer look at the inequality in a main input of education, teacher earnings. These figures are also relevant from the point of view of the equity-or-equality of opportunity question, as they show the inequality of teacher earnings according to these criteria.
Note: Quintiles of local authorities are defined with respect to their average per capita personal income tax base in 2012. Local authorities are weighted according to the number of students.
Figure 4. Teacher earnings by quintiles of local authorities according to income (for full- time teachers in grades 1-8 [occupation code 2431], as a percentage of average earnings
of such teachers, 2009-2015.
In the two poorest quintiles of local authorities, teacher earnings were below average throughout the whole 2009-2015 period. In 2012 and 2013, the difference from the average is rather large in the poorest 20 percent of local authorities. In middle-income local authorities (third quintile), teacher earnings relative to the average were usually above their pre-reform level for post-reform years with the sole exception of 2014. For the second richest 20 percent of local authorities, earnings were higher than average in all the post-reform years, while they were usually (with the exception of 2012) below average in the pre-reform ones. It is also clear that for all pre-reform years (denoted by dashed lines), in the richest 20 percent of local authorities teacher earnings were about 3- 4 percentage points higher than the average. Relative teacher earnings moved closer to the average after the reform in the top quintile gradually: in 2014, they were somewhat lower and closer to average than in 2013. For 2015, teacher earnings in the richest 20 percent of local authorities had already fallen below the average. Teacher earnings for the richest 20 percent of local authorities were below their fourth quintile level in 2014 and 2015, and in 2015 they were lower than in any other quintile that year. Right after the reform, teachers were still paid much less in the poorest quintile than in any other (as in the last pre-reform year). Later, however, in the other post-reform years, in this quintile they were paid only slightly below the average, and thus the difference in teacher earnings between the poorest and richest local authorities became quite small.
The relative position of teachers in the poor local authorities improved, starting in 2014,
28
while teachers in the richest local authorities definitely lost their previously advantageous relative position after the centralization.
Note: Quintiles of local authorities are defined with respect to the share of socially disadvantaged students in 2012. Local authorities are weighted according to the number of students.
Figure 5. Teacher earnings by quintiles of local authorities according to the share of socially disadvantaged students (for full-time teachers in grades 1-8 [occupation code
2431], as a percentage of average earnings of such teachers, 2009-2015.
In Figure 5 the dashed lines, representing the pre-centralization years, basically decline throughout the first 4 quintiles, meaning that parallel with the growth of the share of disadvantaged children (and the difficulty of teachers' work) teachers’ wages shrank. In 2012, this declining tendency was true even for the fifth quintile. The solid lines in the figure (representing the post-reform years) have the shape of a letter M (2013-2014), or an upside-down letter V (2015), meaning that after the centralization there was some positive change in this respect.
Although in 2013-2014 teachers’ earnings remained above the average in the two quintiles where the share of socially disadvantaged students was lowest, in the next two quintiles they were below average with a decreasing tendency. In local authorities where social problems affected the highest share of children, teachers’ wages remained below average over the whole period, with the lowest points in 2012 and 2013. In the last two post-reform years shown in the figure, however, teachers’ earnings in local authorities where social problems affected the highest share of children were somewhat closer to the average level. 2015 was an especially odd year, in which teachers’ earnings were the lowest at the two ends of the scale (being also below average in the fourth quintile), with relative earnings reaching their maximum in the middle quintile.
The analysis of the inequalities in teachers’ earnings (the relevant figure is not included here due to space limitations) shows that while the inequality of earnings did not seem to change immediately after the reform, in 2014, following a radical increase in teachers’
wages due to a salary reform, it dropped considerably. However, by 2016 earnings inequality was higher than in any of the previous seven years, as differences between the top and the bottom quintiles increased considerably, and the bottom quintile remained at the same level as in 2014.
29
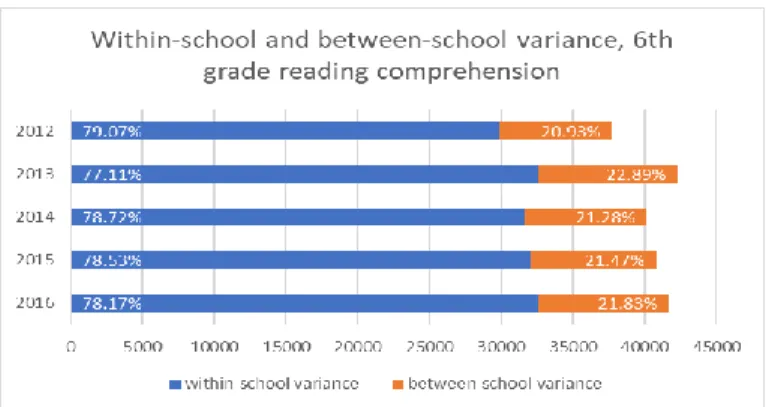
4.4 Inequality of student performance (competency test scores)
As learning is a cumulative process, it is obvious that individual student performance in general and competency test results in particular reflect many different factors15 and are influenced by the whole educational history of the students. Thus, short-term changes in test scores after a reform reflect not only recent changes in the operation, funding and control of education but a much longer process. It is only possible to evaluate the full effect of these changes on student performance in the future, when the long-term effects become clear.
Nevertheless, a fair system of school funding can only serve as a justification of centralization if there is indeed some link between the centralized governance of schools (furthering greater fairness and equity and the equality of educational opportunity via a centralized funding system) and lesser inequality in student outcomes (including students' performance in competency tests and in the labor market). Thus, one has to believe that the centralization of school governance and funding can and will lead at the end of the day to more equal student outcomes, better performance in competency tests and a lesser degree of dispersion of test results. Needless to say, even in a fair funding system there can be considerable differences in per-student financial resources of schools or inequalities in teachers’ salaries and earnings if these reflect factors like the educational need of the students, the quality of work in the school, the qualification, experience, workload and effort of its teachers instead of the wealth of the municipality, the size of its population or the bargaining power of the headmaster.
What kind of changes in competency test results might reasonably have been interpreted as positive outcomes of the reform? Had the reform been successful in increasing the quality of education and reducing the achievement gap, a non-increasing or decreasing relative standard deviations should have been observable in test results in the post- reform years. (It is better to rely on relative standard deviations if the aim is to determine whether the centralization had the intended effect on competency test scores, as the mean scores can fluctuate considerably over time.)
Since many basic school students (usually from more ambitious families with better socio-economic background) transfer to 8- or 6-year academic secondary school programs upon completing the 4th or the 6th grade of basic school, and this skimming can distort the test results in grades 1-8 single-program basic schools considerably, especially in the 8th grade competency tests, here only the 6th grade test scores are used.
Small fluctuations in mean test scores between years may be random and no great significance should be attributed to them. However, if there is a steady tendency, or if the mean scores in every post-reform year are higher than in the pre-reform years, this may indicate a positive change in student performance and the quality of education after the reform. (However, not even this is sufficient to prove that the change was causally related to the reform.)
For KLIK-operated basic schools, 6th grade reading literacy test scores (Figure 6) were always better in the 2013-2015 period than in the last pre-reform year, which is a good sign. (For mathematics, the mean test results were less conclusive.) Unfortunately, as far as the relative standard deviations of reading literacy scores are concerned, the picture is
15 These factors include student ability and motivation, teacher ability, the remuneration scheme of teachers, class size, class composition, the education and socio-cultural background of parents, peer group pressure, methods of education, etc.
![Figure 4. Teacher earnings by quintiles of local authorities according to income (for full- full-time teachers in grades 1-8 [occupation code 2431], as a percentage of average earnings](https://thumb-eu.123doks.com/thumbv2/9dokorg/1422601.120480/19.748.199.553.231.463/teacher-earnings-quintiles-authorities-according-teachers-occupation-percentage.webp)