Analysis of Multi-location Data of Hybrid Rice Trials Reveals Complex Genotype by Environment Interaction
R. Ponnuswamy1*, a. RathoRe2, a. Vemula2, R.R. Das2, a.K. singh1,D. BalaKRishnan1, h.s. aRRemsetty1, R.B. VemuRi1 and t. Ram1
1ICAR-Indian Institute of Rice Research, Rajendranagar, Hyderabad, India
2Statistics, Bioinformatics and Data Management, ICRISAT, Patancheru, Hyderabad, India (Received 8 March 2017; Accepted 28 July 2017;
Communicated by V. Korzun)
The All India Coordinated Rice Improvement Project of ICAR-Indian Institute of Rice Research, Hyderabad organizes multi-location testing of elite lines and hybrids to test and identify new rice cultivars for the release of commercial cultivation in India. Data obtained from Initial Hybrid Rice Trials of three years were utilized to understand the genotype × environment interaction (GEI) patterns among the test locations of five different agro-eco- logical regions of India using GGE and AMMI biplot analysis. The combined analysis of variance and AMMI ANOVA for a yield of rice hybrids were highly significant for GEI. The GGE biplots first two PC explained 54.71%, 51.54% and 59.95% of total G + GEI variation during 2010, 2011 and 2012, respectively, whereas AMMI biplot PC1 and PC2 explained 46.62% in 2010, 36.07% in 2011 and 38.33% in 2012 of the total GEI variation. Crossover interactions, i.e. genotype rank changes across locations were observed. GGE biplot identi- fied hybrids, viz. PAN1919, TNRH193, DRH005, VRH639, 26P29, Signet5051, KPH385, VRH667, NIPH101, SPH497, RH664 Plus and TNRH222 as stable rice hybrids. The dis- criminative locations identified in different test years were Coimbatore, Maruteru, VNR, Jammu, Raipur, Ludhiana, Karjat and Dabhoi. The AMMI1 biplot identified the adaptable rice hybrids viz., CNRH102, DRH005, NK6303, NK6320, DRRH78, NIPH101, Signet5050, BPH115, Bio452, NPSH2003, and DRRH83. The present study demonstrated that AMMI and GGE biplots analyses were successful in assessing genotype by environment interaction in hybrid rice trials and aided in the identification of stable and adaptable rice hybrids with higher mean and stable yields.
Keywords: G × E interaction, hybrid rice, AICRIP, multivariate methods, crop improve- ment
Introduction
Rice is one of the most important food crops for half of the world’s population. World- wide, around 3.5 billion people depend upon rice for more than 20% of their calories re- quirement (Khush 2013). India stands first in rice area with 44 million hectares and sec- ond in production with 105 million tonnes after China (IRRI 2016). Rice production
*Corresponding author; E-mail: revathi.ponnusamy@gmail.com
has increased tremendously from 34.5 million tonnes in 1960–61 to 105 million tonnes 2015–16 by developing high yielding semi-dwarf varieties, through crop management and plant protection practices. All India Coordinated Rice Improvement Project (AIC- RIP) was initiated by Indian Council of Agricultural Research (ICAR) during 1965 with its headquarter at Hyderabad, India for coordinating the multidisciplinary, multi-environ- ment testing of the new varieties, plant protection and production technologies of rice crop across diverse ecosystems of the country.
AICRIP is one of the largest research networks in India dedicated to single crop with 47 funded cooperating (Fig. S1*) and 72 voluntary centres. Since the inception of AIC- RIP, around 1120 high yielding rice varieties including 75 hybrids have been released for cultivation till 2015 (Babu 2015). Considering a wide range of environmental conditions such as rainfall pattern, sunshine hours, humidity, temperature etc., rice growing regions were delineated as hilly areas, north western, eastern, western and southern for testing experimental varieties and hybrids.
In the case of hybrid rice network system, the experimental hybrids developed by pub- lic and private sectors were evaluated in Initial Hybrid Rice Trials (IHRT) in different regions. In IHRT trial, entries with a yield superiority of more than 5% and 10% over the best hybrid and varietal checks either on over all mean basis or on regional mean basis are promoted to next stages of testing in Advance Varietal Trial 1 (AVT 1) and AVT 2. Those entries with consistent yield advantage over a period of three years in IVT/IHRT, AVT 1 and 2 trials, with good grain quality and other desirable traits like biotic stress resistance are being released for cultivation in the states where they were consistent in yield. Hence, multi-location testing in IHRT under AICRIP assumes a significant role towards the eval- uation of the potential of newly bred rice hybrids. Data collected during multi-environ- ment testing is often less utilized, mostly genotype main effects are considered for geno- type evaluation, whereas genotype environment interactions (GEI) are ignored as noise or confounding factor. In multi-environment trials, understanding the performance of geno- types along with stability over diverse environments is an important aspect of identifying high yielding varieties (Scapim et al. 2000).
The advent of biplot analysis partially bridged the gap between biometricians versus breeders in terms of quantification of GEI and matching genotypes for particular environ- ments (Yan and Tinker 2006). The use of biplots for agricultural data analysis was done by Bradu and Gabriel (1978) in cotton. The earlier studies by Kempton (1984); Gauch (1992); Cooper and DeLacy (1994) also emphasized the importance of biplot analysis to understand about the stability of genotypes. Samonte et al. (2005) demonstrated the use of AMMI model and GGE biplot analysis in estimating GEI effect on rice grain yield and identifying best-performing cultivars. By using biplots GEI can be visualized in a single graph, at the same time comparison of genotypes and their interaction with the different environments can also be studied (Gauch and Zobel 1996).
Considering the importance of biplot analysis, we utilized hybrid rice multi location yield data sets of three years for analysis by AMMI (Gauch 1988; Gauch and Zobel 1997)
*Further details about the Electronic Supplementary Material (ESM) can be found at the end of the article.
and GGE biplot (Yan and Kang 2003) (i) to understand GEI pattern across rice growing regions of India, (ii) to identify stable and adaptable rice hybrids, and (iii) to determine essential test locations for initial rice hybrid evaluation.
Materials and Methods
This study deployed AICRIP’s IHRT-mid-early multi location yield data sets comprising 27, 38 and 26 rice hybrids in 2010, 2011 and 2012, respectively (DRR progress reports 2011, 2012 and 2013). The information pertaining to test hybrids and locations are pre- sented in Table 1. The multi-location testing was done at 17, 18 and 17 locations repre- senting different Indian states during 2010, 2011 and 2012, respectively. During the test years, the crop was transplanted during Kharif season (June–July) and harvested during October–November. In each location, the experiment was conducted with the standard crop management practices in a randomized complete block design with three replica- tions, 15 × 15 cm spacing of row to plant in 10 sq. m. plot size with recommended ferti- lizer doses of NPK 120: 60:60 kg/ha. The plot yield data collected at different centres were used for analysis.
Data analysis
Year-wise combined analysis of variance across different locations were performed using replicated data to test the significance of genotype (G) and environment (E) and GEI using Restricted Maximum Likelihood (ReML) procedure of GenStat 17 edition for Windows (VSN International, Hemel Hempstead, UK 2015) considering replication and genotype as fixed and locations as random. A model with heterogeneous individual loca- tion residual variance was used for combined analysis of variance by using PROC MIXED with REPEATED statement (Sharma et al. 2012). BLUP’s (Best Linear Unbiased Predic- tors) random modeled for genotypes × environment interactions were estimated from combined analysis of variance. Two stability models, Additive Main effects and Multipli- cative Interaction (AMMI) (Gauch 1988; Gauch and Zobel 1997) and Site Regression model (commonly known as GGE Biplot) (Yan and Kang 2003) were used to visualize the GEI patterns and to understand the interrelationships among various test locations.
The AMMI model used for the data was
Yij g ei j k
k K
ik jk ij
.= + + + + .
∑
=µ λ δ β ε
1
and the site regression model was
. .
1 K
ij j k ik jk ij
k
Y m e l d b e
=
= + +
∑
+where Yij. is the mean yield of ith genotype (i = 1 to n), in jth environment (j = 1 to m), m is the overall mean, gi is the genotypic effect, ej is the environment effect, lk l is the singu-
lar value for PCA axis k. dik is ith genotype eigen vector value for IPCA (Interaction PCA) axis k, bjk is the jth environment eigen vector value for IPCA axis k and eij. jis the residual error assumed to be normally and independently distributed (0, s2e), s2e is variance of the residual; K is the number of PCA axes retained in the model (K < = min (G, E) and K = 2 for a 2-dimensional biplot). The number of K is judged on the basis of empirical consid- eration of F-test of significance (Gauch 1992). In the AMMI model, only the GEI term is
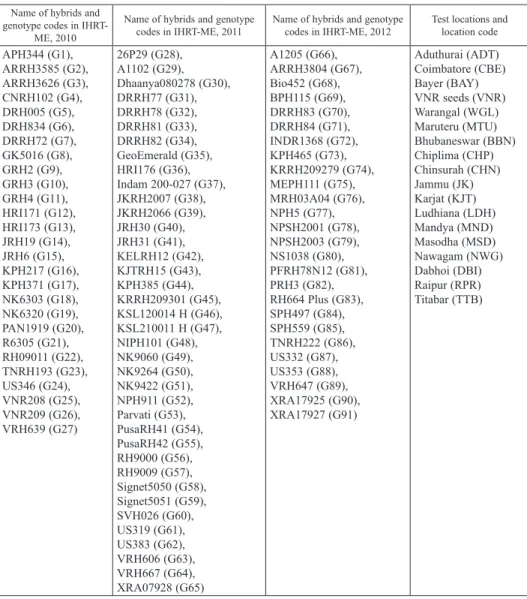
Table 1. List of hybrids in AICRIP initial hybrid rice trial in mid-early duration and testing environments in India
Name of hybrids and genotype codes in IHRT-
ME, 2010
Name of hybrids and genotype
codes in IHRT-ME, 2011 Name of hybrids and genotype
codes in IHRT-ME, 2012 Test locations and location code APH344 (G1),
ARRH3585 (G2), ARRH3626 (G3), CNRH102 (G4), DRH005 (G5), DRH834 (G6), DRRH72 (G7), GK5016 (G8), GRH2 (G9), GRH3 (G10), GRH4 (G11), HRI171 (G12), HRI173 (G13), JRH19 (G14), JRH6 (G15), KPH217 (G16), KPH371 (G17), NK6303 (G18), NK6320 (G19), PAN1919 (G20), R6305 (G21), RH09011 (G22), TNRH193 (G23), US346 (G24), VNR208 (G25), VNR209 (G26), VRH639 (G27)
26P29 (G28), A1102 (G29), Dhaanya080278 (G30), DRRH77 (G31), DRRH78 (G32), DRRH81 (G33), DRRH82 (G34), GeoEmerald (G35), HRI176 (G36), Indam 200-027 (G37), JKRH2007 (G38), JKRH2066 (G39), JRH30 (G40), JRH31 (G41), KELRH12 (G42), KJTRH15 (G43), KPH385 (G44), KRRH209301 (G45), KSL120014 H (G46), KSL210011 H (G47), NIPH101 (G48), NK9060 (G49), NK9264 (G50), NK9422 (G51), NPH911 (G52), Parvati (G53), PusaRH41 (G54), PusaRH42 (G55), RH9000 (G56), RH9009 (G57), Signet5050 (G58), Signet5051 (G59), SVH026 (G60), US319 (G61), US383 (G62), VRH606 (G63), VRH667 (G64), XRA07928 (G65)
A1205 (G66), ARRH3804 (G67), Bio452 (G68), BPH115 (G69), DRRH83 (G70), DRRH84 (G71), INDR1368 (G72), KPH465 (G73), KRRH209279 (G74), MEPH111 (G75), MRH03A04 (G76), NPH5 (G77), NPSH2001 (G78), NPSH2003 (G79), NS1038 (G80), PFRH78N12 (G81), PRH3 (G82), RH664 Plus (G83), SPH497 (G84), SPH559 (G85), TNRH222 (G86), US332 (G87), US353 (G88), VRH647 (G89), XRA17925 (G90), XRA17927 (G91)
Aduthurai (ADT) Coimbatore (CBE) Bayer (BAY) VNR seeds (VNR) Warangal (WGL) Maruteru (MTU) Bhubaneswar (BBN) Chiplima (CHP) Chinsurah (CHN) Jammu (JK) Karjat (KJT) Ludhiana (LDH) Mandya (MND) Masodha (MSD) Nawagam (NWG) Dabhoi (DBI) Raipur (RPR) Titabar (TTB)
G – Genotype.
partitioned in the multiplicative component and is subjected to singular value decomposi- tion, whereas in the SREG model, a matrix of main effects of genotype (G) and the GEI is approximated as K multiplicative components, i.e. eigen vectors for the genotypes and the environments.
The results of the AMMI model analysis were interpreted on the basis of AMMI1 bi- plot where the graph was plotted with the main effect and first multiplicative axis term (IPCA1) for both genotypes and environments. The greater the Interaction Principal Component Axis (IPCA) scores, either negative or positive, indicated the specific adapta- tion of a genotype to certain environments. The more the IPCA scores approximate to zero, the wide adaptable the genotypes to the overall environments under study. Gollob test (Gollob 1968) was used to test significance for PC. The GGE biplot graphically rep- resents G and GEI effect present in the multi-environment trial data using environment centered data. GGE biplots were used to evaluate: 1) which-won-where pattern where by specific genotypes can be recommended to a specific location(s), 2) genotype evaluation, and stable genotype across all locations, and 3) environment/location evaluation, explains discriminative power among genotypes in target environments. Both AMMI and GGE biplots were constructed using GenStat, crossovers interaction percentage was calculated by comparing the performance of all possible pairs of genotypes in two environments and determining if the difference in performance is significantly less than zero in one environ- ment and significantly greater than zero in the other and this process is repeated in all pairs of possible environments (Cornelius et al. 1992).
Results Combined analysis of variance
The combined analysis of variance for grain yield of rice hybrids was highly significant (P < 0.001) for genotype (G), environment (E) and GEI (Table S1). The heritability esti- mates for the locations ranged from 0.71 to 0.99 (Table S2). Since GE interaction re- vealed highly significant effects, to determine whether there are crossovers interactions, i.e. genotype rank changes across environments, crossover interaction percentage and Spearman’s correlations were calculated (Figs S2a, 2b and 2c). The crossover interaction between locations indicated 32.5% of crossover between CBE and MTU in 2010, 47.9%
between JK and MSD in 2011, 30.2% between KJT and NWG in 2012.
GGE biplot and AMMI analysis
Using GGE biplots, first two PC-jointly explained 54.71%, 51.54% and 59.95% of G + GEI variation during 2010, 2011 and 2012, respectively (Figs S3a, 3b and 3c), where- as IPCA1 of AMMI1 biplot explained 24.69%, 22.19% and 20.61% of variation in 2010, 2011 and 2012, respectively (Figs S4a, 4b and 4c). First, two PC of AMMI biplot jointly explained 46.62% in 2010, 36.07% in 2011 and 38.33% in 2012 of the total GEI varia- tions (Table S3).
Genotype evaluation
In GGE biplot (Fig. S3a) for the year 2010, the genotypes GK5016 (G8), HRI171 (G12) showed specific adaption to CBE environment with higher mean yield. Rice hybrids PAN1919 (G20), TNRH193 (G23), DRH005 (G5) and VRH639 (G27) were observed to be ideal genotypes being close to Average Environment Axis (AEA) along with higher mean yield, while KPH371 (G17) was found to be most adaptable to the environment MTU. The AMMI1 biplot (Fig. S4a) showed that the hybrids CNRH102 (G4), DRH005 (G5), NK6303 (G18) and NK6320 (G19) had shown high yields with less environmental interaction effects (closer to PCA score zero) hence considered as most adaptable geno- types. The genotypes DRH834 (G6), GK5016 (G8), HRI171 (G12) and KPH371 (G17) were away from PCA origin with higher yields and showed specific adaption to Coim- batore and Maruteru.
In 2011, GGE biplot (Fig. S3b) showed that hybrids Dhaanya080278 (G30) and Par- vati (G53) performed well in JK, while HRI176 (G36) have performed considerably well for MSD. Rice hybrids 26P29 (G28), Signet5051 (G59), KPH385 (G44), VRH667 (G64) and NIPH101 (G48) being close to AEA were identified as ideal genotypes with stability and high mean yield across environments. By AMMI1 biplot (Fig. S4b), DRRH78 (G32), NIPH101 (G48) and Signet5050 (G58) were close to PCA origin in comparison with other genotypes, therefore, these genotypes can be considered as most adaptable geno- types across the environments. The most unstable genotype was DRRH77 (G31) with low yield.
In 2012, using GGE biplot (Fig. S3c) analysis, rice hybrids, viz. SPH497 (G84) and RH664 Plus (G83) were found to be stable with higher mean yield, whereas genotype TNRH222 (G86) was stable but with low yield. The rice hybrids XRA17927 (G91) and DRRH84 (G71) were farthest from AEA and showed specific adaption to KJT and NWG, respectively. By AMMI1 analysis (Fig. S4c), BPH115 (G69), Bio452 (G68), NPSH2003 (G79) and DRRH83 (G70) were identified as most adaptable genotypes based on their PCA1 score and mean yield. TNRH222 (G86) genotype was identified as most unstable and adaptable to ADT and CHP.
Polygon view of GGE biplots (Yan and Hunt 2002; Yan and Tinker 2006) showed rice hybrids which performed either best or poorest in one or more environments. In 2010 G17 (KPH371) was winner genotype for MTU and RPR, G22 (RH09011) and G23 (TNRH193) were winning genotypes for most of the environments, G4 (CNRH102), G12 (HRI171), G8 (GK5016) for the environment of CBE, DBI, and BAY. In 2011, the rice hybrids G36 (HRI176), G39 (JKRH2066) were winning genotypes for MSD, VNR, KJT, and WGL.
G28 (26P29), G59 (signet5051), G53 (Parvati) and G30 (Dhaanya) were identified as winning genotypes for JK, CBE, CHN, and DBI. G71 (DRRH84), G67 (ARRH3804), G72 (INDR1368), G90 (XRA17925) and G91 (XRA17927) were identified as winning genotypes during 2012.
Environment evaluation based on GGE biplots The relationship among test environments
In Fig. S3a, environments CBE with MTU, MSD with MTU had an obtuse angle (> 90), i.e. genotype ranks are changing between these environments indicating crossover inter- action. BAY and MTU had right angle triangle (= 90°), i.e. zero correlation between two environments and rest of environments had an acute angle (< 90°), i.e. positively corre- lated with each other. In Fig. S3b, the environments, viz. MTU, JK had an obtuse angle with MSD explaining crossover interaction while rest of the locations showed a positive correlation. The VNR showed a negative correlation with JK and MTU. In Fig. S3c, the obtuse angle was observed between NWG and ADT, KJT indicating rank changes of genotypes over these locations.
In GGE biplot, the concentric circle helps to identify the length of the environment vector and is a measure of the discriminating ability of environments. Environments with longer vector length have the high discriminating ability; discriminating environments would be preferred as test environment over non-discriminative environments. The data from 2010 revealed CBE, MTU and VNR were observed to be highly discriminating en- vironments, whereas MSD, ADT, CHP, BBN, JK, and NWG were less discriminating environments (Fig. S3a). In 2011, JK, RPR, and LDH were identified as highly discrimi- native environments, while MTU, CHN, CHP were identified as least discriminative en- vironments (Fig. S3b). In Fig. S3c, KJT, RPR, and DBI were identified as highly dis- criminative environments, CHP, MND, and BBN were least discriminative environments.
The results suggested that common least discriminative environments for three years like CHP and MSD (Masodha) need not be considered for assessing the performance of rice hybrids.
Representativeness of the test environments was presented with a projection of the environments to the Average Environment Axis (AEA). In GGE biplots the “average en- vironment” is represented by a small circle on the AEA. Environments with a smaller angle with AEA are most representative of the average test environments and the longest vector from the biplot origin environments are most informative KJT and VNR were closer to AEA and with considerable longer environment vectors in 2010. The most rep- resentative environments in 2011 were RPR and NGW. Though KJT was also very close to AEA, its overall mean yield seems to be lower than RPR and NGW. During 2012, the test environments, viz. Bayer, VNR, and CBE were identified as highly representative in terms of high mean yield and stability hence can be considered as ideal test environments for selecting generally adapted genotypes. In Fig. S3a, five sectors showed a grouping of different locations and these locations can be called as five mega environments. In the same way, Figs S3b and S3c identified four and three mega environments, respectively.
The clustering pattern of environments in above biplots suggests that existence of com- plex mega environments, i.e. unpredictable crossover GEI across the test years.
Discussion
The AICRIP initiated in 1965 is the first and the largest national multi-environment test- ing program for the release of rice varieties in India (Muralidharan et al. 2002). The suc- cess of AICRIP over the past 50 years of intensive multi-location testing reflected in the release of 1120 varieties and 75 hybrids (Babu 2015). In spite of several varieties/hybrids have been released, only a few high yielding mega-varieties with wider adaptability and desirable eating and cooking quality covering more than 60% of rice cultivated area, the other varieties which could not spread to large areas due to lack of stability (Babu 2015).
In general, the data collected from the AICRIP trials are utilized for determining geno- type main effects for identifying superior genotypes. The GEI are ignored as noise or confounding factor. The GGE biplot analysis has evolved into a comprehensive analysis system whereby most questions of genotype by environment interaction can be graphi- cally addressed (Yan et al. 2000; Yan 2001; Yan and Kang 2003; Yan and Tinker 2005).
The AMMI model has been reported to be an efficient method because it captures a large portion of the GE sum of squares and uniquely separates main and interaction effects as required for most agricultural research purposes (Gauch 2006). GGE and AMMI are two slightly different methodologies used to explain and understand about GEI. As both meth- odologies depict different information, both AMMI and GGE biplot analysis was con- ducted to understand about GEI in multi-environment hybrid rice trials to have a stronger confidence in interpreting the results.
In the present study, highly significant GEI was observed by both AMMI and GGE biplot analysis indicating rice hybrid’s performance changes in different environments depending on the conditions of the test locations. The hybrids identified as ideal/adapta- ble genotypes using biplot, viz. NK6303 (G18), TNRH193 (G23), CNRH102 (G4), NK6320 (G19) and DRH005 (G5) in 2010, HRI176 (G36), KPH385 (G44), 26P29 (G28) and VRH667 (G64) in 2011 and genotypes Bio452 (G68), RH664 Plus (G83), BPH115 (G69) and XRA17927 (G91) in 2012 were promoted to AVT-1 IME based on its superior yield and more than 5% and 10% yield advantage over check hybrids and varieties, re- spectively (DRR Progress reports, 2011, 2012, 2013). The above superior entries identi- fied by GGE biplot not only had higher mean yield but also high yielding at the majority of test environments which was expressed by the range (Table S4). Some of the hybrids had higher overall mean but could not be promoted due to lack of desirable quality and yield variation across test environments. Similar GEI studies were also reported by Reddy et al. (2011) in sweet sorghum, Mohamed (2013) in wheat, Agyeman et al. (2015) in cas- sava, Luo et al. (2015) in sugarcane. During 2010, the identified winner genotypes, viz.
KPH371 and NK6303 were further tested based on their yield advantage over check va- rieties and hybrids in AVT-1 IME (DRR Progress report 2011) and AVT-2 IME (DRR Progress report 2012) and successfully released for cultivation in India. The following rice hybrids viz., G36 (HRI-176), G39 (JKRH2066), G44 (KPH385) and G28 (26P29) were evaluated in AVT-1 IME based on yield superiority and got promoted to AVT-2 IME (DRR Progress report 2012) for further testing.
Crossover interaction of genotypes over test environments was observed in all the three years of testing and it was also visualized in GGE biplots. The crossover interaction can be found in the literature for a number of crops and range of environments (Loffler et al. 1986) in maize, Jackson et al. (1993) in barley, Blum and Pnuel (1990), Virk and Man- gat (1991) in pearl millet. Samonte et al. (2005) and Ogunbayo et al. (2014) demonstrated the utility of AMMI and GGE biplots for estimating GE interaction effect and determin- ing the best performing cultivar for target environments in rice crop.
The three years results indicated that the grouping of mega-environment of the testing locations cannot be directly translated into agroecological regions. The inclusion of more test environments may be useful to find out meaningful mega-environments. The current 17 to 18 locations are not sufficient for mega-environment identification. As these loca- tions have come to be very contrasting in terms of genotype evaluation as depicted by biplots and also has nonrepeatable crossover GEI. There is less evidence of any particular grouping or formation of the mega-environment. If more test locations are included, the method would have been more powerful to detect a pattern of mega environments. Use of weather covariates (Van Eeuwijk et al. 1996; Das et al. 2012) can also be helpful to un- derstand this nature of the complex mega environment. The complex GEI may be due to differences in the crop management practices adapted to each testing location. Thus the present study demonstrated that AMMI and GGE biplots analyses were successful in as- sessing genotype by environment interaction in hybrid rice trials and aided in the identi- fication of stable and adaptable rice hybrids with higher mean and stable yields. The present study also emphasizes that rice hybrids promotion for the release for commercial cultivation must consider yield stability across test locations based on genotype by envi- ronment interaction effects along with superior mean yield over checks for identifying superior potential rice hybrids.
Acknowledgements
Authors are highly thankful to the Director, IIRR for his kind support to bring out this publication.
References
Agyeman, A., Parkees, E., Peprah, B.B. 2015. AMMI and GGE biplot analysis of root yield performance of cassava genotype in the forest and coastal ecology. Int. J. of Agric. Policy Res. 3:222–232.
Babu, V.R. 2015. Rice research in India – current status and future prospects. Short course on widening the genetic base in rice through pre-breeding efforts for developing next generation varieties and hybrids.
Directorate of Rice Research. Rajendranagar, Hyderabad, India, January 19–28, 2015. pp. 1–15.
Blum, A., Pnuel, Y. 1990. Physiological attributes associated with drought resistance of wheat cultivars in a Mediterranean environment. Aust. J. of Agric. Res. 41:799–810.
Bradu, D., Gabriel, K.R. 1978. The biplot as a diagnostic tool for models of two-way tables. Technometrics 20:47–68.
Cooper, M., De Lacy, I.H. 1994. Relationships among analytic methods used to study genotypic variation and genotype-by-environment interaction in plant breeding multi-environment experiments. Theor. Appl.
Genet. 88:561–572.
Cornelius, P.L., Seyedsadr, M., Crossa, J. 1992. Using the shifted multiplicative model to search for ‘separabil- ity’ in crop cultivar trials. Theor. Appl. Genet. 84:161–172.
Das, R.R., Anil Kumar, V., Rakshit, S., Maraboina, R., Panwar, S., Savadia, S., Rathore, A. 2012. Interpreting genotype by environment interaction using weather covariates. J. of Statistics and Applications 10:45–62.
DRR Progress Report 2011 Varietal Improvement All India Coordinated Rice Improvement Project (ICAR).
Directorate of Rice Research. Rajendranagar, Hyderabad – 500030, A.P., India. Vol. 1.
DRR Progress Report 2012. Varietal Improvement All India Coordinated Rice Improvement Project (ICAR).
Directorate of Rice Research. Rajendranagar, Hyderabad – 500030, A.P., India. Vol. 1.
DRR Progress Report 2013. Varietal Improvement All India Coordinated Rice Improvement Project (ICAR).
Directorate of Rice Research. Rajendranagar, Hyderabad – 500030, A.P., India. Vol. 1.
Gauch, H.G. 1988. Model selection and validation for yield trials with interaction. Biometrics 44:705–715.
Gauch, H.G. 1992. AMMI analysis of yield trials. In: Kang, M.S., Gauch, H.G. (eds), Genotype-by- environment Interaction. CRC Press. Boca Raton, FL, USA. pp. 1–40.
Gauch, H.G., Zobel, R.W. 1996. AMMI analysis of yield trials. In: Kang, M.S., Gauch, G. (eds), Genotype-by- environment Interaction. CRC Press. Boca Raton, FL, USA. pp. 85–122.
Gauch, H.G., Zobel, R.W. 1997. Identifying mega-environments and targeting genotypes. Crop Sci. 37:311–
Gauch, H.G. 2006. Statistical analysis of yield trials by AMMI and GGE. Crop Sci. 46:1488–1500. 326.
Gollob, H.F. 1968. A statistical model which combines features of factor analytic and analysis of variance techniques. Psychometrika 33:73–115.
IRRI 2016. World rice statistics online query facility. International Rice Research Institute (IRRI). http://www.
ricestat.irri.org:8080.
Jackson, P.A., Byth, D.E., Johnston, R.P., Fischer, K.S. 1993. Genotype × environment interactions in progeny from a barley cross. 1. Patterns of response among progeny genotypes for grain yield and time to anthesis.
Aust. J. of Exp. Agric. 33:619–627.
Kempton, R.A. 1984. The use of biplots in interpreting variety by environment interactions. J. of Agric. Sci.
103:123–135.
Khush, G.S. 2013. Strategies for increasing the yield potential of cereals: case of rice as an example. Plant Breed. 132:433–436.
Loffler, C.M., Salaberry, M.T., Maggio, J.C. 1986. Stability and genetic improvement of maize yield in Argentina. Euphytica 35:449–458.
Luo, J., Pan, Y.B., Que, Y., Zhang, H., Grisham, M.P., Xu, L. 2015. Biplot evaluation of test environments and identification of mega-environment for sugarcane cultivars in China. Scientific Reports 5:15505 doi:
10.1038/srep15505.
Mohamed, N.E.M. 2013. Genotype by environment interactions for grain yield in bread wheat (Triticum aesti- vum L.). J. of Plant Breed. and Crop Sci. 5:150–157.
Muralidharan, K., Prasad, G.S.V., Rao, C.S. 2002. Yield performance of rice genotypes in international multi- environment trials during 1976–97. Current Sci. 83:610–619.
Ogunbayo, S.A., Sié, M., Ojo, D.K., Sanni, K.A., Akinwale, M.G., Toulou, B., Shittu, A., Idehen, E.O., Popoola, A.R., Daniel, I.O., Gregorio, G.B. 2014. Genetic variation and heritability of yield and related traits in promising rice genotypes (Oryza sativa L.). J. of Plant Breed. and Crop Sci. 6:153–159.
Reddy, P.S., Rathore, A., Reddy, B.V.S., Panwar, S. 2011. Application GGE biplot and AMMI model to evalu- ate sweet sorghum (Sorghum bicolor) hybrids for genotype × environment interaction and seasonal adapta- tion. Indian J. Agric. Sci. 81:438–444.
Sailaja, B., Meera, S.N., Viraktamath, B.C. 2012. Manual for AICRIP Information Management System Technical Bulletin No. 61. Directorate of Rice Research (ICAR), Rajendranagar, Hyderabad – 500 030, A.P., India. 37 pp. (http://www.aicrip-intranet.in)
Samonte, S.O.P.B., Wilson, L.T., McClung, A.M., Medley, J.C. 2005. Targeting cultivars onto rice growing environments using AMMI and SREG GGE biplot analyses. Crop Sci. 45:2414–2424.
Scapim, C.A., Oliveira, V.R., Braccini, A.L., Cruz, C.D., Andrade, C.A., Vidigal, M.C.G. 2000. Yield stability in maize (Zea mays L.) and correlations among the parameters of the Eberhart and Russel, Lin and Binns and Huehn models. Genet. and Mol. Biol. 23:387–393.
Sharma, M., Kiran Babu, T., Gaur, P.M., Ghosh, R., Rameshwar, T., Chaudhary, R.G., Upadhyay, J.P., Gupta, O., Saxena, D.R., Kaur, L., Dubey, S.C., Anandani, V.P., Harer, P.N., Rathore, A., Pande, S. 2012.
Identification and multi-environment validation of resistance to Fusarium oxysporum f. sp. ciceris in chick- pea. Field Crops Res. 135:82–88.
Van Eeuwijk, F.A., Denis, J.B., Kang, M.S. 1966. Incorporating additional information on genotypes and envi- ronments in models for two-way genotype by environment tables. In: Kang, M.S., Gauch, H.G. (eds), Genotype-by-Environment Interaction. CRC Press. Boca Raton, FL, USA. pp. 15–49.
Virk, D.S., Mangat, B.K. 1991. Detection of crossover genotype by environment interactions in pearl millet.
Euphytica 52:193–199.
VSN International 2015. GenStat for Windows 17th Edition. VSN International. Hemel Hempstead, UK. Web page: GenStat.co.uk
Yan, W., Hunt, L.A., Sheng, Q., Szlavnics, Z. 2000. Cultivar evaluation and mega-environment investigation based on the GGE biplot. Crop Sci. 40:597–605.
Yan, W. 2001. GGE biplot a Windows application for graphical analysis of multi-environment trial data and other types of two-way data. Agron. J. 93:1111–1118.
Yan, W., Hunt, L.A. 2002. Biplot analysis of diallel data. Crop Sci. 42:21–30.
Yan, W., Kang, M.S. 2003. GGE biplot analysis: a graphical tool for breeders, geneticists, and agronomists.
CRC Press. Boca Raton, FL, USA.
Yan, W., Tinker, N.A. 2005. An integrated system of biplot analysis for displaying, interpreting, and exploring genotype by environment interactions. Crop Sci. 45:1004–1016.
Yan, W., Tinker, N.A. 2006. Biplot analysis of multi-environment trial data: principles and applications. Can.
J. of Plant Sci. 86:623–645.
Electronic Supplementary Material (ESM)
Electronic Supplementary Material (ESM) associated with this article can be found at the website of CRC at http://www.akademiai.com/content/120427/
Electronic Supplementary Table S1. Combined analysis of variance for plot grain yield of rice genotypes tested across India
Electronic Supplementary Table S2. Heritability estimates for test locations Electronic Supplementary Table S3. AMMI ANOVA of rice hybrids tested across India Electronic Supplementary Table S4. The mean yield and range of the promising hybrids in IHRT-ME trial Electronic Supplementary Figure S1. AICRIP Co-operating centres under different rice eco-system (www.
aicrip-intranet.in)
Electronic Supplementary Figure S2a. Spearman’s rank correlation and cross over interactions in 2010 Electronic Supplementary Figure S2b. Spearman’s rank correlation and cross over interactions in 2011 Electronic Supplementary Figure S2c. Spearman’s rank correlation and cross over interactions in 2012 Electronic Supplementary Figure S3a. GGE biplot of 27 rice hybrids tested in 17 locations during 2010 Electronic Supplementary Figure S3b. GGE biplot of 38 rice hybrids tested in 18 locations during 2011 Electronic Supplementary Figure S3c. GGE biplot of 26 rice hybrids tested in 17 locations during 2012
Electronic Supplementary Figure S4a. AMMI biplot for grain yield of rice hybrids in 17 locations in 2010 Electronic Supplementary Figure S4b. AMMI biplot for grain yield of rice hybrids in 18 locations in 2011 Electronic Supplementary Figure S4c. AMMI biplot for grain yield of rice hybrids in 17 locations in 2012