This preprint manuscript does not represent fully the quality of the final publication, which can be accessed at
https://doi.org/10.1007/s10712-019-09573-5
Please cite this work as
Arnone, E., Bór, J., Chanrion, O. et al. Surv Geophys (2019). https://doi.org/10.1007/s10712-019- 09573-5
Climatology of transient luminous events and lightning observed above Europe and the Mediterranean Sea
Enrico Arnone
1,2, József Bór
3, Olivier Chanrion
4, Veronika Barta
3, Stefano Dietrich
2, Carl-Fredrik Enell
5, Thomas Farges
6, Martin Füllekrug
7, Antti Kero
8, Roberto Labanti
9, Antti Mäkelä
10, Keren Mezuman
11,12, Anna Odzimek
13, Martin Popek
14, Marco Prevedelli
15, Marco Ridolfi
15,16, Serge Soula
17, Oscar van der Velde
18, Yoav Yair
19, Przemyslaw Zoladek
20, and Torsten Neubert
41Dipartimento di Fisica, Università di Torino, Italy
2Istituto di Scienza dell’Atmosfera e del Clima – CNR, Bologna, Italy
3Research Centre for Astronomy and Earth Sciences, GGI, Hungarian Academy of Sciences, Sopron, Hungary
4Technical University of Denmark, DTU Space, Kongens Lyngby, Denmark
5EISCAT Scientific Association, Kiruna, Sweden
6CEA, DAM, DIF, F-91297 Arpajon, France
7Department of Electronic and Electrical Engineering, University of Bath, U.K.
8Sodankylä Geophysical Observatory, University of Oulu, Sodankylä, Finland
9Italian Meteor and TLE Network (IMTN), Bologna, Italy
10Finnish Meteorological Institute, Helsinki, Finland
11Earth and Environmental Sciences, Columbia University, New York, NY, USA
12NASA Goddard Institute for Space Studies, New York, NY, USA
13Institute of Geophysics, Polish Academy of Sciences, Warsaw, Poland
14Department of Space Physics, station Nýdek, Institute of Atmospheric Physics, CAS, Prague, Czech Republic
15Department of Physics and Astronomy, University of Bologna, Italy
16Istituto Nazionale di Ottica - CNR, Firenze, Italy
17University of Toulouse/CNRS, Laboratory of Aerology, Toulouse, France
18Universitat Politecnica de Catalunya, Spain
19School of Sustainability, Interdisciplinary Center (IDC) Herzliya, Israel
20Comets and Meteors Workshop, Warszawa, Bartycka, Poland
Correspondence to:E. Arnone (Email: enrico.arnone@unito.it, Tel: +39 0116707261)
Abstract.In 1999, the first sprites were observed above European thunderstorms using sensitive cameras. Since then, Eurosprite campaigns have been conducted to observe sprites and other tran- sient luminous events (TLEs), expanding into a network covering large parts of Europe and coastal areas. In 2009 through 2013, the number of optical observations of TLEs reached a peak of 2000 per year. Because of this unprecedented number of European observations, it was possible to construct 5
a climatology of 8394 TLEs observed above 1018 thunderstorm systems, and study for the first time their distribution and seasonal cycle above Europe and parts of the Mediterranean Sea. The number of TLEs per thunderstorm was found to follow a power law, with less than 10 TLEs for 801 thun- derstorms and up to 195 TLEs above the most prolific one. The majority of TLEs were classified as sprites, 641 elves, 280 halos, 70 upward lightning, 2 blue jets and 1 gigantic jet. The climatology 10
shows intense TLE activity during summer over continental areas, and in late autumn over coastal revised manuscript with changes highlighted Click here to access/download;attachment to
manuscript;Arnone2019_SG_revised_manuscript_RM_changes_
Click here to view linked References
areas and sea. The two seasons peak respectively in August and November, separated by March and April with almost no TLEs, and a relative minimum around September. The observed TLE activity, i.e. mostly sprites, is shown to be largely consistent with lightning activity, with a 1/1000 of observed TLE to lightning ratio in regions with most observations. The overall behavior is consistent among 15
individual years, making the observed seasonal cycle a robust general feature of TLE activity above Europe.
Article Highlights
• Detailed climatological study of TLEs and lightning above Europe produced for the first time
• Seasonal cycle of TLEs and lightning with two active seasons in summer over land and autumn 20
over sea and coastal areas
• Power law distribution of number of TLEs per thunderstorm
KeywordsThunderstorms, lightning, transient luminous events, ground-based observations, Eu- rope, climatology.
1 Introduction 25
1.1 Transient luminous events
Three decades ago, a test low-light camera recorded a sprite (Franz et al., 1990), a spectacular dis- charge extending for tens of km above a thunderstorm. It was the first discovery of a whole family of upper atmosphere electrical processes, collectively known as transient luminous events (TLEs – see reviews by Rodger, 1999; Neubert, 2003; Füllekrug et al., 2006; Neubert et al., 2008; Pasko et al., 30
2011). TLEs occur in the region between the upper troposphere and the mesopause, between the top of thunderclouds and the lower ionosphere. They are the visible manifestation of the electrical impact of thunderstorms onto the above atmosphere. They can be made of streamers, weakly ionized plasma channels (Petrov and Petrova, 1999; Ebert et al., 2006; Luque and Ebert, 2009), roughly up to 70 km altitude; or be large diffused patches of enhanced ionization at higher altitude, where the dielectric 35
relaxation timescale becomes comparable with that of dissociative attachment (Pasko et al., 1998).
Over the years, TLEs have been distinguished in specific classes: Blue jets (Wescott et al., 1995;
Boeck et al., 1995; Petrov and Petrova, 1999) are fountain-like streamers directly expanding from their leader core, and injected from the thundercloud top up to 40 km altitude towards the ionosphere (Krehbiel et al., 2008; Pasko, 2008). Sprites (Sentman and Wescott, 1993; Lyons, 1994; Sentman 40
et al., 1995) are luminous discharges that initiate at about 70 km altitude (Stenbaek-Nielsen et al., 2010) as a consequence of the transient quasi-electrostatic field induced by large positive cloud-to- ground (+CG) lightning strokes (Pasko et al., 1997). They extend downwards to 40 km as streamers and upwards to 90 km altitude as diffuse emission, and are tens of km wide (Stenbaek-Nielsen et al.,
2000). Sprite halos occur as downward moving diffuse glow at 70–80 km altitude, often accompa- 45
nying sprite events but in some occasions alone (Barrington Leigh et al., 2001; Wescott et al., 2001).
Elves appear as horizontally expanding diffuse emission rings of a few hundreds km diameter at about 90 km altitude, when the electromagnetic pulse of a triggering lightning stroke hits the lower ionosphere (Boeck et al., 1992; Fukunishi et al., 1996; Inan et al., 1997). Much rarer are gigantic jets (GJs), which join together apparent features of blue jets and sprites, and cause a direct connection of 50
the thunderstorm to the lower ionosphere (Pasko et al., 2002; Su et al., 2003; Cummer et al., 2009;
van der Velde et al., 2010a). Depending on the relaxation timescales at the altitude of occurrence, TLEs last from several hundreds of milliseconds (jets) down to a few milliseconds (elves). Sprites are the most commonly observed kind of TLE from ground based video observations, with global occurrence rate of about 1–3 spritemin 1(Ignaccolo et al., 2008, and references therein). Satellite 55
observations (Chen et al., 2008) confirmed a global occurrence rate of sprites of about 1 per minute, a similar rate for halos, whereas the much higher efficiency in observing elves led to an estimate of about 30 elvemin 1globally. A high elve/sprite ratio (6:1) was found also by adopting data from ground based photometers, further pointing to a selection bias towards sprites in ground based video observations (Newsome and Inan, 2010).
60
1.2 Eurosprite: a review of European TLE observations
Europe is a unique region for studies of TLEs under extremely varying conditions. The first images of European TLEs were captured by chance in 1999 over the Balkans from an aircraft based cam- era during the 999 Leonids-MAC airborne campaign (Gardner and Taylor, Second Leonids-MAC workshop, Tel Aviv, 2000). The first dedicated observations were obtained in 2000 with a camera 65
installed at the Observatoire Midi-Pyrénées, located at Pic du Midi in the French Pyrenees (Neubert et al., 2001). The authors recorded 40 sprites over the Alps and Southern France, in connection with cold fronts coming from the Atlantic. In the following years, Eurosprite campaigns were conducted during summer leading to over 700 TLE images being captured in the period from 2000 to 2008 (Neubert et al., 2005; Chanrion et al., 2007; Arnone et al., 2008; Neubert et al., 2008). The network 70
involves also several non-optical correlative measurements widely adopted for further insight into the physics of the observed TLEs: a broad range of correlative measurements including ELF-VLF radio and infrasound recording (Price et al., 2002; Greenberg and Price, 2004; Liszka and Hobara, 2006; Neubert et al., 2008; Farges and Blanc, 2010; Sátori et al., 2013). These campaigns allowed a great number of detailed studies using specific European TLE events and thunderstorms. This 75
includes investigations of radio signatures of TLEs and thunderstorm-induced effects onto the atmo- sphere (Haldoupis et al., 2004; Mika et al., 2005; Haldoupis et al., 2006; Mika et al., 2006; Farges et al., 2007; Greenberg et al., 2009; Haldoupis et al., 2010; NaitAmor et al., 2010; Füllekrug et al., 2010, 2011); investigations on infrasound signatures of sprites (Farges et al., 2005; Ignaccolo et al., 2008; Farges and Blanc, 2010); metereology of TLEs and of their producing thunderstorm (Ignac- 80
colo et al., 2006; van der Velde et al., 2006; Ganot et al., 2007; Bór et al., 2009; Iwa´nski et al., 2009;
Savtchenko et al., 2009; Vadislavsky et al., 2009; Yair et al., 2009; Soula et al., 2010; Mäkelä et al., 2010; van der Velde et al., 2010b; Bór et al., 2018); the morphological aspects of various sprite-types (Bór, 2013). A general collection of research related to Eurosprite was included in Füllekrug et al.
(2006) and presented by Neubert et al. (2008).
85
Eurosprite has since then expanded to become a network that joins the observational activities of tens of observers across Europe and the Mediterranean sea, exceeding 1000 observations per year.
In particular, a coordination effort over 2009 through 2013 led to the production of a first database of observations with a broad coverage of regions over Europe and the Mediterranean sea. The increased number of observations was accompanied by the first detection of extremely rare phenomena such as 90
the first GJ observed over Europe (van der Velde et al., 2010a; Kułak and Młynarczyk, 2011; Neubert et al., 2011), detailed analysis of individual sprite-producing thunderstorms (Soula et al., 2014, 2015, 2017), of sprite parent lightning (van der Velde et al., 2014), and elve statistics of a specific region (van der Velde and Montanyà, 2016), high speed recording of sprites (Montanyà et al., 2010), sprites signatures in radio waves (Farges and Blanc, 2011; Füllekrug et al., 2013b; Mlynarczyk et al., 2015), 95
long-lasting TLE signatures in the ionosphere induced by rare very strong lightning (Haldoupis et al., 2012, 2013). More recent studies included also detailed impact of sprite-producing thunderstorms on the atmosphere above with consequent relativistic acceleration of electrons (Füllekrug et al., 2013a) in association with model studies (Chanrion and Neubert, 2010), impact of sprite-producing thunderstorms on the lower ionosphere (especially on the sporadic E layer) over Central European 100
region (Barta et al., 2017) using ionosonde data, or may lead to joint studies also with detection of terrestrial gamma-ray flashes over the Mediterranean Sea (Gjesteland et al., 2015).
1.3 A climatological perspective
Such a large number of observations allows for the first time detailed climatological studies to be performed over Europe and the Mediterranean sea, therefore studying the geographical distribution 105
and variability of mean TLE occurrence over a time span of several years rather than looking at individual events. A Southern Mediterranean example was presented by Yair et al. (2015) and an introduction to the climatology presented here was published by Arnone and Dinelli (2016). Despite being inhomogeneously distributed, the number of ground-based observed sprites largely exceeds that acquired globally from satellites over equivalent periods of time (Chen et al., 2008). They give 110
therefore an essential contribution to climatological studies, which remain fundamental for under- standing the global role of TLEs in the atmosphere (see e.g., reviews by Pasko, 2010; Pasko et al., 2011): e.g. answering questions on the spatial and temporal distribution of their occurrence and of their impact; opening the way to comparison with other climatological atmospheric and climate data for which one-to-one analysis is not meaningful; allowing calibration of climatologies based on 115
non-optical measurements, such as through Schumann resonances and detection at extremely low frequency (ELF, Füllekrug and Reising, 1998; Whitley et al., 2011). The climatology of TLEs with
associated details for individual TLE types and relationship to lightning opens the way to further interpretation in future studies dealing e.g. the meteorology and the global electric circuit.
A branch of European TLE-related activities that has developed over the past years and will greatly 120
benefit from these large observational samples is that studying the impact of TLEs on the atmosphere.
This include model and laboratory studies of the discharges themselves (e.g., Luque and Ebert, 2009;
Ebert et al., 2010); modeling of their emissions and impact onto the atmosphere and its chemistry at local or global level (Enell et al., 2008; Gordillo-Vázquez, 2008; Arnone et al., 2008; Gordillo- Vázquez et al., 2011; Parra-Rojas et al., 2013; Neubert and Chanrion, 2013; Arnone et al., 2014;
125
Winkler and Notholt, 2014, 2015; Parra-Rojas et al., 2015; Pérez-Invernón et al., 2018a, 2019); ob- servational studies linking chemistry to TLE occurrence (Arnone et al., 2008, 2009; Arnone and Hauchecorne, 2012; Arnone and Dinelli, 2016): a number of TLE parametrized distributions have been adopted by several of these modeling and observational studies based on regional to global lightning observations. Furthermore, investigations on the role of sprites in the global electric circuit 130
were also brought forward (Füllekrug et al., 2006; Rycroft et al., 2007; Rycroft and Odzimek, 2010;
Rycroft and Harrison, 2011). More recently, a capability of investigating TLEs with high resolution spectroscopy was also developed (Gordillo-Vázquez et al., 2018) in association with optical obser- vations of sprites, and methods for the spectroscopic diagnostic of elves and halos were developed for space-based instruments (Pérez-Invernón et al., 2018b).
135
The growth of this field of research in Europe has brought to the development of the Atmosphere- Space Interaction Monitor (ASIM) that was launched on the 2nd of April, 2018, and installed on an external platform of the Columbus Module of the International Space Station. The main objectives of the mission are related to thunderstorm activity by observing associated emissions in the near UV, near-infrared, X-ray and gamma-ray bands. ASIM consists of two main instrument modules, the 140
Modular Multi-spectral Imaging Array (MMIA) with two cameras and three photometers observing in the 180-230 nm, 337 nm and 777.4 nm bands and the Modular X-ray and gamma-ray Sensor (MXGS) observing photons of energy in the range 15 keV to 20 MeV with imaging capability (Neu- bert, 2009). A further European mission dedicated to the study of thunderstorms is the TARANIS satellite (Tool for the Analysis of RAdiations from lightNIngs and Sprites) which is planned to be 145
launched in 2020 carrying a set of instruments recording thunderstorm emission in the optical, X- ray, gamma-ray and radio bands (Blanc et al., 2007; Lefeuvre et al., 2008). Both space missions will exploit the coordinated ground-based observation systems and the knowledge on TLE distribution and variability discussed in this study.
In this paper, we present the distribution and seasonal cycle of TLE observations from the Eu- 150
rosprite network and partners during 2009 through 2013, the period with the widest coverage of European observations to date. The paper aims both at giving an overview of the observational capa- bilities of the network and exploiting its results to obtain for the first time a climatology of TLEs over Europe. The structure of the paper reflects these aims: the coordinated Eurosprite instrumentation
and observations are presented in Sect. 2. The data analysis is described in Sect. 3. The climatology 155
is presented in Sect. 4 and discussed in Sect. 5. Conclusions are given in Sect. 6.
2 Eurosprite instrumentation
Several partners contribute to the so called Eurosprite network which provided the observations studied in this work. Eurosprite is an umbrella identifying a coordinated observational effort ex- ploiting several optical cameras permanently installed at strategic locations or temporary deployed 160
during field campaigns throughout Europe and coastal areas. The main optical systems involved in the network are shown in Fig. 1 with their estimated coverage (see Sec. 3.1). A number of further optical systems contribute with sporadic observations through their regional networks (see below).
As shown, most of Central and Southern Europe is well covered by observations, whereas there is as yet limited coverage of Eastern and Northern Europe. The Mediterranean sea and coastal areas 165
are covered in the Northern parts by systems in Spain, France and Italy, and in the Southern parts by Israel. An overview of the optical systems involved in this study (i.e. active in 2009 to 2013) and their current status is given here below. An overall description of Eurosprite activities and early campaigns can be found in Neubert et al. (2008).
2.1 Optical systems 170
2.1.1 Southern Europe and the Mediterranean Sea
The first operating European sprite-watch system was installed in Southern France at Pic du Midi (42.94 N, 0.14 E, 2877 m) in the French Pyrenees to conduct campaign operations in 2000 and 2003 (Neubert et al., 2001; Neubert et al., 2005). It consisted of remotely controlled optical cameras sensitive to low-light conditions and a photometer. This camera system was associated to other sim- 175
ilar systems for summer and fall campaigns, especially in 2005 and 2006 with a camera at Puy de Dome (45.77 N, 2.962 E, 1465 m) and in 2008 on Mount Corona (42.46 N, 8.92 E, 2144 m) in Corsica, and at the Calar-Alto Observatory (37.22 N, 2.58 E) (Neubert et al., 2005; Chanrion et al., 2007; Arnone et al., 2008; Neubert et al., 2008; Soula et al., 2010). See Fig. 1. A new low-light and high-resolution charge-coupled device (CCD) camera (Watec 902H) mounted on a pan-tilt unit 180
remotely controlled through the Internet, was installed in 2009 at Pic du Midi and continuously op- erated. It is equipped with a 12 mm f/0.8 lens with a 31 field of view (FOV). The typical maximum range of such a high mountain system is 800 km, so that this system commonly observes TLEs over the southeastern France, the Alps, the western Mediterranean Sea and a large part of Spain (Soula et al., 2010, 2014, 2015, 2017; van der Velde et al., 2010a, 2014). Other similar cameras are lo- 185
cated in southern France at lower altitude, in Lannemezan (43.13 N, 0.37 E, 592 m) since 2007, in Clermont-Ferrand (45.76 N, 3.11 E; 400 m) since 2010, in Rustrel (43.94 N, 5.48 E, 1020 m) since 2011. These four cameras can be operated throughout the year. In particular, during the period
considered for this study, the Pic du Midi system was active in 2010 (mid-July to end of August), 2011 (mid-May to end of November) and 2013 (mid-August to end of September); the Corsica sys- 190
tem in 2009 (August to mid-November), 2010 (mid-July to mid-October) and 2011 (second half of July); the Calar Alto system in 2009 (mid-April to mid-November) and 2011 (end of September to mid-December). In September 2018, a high speed remote camera system was mounted at the top of the Laboratoire Souterrain à Bas Bruit (LSBB) in Rustrel (43.93 N, 5.49 E) and another system at the Observatoire Midi-Pyrénées is planned for installation in 2019.
195
Observations taken from Spain were based on a remotely controlled camera installed at Sant Vicenç de Castellet (41.67 N, 1.85 E) and additional deployable cameras including a high-speed system (see Fig. 1). The remotely controlled system has an observation range of about 150 to 450 km centered at the camera location, with minimum distance rarely below 100 km (about 35 high in the sky) and reaching a maximum distance of about 600 km. The viewing had partial limitation towards 200
Southern France because of hills blocking the lowest 12 . The system was moved to Castellgalí (41.67 N, 1.83 E) in November 2013 where it continues operations. The cameras were operated continuously throughout the year, with observation taken when viewing conditions were clear and manually operated whenever there were storms.
Observations from Italy and Switzerland were recorded by the Italian Meteor and TLE Network 205
(IMTN), which groups over 30 cameras with fixed pointing and a few automated pointing cameras.
IMTN fully covers central and Northern Italy, and adjacent regions, and has some limited sensitivity down to Southern Italy. Most cameras are close to sea level and close to cities, so that the observation range of each camera is limited to a few hundred km. Because of multiple cameras covering the same areas from different location, it is often possible to triangulate. The most active stations (i.e. with 210
more cameras and continuity of observations, resulting in more observations taken) are installed at Ferrara (44.83 N, 11.57 E), Tortoreto (42.66 N, 13.67 E), Contigliano (42.41 N, 12.76 E), Bologna/Medicina (44.50 N, 11.26 E), Lugano/Gnosca (46.12 N, 8.84 E), Cuneo (44.39 N, 7.48 E) and Scandicci (43.74 N,11.08 E) The southernmost camera is placed in Casamassima (41.03 N, 16.82 E) since 2012. In 2010, a research camera with a remotely controlled automated 215
TLE detection system was mounted at the Italian Climate Observatory on Mount Cimone (44.19 N, 10.70 E, 2165 m), Modena, Italy. The system was moved to the Loiano Observatory (44.39 N, 11.19 E) in early 2013 and continues to be operational. The overall coverage from Italy includes adjacent seas, parts of central Europe and the Balkans (see Fig. 1). The cameras are operated through- out the year. The network of overlapping camera viewing demonstrated to be extremely efficient in 220
capturing TLEs, leading for example to the only GJ captured to date over Europe (van der Velde et al., 2010a). Despite shortages in the viewing conditions and continuity of the operation of indi- vidual cameras, these regions can be considered to be largely continuously monitored.
Covering the western Mediterranean Sea and adjacent regions observations were conducted from Israel by ILAN team. The TLE observing system is deployed on the rooftop of the Geophysics 225
department of Tel Aviv University and is comprised of two panchromatic CCD cameras, mounted on a remotely controlled pan-and-tilt unit (Ganot et al., 2007) (see Fig. 1). Observations are conducted during the thunderstorm active period of September-May every year, with a line of sight stretching up to Cyprus and Southern Turkey (Yair et al., 2009). For specific storm events, an alternative site at the Wise astronomical observatory (30.60 N, 34.76 E) in the Negev desert was used, extending 230
the coverage to the Nile delta and beyond.
2.1.2 Central Europe
Organized TLE observations in Central Europe started in 2007. An optical detection site has been set up in Sopron, on the North-Eastren part of Hungary (47.69 N,16.44 E) with a remotely con- trolled monochrome analogue video camera. Due to the vulnerability of the applied pan-tilt unit, the 235
camera used to be dismounted for the winter and reinstalled in the following year (see Fig. 1). Ob- servations were taken in May to August, June to August, and July to October, in 2009, in 2010, and in 2011, respectively. Further details of TLE-related observations in Hungary can be found in Sátori et al. (2013). Recently, another TLE observation site has been set up in southern Hungary at Baja (46.18 N, 19.01 E) with similar instrumentation to that in Sopron on the Noth-Eastern part of the 240
country. The new site covers central Italy, the Adriatic Sea, and the middle and the North-Western part of the Balkans.
Observations from Czech Republic started in May 2011 with a camera installed at at Nydek (49.67 N, 18.77 E) and continued thereafter all years round with only very minor breaks dur- ing the period of this study (5/7 to 21/7 in 2011, 5/11 to 26/11 in 2012 and 1/11 to 14/11 in 2013).
245
See e.g. (Mlynarczyk et al., 2015). Observed TLEs occurred between May and November. The con- tribution from this region reached about 700 TLEs, covering Czech Republic, Slovakia, Germany, Austria, Poland, Hungary, Ukraine and extending to Italy, Slovenia, Croatia and the Adriatic Sea with distances from the observer ranging between 100 and 700 km.
First TLE research observations in Poland have been carried out during a two-week field campaign 250
at Mount Sniezka (50.74 N, 15.74 E), the highest peak of the Sudetest, in July 2007 organized as part of Eurosprite (Odzimek et al., 2008; Iwa´nski et al., 2009). Since summer 2011, research observations have also been made sporadically from Gliwice (50.28 N, 18.65 E) with azimuth 180- 300 and from Swider (52.01 N, 21.39 E) with azimuth 300-50 . These observations have been carried out using low-light sensitive cameras pointed manually, covering parts of Germany, Austria, 255
Hungary, the Czech Republic and Poland (see Fig. 1), as far as Southern Lithuania from Swider.
Large parts of this area overlap with those covered by systems in Hungary and Czech therefore allowing triangulation. It has also to be noted that tens of sprites each year have been observed from Poland since 2009 by the Polish Fireball Network (PFN). PFN operates cameras at fixed direction over the territory of Poland with stations disseminated over central, North-West and South-West of 260
Poland, and two stations in the East, with limited and variable viewing directions for all stations.
PFN stations with the longest detection period or the most of the observed events are Gniewowo
(54.58 N, 18.30 E) which made the first PFN detection in 2009, Twardogora (51.37 N, 17.46 E), Nowe Miasto Lubawskie (53.43 N, 19.59 E), Blonie (52.19 N, 20.62 E), and Chelm (51.16 N, 23.50 E).
265
2.1.3 Northern Europe
Optical observations of TLEs in Northern Europe have to deal with the basic problem that the sky is seldom dark during summer, when most Northern European thunderstorms occur. A station has been operated at Esrange, Kiruna to look for sprites over winter thunderstorms over the Atlantic coast of Norway. In Finland there is an extensive network of amateur astronomers and storm chasers 270
related to the Astronomical Association Ursa running automatic detection software for observing bolides and other bright events in the twilight and night sky. In 2009, the northernmost European sprite and elve were recorded (Mäkelä et al., 2010). In 2009-2013, a total of 25 TLEs were observed (24 sprites, 1 blue jet).
2.2 Lightning detection 275
Lightning detections from national networks were used both as guidance for pointing direction during the observations, and in order to geolocate the TLEs with their parent lightning in post- processing of TLE data. In particular, lightning data came from the VLF/LF lightning detection net- work (LINET, Betz et al., 2009) network in Italy, Spain, Hungary, Poland and Germany. Data from Meteorageand from the European Cooperation for Lightning Detection (EUCLID) were adopted in 280
France and nearby areas. Lightning data from the community lightning detection network BlitzOr- tung were used by automated pointing cameras in Italy and Czech Republic. In Poland lightning detection was acquired also from the Institute of Meteorology and Water Management lightning network (PERUN) and Central Lightning Detection Network (CELDN). In Finland, the lightning location data is from the Nordic Lightning Information Systems (NORDLIS, Mäkelä et al., 2010).
285
Additionally, satellite infrared images and local radar images are used both for pointing and data geolocation.
The analysis of lightning over Europe was performed adopting data from the World Wide Light- ning Location Network (WWLLN). Detection of lightning in WWLLN is based on the consistent recording of VLF band spheric signals from lightning strokes at 5 stations (as a minimum) of the 290
network. WWLLN processes the signals from its receivers centrally and uses the time-of-arrival method to calculate geographical location and the time of occurrence of the source of the detected signals with 10 km and microsecond average accuracy, respectively (Rodger et al., 2006; Rudlosky and Shea, 2013). Since 2009, WWLLN detectors covering continental Europe and the Mediterranean Sea are placed in Portugal, Hungary, Israel and Northern Finland, whereas a new detector was acti- 295
vated in 2012 in the U.K. The switch on of the U.K. detector may lead to an increase in the detection rate since 2012.
We note that the detection efficiency in the WWLLN system is low for individual lightning strokes when compared to local or regional lightning detection networks (Abarca et al., 2010). This limita- tion, however, corresponds to weak discharges. The overall detection efficiency ranges between 15 300
and 30% depending on geographical location, biased towards strong lightning. It is known that the appearance of sprites is predominantly triggered by intense +CG lightning (e.g., Neubert et al., 2008) and that sprite halos and elves are produced by high peak current lightning strokes (Williams et al., 2012; van der Velde and Montanyà, 2016). Unfortunately, WWLLN does not report peak currents nor the type (CG/IC) of the stroke, so its full lightning database, as it is considered in this study, 305
contains many lightning strokes which cannot be associated with TLEs. Nevertheless, the good ho- mogeneity of the dataset in 2009 to 2013 over Europe and the Mediterranean Sea enables it to be used for comparison with TLE observations as an aid in the interpretation of the findings.
3 Observations and data analysis
Over 2009 to 2013, thousands of observations were recorded by the network described in the previ- 310
ous section. Since the range of view of TLEs for these low-light cameras can reach several hundreds of kilometers, TLEs were recorded over large parts of Europe and the Mediterranean sea, through the complex coverage discussed in the following section. All observations are made of optical images, consisting of one or two consecutive video frames capturing one or more TLEs, and one or more elements of a sprite or sprite groups, if present. Given the large number of observations, a very vast 315
family of different types of sprites were registered, including carrot, angel and column sprites, with a variety of shapes and at all levels of detail. Because of detection difficulties, a much lower level of detail characterizes the elve and halo images. The details of TLE images were not analyzed in this work favoring the overall climatological aspects of the distribution through the construction of a database (Sect. 3.2) and binning (Sect. 3.3) of the observations.
320
3.1 Observational coverage
Figure 1 shows the location of the most representative optical systems that contributed with observa- tions during 2009-2013 (white crosses) with an estimate of their viewing coverage (colored areas).
A main issue with ground-based optical TLE observations is the unevenness of the distribution of the cameras, and the continuous changes of their viewing due to either atmospheric processes or 325
experimental changes. Although the main observation hot spots are known (i.e. the areas covered by cameras capturing most TLEs), the detection efficiency is affected in a way that is not possi- ble to characterize correctly for the largest part of the available data, for which detailed historical conditions (e.g. viewing conditions, pointing direction, operating period, observational choice of the observer when more thunderstorms are in view) were not recorded. In order to take into consider- 330
ation these shortages and avoid introducing analysis biases between different cameras, we adopted and brought forward two approaches in parallel.
Firstly, an approximate coverage was evaluated adopting the same discretization as for the data analysis (0.5 , see Sec. 3.3) and based on the viewing of the most representative camera systems (as introduced above). These systems were selected as main systems of each contributing research group 335
or regional network and on the basis of the continuity of their operations, area covered (e.g. if cover- ing areas that no other cameras are reaching), and reported number of TLEs. Each of these cameras was characterized by a circular area of coverage around its location, with a radius of 300 km (e.g., in a city) to 800 km (e.g., on a high mountain) depending on the geographical location and character- ization by the observer. As a first approximation, a circular area was assumed for all cameras with 340
no consideration of their actual viewing direction, assigning a score of 1 to each geographical bin within the circular area of a camera. The score was lowered to 0.5 in the closest 100 km range of the camera (where the high zenith angle may prevent observing TLEs) and in the furthest 100 km ring (200 km for high mountain sites) (because of the expected drop in detection efficiency due to great distances). A weight ranging 0 to 1 was then applied to the scores of each camera depending 345
on the continuity of operations: fraction of the 5 years 2009–2013 and fraction of individual year (season). By this characterization, a bin within the viewing range of a camera operated throughout the year would get a score 1 if operated during the whole 5 years, 0.8 if operated during 4 years only.
The weight was tuned also depending on known shortages or high efficiency of the camera system (from +0.2 for the most experienced to -0.2 for novel observers, and assigning a default 1 for the 350
main multi-camera systems at Mt Corona, S.V. Castellet, Ferrara and Teramo). The coverage dis- tribution was then calculated integrating the contributions from all cameras, resulting in maximum scores of 5 (i.e., 5 overlapping cameras) indicating the highest probability of detecting TLEs. The resulting distribution reported in Fig. 1 shows the large areas covered and highlights the areas with higher expected observing capability. This coverage was used to interpret the TLE climatology and 355
to simulate the expected TLE distribution based on the lightning distribution. With this approach, the actual detection efficiency of individual cameras remains to be evaluated a posteriori but can be assumed to be partly compensated and similar among all cameras so that the overall geographical distribution can be correctly interpreted.
Secondly, in order to remove the bias produced by the uneven detection efficiency, we studied 360
seasonal changes of the geographical distribution of TLEs in terms of multi-year seasonal averages normalized by the multi-year yearly average (see Sec. 4.2). We also considered monthly averages integrated over the area where most of TLEs were observed (see white contours in Fig. 3), excluding data from the Eastern Mediterranean Sea in order to obtain a more homogeneous sample.
3.2 The Eurosprite database 365
The Eurosprite data used in this study include all available 2009–2013 optical images from the broad network of instrumentation described in the previous section. Individual TLE images were collected by the observers into data entries for the Eurosprite database. Each entry consists of the number of TLEs associated to an individual thunderstorm or closely related thunderstorm cells; the geograph- ical area covered by those TLEs; the period of TLE activity; and the TLE type. TLEs recorded in 370
one individual observation (e.g. several sprite elements in one video frame) were typically counted as one, unless they were clearly discernible as separate events. The geographical coverage of the TLEs was estimated by the observers on the basis of the camera field of view, its pointing direction and correlative meteorological data. The geolocation was performed either associating the TLE to its parent lightning stroke obtained through lightning detection networks, whenever possible, or to its 375
parent thunderstorm through the overall lightning and cloud conditions in the region of interest. In the database, the TLE data coverage was reported with a±1 latitude and longitude uncertainty for most observations, whereas the timing with a±1 minuncertainty. The±1 uncertainty reflects both the inaccuracy of the actual spatial extent of small events, and on their geolocation. Observations reported with higher accuracy were rounded to the closest 0.5 , assuming a minimum spatial extent 380
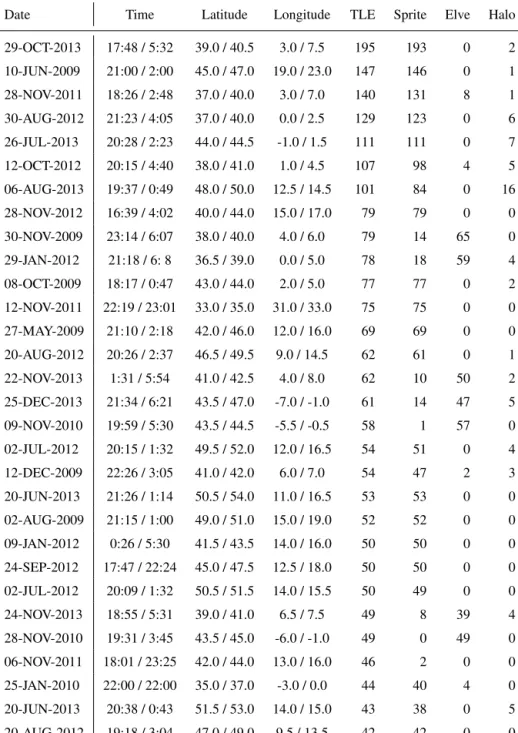
of 1 . An extract of the database with a selection of the most prolific thunderstorms is reported in Table 1. The database with the complete list of observations was made publicly available (Arnone et al., 2019).
3.3 Binning of observations
In order to avoid being affected by uncertainties on individual events, we studied the observed TLEs 385
only in terms of climatology, i.e. their mean distribution and variability. Eurosprite data entries were binned over 0.5 latitude and longitude bins, and over 1-month intervals, distributing their contribu- tion among all bins affected by the data entry/thunderstorm area. This implies an oversampling and smoothing was performed of data over a grid finer than the given uncertainty, in order to obtain an increased resolution allowed by higher accuracy observations and overlap of several observations.
390
Overlapping observations of the same events by multiple cameras was either accounted for directly by the observers (this is the case of e.g. the several cameras of the IMTN network), or by removal of the database entry with less counts in case of entries that clearly overlap in space and time. The latter removal was applied only to cases reporting more than 20 TLEs to avoid rejecting cases where few different TLEs were captured by different cameras over the same region. Seasonal and yearly 395
averages were calculated based on monthly means.
Lightning data from the WWLLN network was also analyzed in a similar fashion, producing a climatology with number of detected strokes within individual geographical bins in a certain season or year. In addition to that, the subset of lightning strokes which occurred during the night was
considered separately. Nighttime strokes were selected by considering the time of the local sunset 400
and sunrise. For lightning climatologies, we adopted a discretization of 1 in latitude and longitude in order to be less affected by differences at too fine regional scale and allow an easier interpretation of the TLE distribution main features. In several occasions, we studied lightning data within the limited area of camera coverage or that delimiting the actual TLE observations (see further details below), and performed integration of the overall stroke counts over these regions to obtain monthly 405
means. WWLLN lightning climatologies were used also to evaluate the distribution of TLE to stroke ratio and to simulate the expected TLE distribution based on detected strokes. In these calculations, the size of bins of the TLE climatology was accordingly increased to 1 .
4 Results
4.1 Eurosprite observations in 2009–2013: TLE and lightning climatologies 410
In the years 2009 to 2013, Eurosprite and partners recorded 8394 TLEs over 1018 thunderstorms.
The vast majority of observations were sprites, with 7157 classified events, followed by 641 elves and 280 halos. Also observed were 70 upward lightning processes, 2 blue jets and the first European gigantic jet (the latter recorded in December 2009, west of Corsica – see further details in van der Velde et al., 2010a). The remaining fraction of the events (4%) were reported as unclassified TLEs.
415
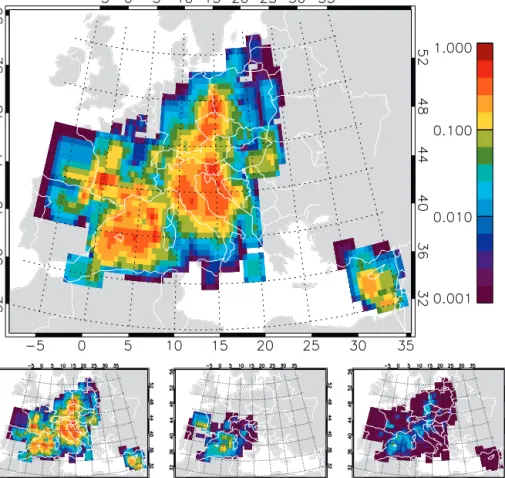
The climatology of TLEs above Europe and Southern Mediterranean Sea for 2009 to 2013 is re- ported in Fig. 2 as density of observed TLEs (TLEs·10 3km 2yr 1). All TLE types were merged into the climatology to allow an overall view of the activity of TLE-producing thunderstorms above Europe. The figure reports also individual climatologies for the three types of TLEs giving the largest contributions to the database, i.e. sprites, elves and halos. In a similar way, the 2009–2013 clima- 420
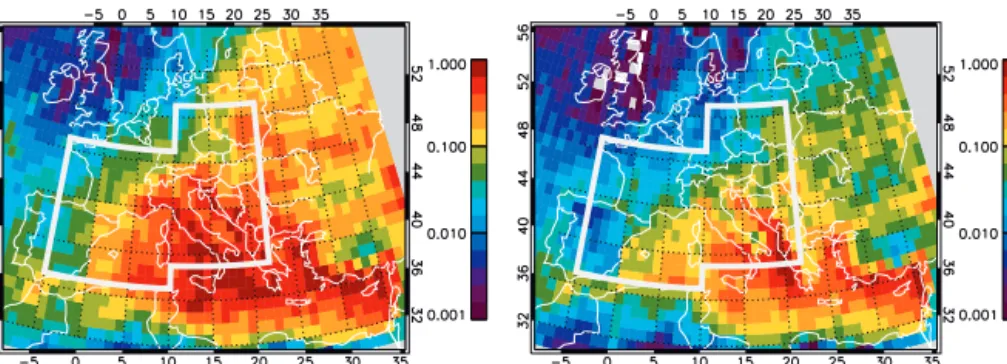
tologies of WWLLN lightning strokes as total daily counts and nighttime only counts are reported in Fig. 3 (strokeskm 2yr 1). Since TLEs are observed only during nighttime, the latter should be preferred for comparison, although both maps show relevant information on the geographical distri- bution of thunderstorm activity over Europe and the Mediterranean sea. In particular, total lightning can be more correctly compared to climate parameters in terms of e.g., temperature, winds and 425
precipitation. To ease comparison, the main area of observed TLEs over Europe is reported in the WWLLN map as reference (see white contours).
The geographical extension of TLE activity closely resembles the estimated observational cover- age, therefore supporting the overall viewing range adopted for the cameras. Drops in recorded TLE rates can promptly be associated with decreases in observational coverage. High TLE activity is 430
found in Southern France and around the Balearic Islands, in Italy and adjacent seas, then extending over Austria and the Czech Republic to the North, towards Hungary to the East, and with a separate set of observations around Cyprus. Despite the biases introduced by the location of the observational systems, some main features in the observed TLE climatology can be extracted with consideration of
both observational coverage and lightning activity. Within the regions covered by the observations, 435
the TLE main geographical distribution tends to mimic the distribution of thunderstorm activity.
This is evident in the northern part of the TLE climatology where large areas with a weak TLE rate are consistent with a drop in lightning activity over vast areas, e.g. in France and Germany, and particularly over Spain contrasting with the adjacent high activity over the Pyrenees. Interestingly, some local drops in TLE rates are consistently seen in lightning, as e.g. over Eastern Italy, and likely 440
Sardinia, a behavior that is related to nighttime lightning and less evidently to total lightning. Further similarities occur in the coastal areas of Northern Spain and Western France, where increased TLE rates are correlated with weakly increased nighttime lightning rates (more visible with a dedicated change of the color scale here not shown) and more evident in total lightning. High TLE rates are recorded at the German-Polish border with partial correlation to lightning activity (see spots of high 445
lightning activity in this region more visible in total lightning), whereas the high activity over Czech Republic is not reproduce by a similar increase in strokes counts. In contrast, the fading of TLE activity in Southern Italy and towards Eastern Europe is due to poor coverage. The poor coverage causes similar low rates over Corsica, North-West Italy and Hungary, where local cameras tend to observe only thunderstorms that occur at a certain distance from the observation spot.
450
As also evident looking at absolute numbers, sprites dominate the TLE climatology. The dominant role of sprites in our observations is also visible in the maps of individual types of TLEs. The TLE climatology closely resembles that of sprites. On the contrary, elves are predominantly observed over sea and coastal areas where they mostly reinforce features already present in the sprite climatology rather than changing it substantially. The only large change is on the Atlantic Ocean North of Spain 455
where almost no sprites were detected. Halos are observed both over sea and land, again not showing any peculiar features not seen in the sprite climatology. The observation of elves and halos are affected by the much lower detection efficiency found in low-light ground cameras as compared to sprites. Their resulting individual climatologies should be treated with care since they are more sensitive to the different optical system adopted.
460
4.1.1 TLE occurrence rate and TLE to lightning ratio
The peak TLE occurrence rate is close to or exceeds10 3km 2yr 1in a few hotspots in Southern France, Northern Mediterranean Sea, Italy, the Balkans and the German-Polish border, whereas it is typically around 0.2–0.3·10 3 km 2yr 1 in large adjacent regions. These rates and the main features of the climatology should be largely assigned to sprites, since the other observed TLEs 465
represent a minor fraction of the database. Elves were mostly observed over autumn/winter maritime thunderstorms in the Northern Mediterranean area, reaching rates in the order of 0.02–0.2·10 3 km 2 yr 1. Halos peaked at 0.02·10 3 km 2yr 1in most active regions. Comparison to total lightning rates seen in the lightning climatologies of around 0.2–0.3km 2 yr 1 within the same regions (see Fig. 3, left), suggests a factor around 1/1000 in the ratio of observed TLE to detected 470
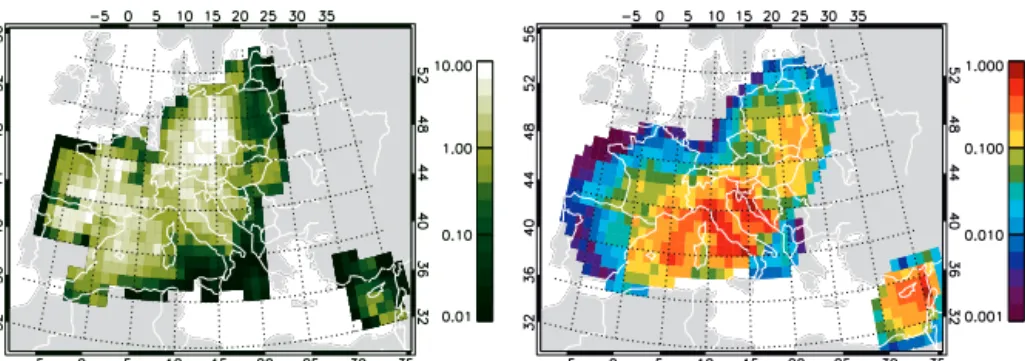
total lightning on a yearly average (recall the factor 10 3 in the TLE climatologies). To further inspect this relationship, the TLE to nighttime lightning stroke ratio is shown in Fig. 4 and was evaluated adopting a lower resolution 1 climatology of TLEs. Typical values of the ratio are of the order 1 to 10 in regions well covered by observations, and exceed 10 in a few hot spots previously identified, particularly in the area around the German-Polish border where many more TLE per 475
lightning stroke are observed. This ratio greatly changes as a function of season, with average values over the reference region of 0.5/1000 in February, 3/1000 in July and 1.5/1000 in November (the seasonal cycle will be discussed in Sect. 4.2).
Taking into consideration the shortages in the observational coverage, we can evaluate an average TLE to lightning stroke ratio only on those bins which have the highest ratio values. When consid- 480
ering the bins with the top 50% of the ratio values, the mean TLE to nighttime lightning stroke ratio is 2.7/1000; when considering the top 30%, the mean ratio increases to 4.3/1000 (corresponding to a value of 1.3 when total lightning is used in place of nighttime lightning). Note that over the whole climatology, the rate of nighttime to total lightning has a mean value of 0.39 and median value of 0.37, with higher values over coastal areas and sea, and lower ones over continents (not shown).
485
4.1.2 Simulated TLE distribution
Based on the above results, we simulated an expected observed TLE distribution scaling the night- time lightning climatology (see Fig. 3) by the observational coverage (see Fig. 1) and the estimated TLE to nighttime lightning ratio 4/1000. The observational coverage was normalized to a maximum value of 1. The results are shown in Fig. 4, right panel. The simulated TLE distribution now carries 490
information on both lightning distribution and observational coverage, with maximum values scaled by the adopted TLE to lightning ratio. The main characteristics and typical values seen in the ob- served TLE climatology are found also in the simulated one: e.g., overall extension and shape of the area covered by the observations, main active regions and the overall values, features of the high rate areas and low rate ones. Also, some peculiarities of the observed climatologies can now be more eas- 495
ily interpreted on the base of a simultaneous effect of lightning activity and camera sensitivity. This is the case of the TLE distributions in Northern Spain and Western France (where the line features could be better reproduced with a change in the color scale – not shown) or the drop in central Spain;
high rates in the Southern France coast and close to the Balearic Islands; and drop in the rates over Sardinia. The simulation reproduces correctly the observed drop over coastal Eastern Italy, Northern 500
France, and Germany, and can also pick out the behavior of the distribution observed over Hungary.
In contrast, the simulation does not replicate the behavior of the climatology over Czech Republic, Slovakia and Poland, where the observational coverage can be further refined. This can be done pos- sibly in dedicated studies where the actual field of view of each camera is considered. The simulation also predicts higher than observed rates around Cyprus because of the local very intense lightning 505
activity, although the overall area is reproduced suggesting lower weights should be estimated via dedicated studies.
The comparison of the observed and simulated TLE climatologies was evaluated quantitatively by inspecting the probability distribution functions and main statistics of the two datasets, consid- ering a 1.0 lower resolution TLE climatology which was found not to differ in its statistics from 510
the original 0.5 resolution climatology. The TLE and simulated climatologies have about 530 and 590 points respectively, with TLE rates greater than zero and lead to very similar probability dis- tribution functions (not shown). Mean TLE rates for the observed climatology are 0.07, 0.10 and 0.21 (medians 0.03, 0.07 and 0.19)·10 3km 2yr 1considering only geographical bins with rates above 0, above 0.01 and above 0.1·10 3km 2yr 1respectively. In comparison, mean TLE rates 515
for the simulated climatology are 0.11, 0.13 and 0.25 (medians 0.05, 0.07 and 0.20)·10 3km 2 yr 1 respectively. The slightly higher mean values of the simulated climatology can be reduced adopting a TLE to nighttime lightning rate of 3/1000 to 0.08, 0.10 and 0.21 (medians 0.04, 0.06, 0.17)·10 3km 2yr 1, although at the expenses of the median which is also slightly reduced, and of a poorer simulation of rate values over some areas (e.g., Spain and France). Overall, the adoption 520
of a 3.5 or 4/1000 ratio seems to be adequate, supporting a posteriori what was previously calculated based on the top 30% of the geographical bins with highest rates.
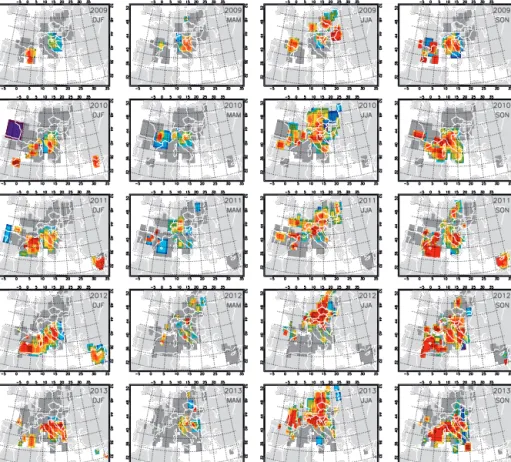
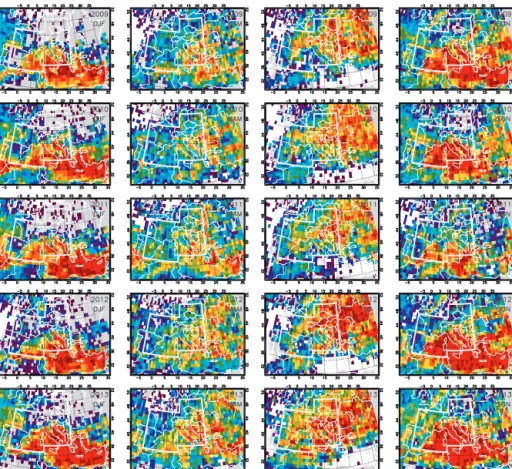
4.2 TLE seasonal cycle above Europe: changes to the mean geographical distribution Seasonal averages of the geographical distribution of TLEs for individual years 2009 to 2013 are presented in Fig. 5. Dark grey shades show the overall area of observed TLEs during each year. As 525
for the yearly average, the same seasonal averages are reported also for WWLLN nighttime light- ning strokes in Fig. 6. Color grading refers to Fig. 2 and 3, respectively. In terms of seasonal change, TLE activity over Europe is concentrated over the sea in winter, then moves to the coastal areas in spring substantially fading in intensity, it increases and spreads over the continent in summer, and relocates again over the sea in autumn. This behavior is very consistent among the 5 years of the 530
sample. The activity in the Southern Mediterranean Sea is consistent with the onset of maritime thunderstorms in autumn and winter (see Yair et al., 2015, for further details). Comparison to Fig. 6 shows a remarkable consistency. Firstly, the general seasonal oscillation of TLE detection between land and sea is consistent with thunderstorm activity. Secondly, detailed comparison of the hotspots of observed TLEs within a certain season corresponds in most cases to regions having the highest 535
lightning rate (see e.g. the coastal and sea areas close to Southern France, Balearic Sea and Italy), or, vice-versa, lack of TLEs corresponds to very low lightning rates (e.g. France and Germany as mentioned above). There are clear deviations from this general winter over-sea and summer-land behavior, e.g. in the case of autumn thunderstorms observed at the border of Czech Republic, Ger- many and Poland both in 2011 and 2012, or of the large summer activity observed in 2011 around 540
the Balearic islands. Consistently, in both cases there are signatures of high lightning activity also in
WWLLN data (note that the maps show the yearly rate perkm2, so that rates in individual seasons can largely exceed that calculated over the whole year dataset).
Especially during its first months, 2009 shows a relatively poorer data coverage as compared to the following years. Despite this difference, the main features in the distribution of TLEs are 545
repeated over the years, making it meaningful to average the 5 years together as performed in Fig. 2.
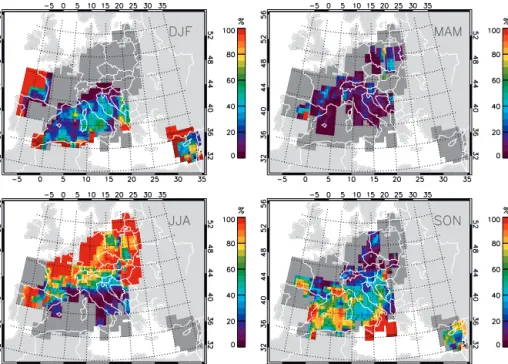
In order to remove the bias induced by the clustering of optical observation systems over specific regions (see Fig. 1), we normalized the seasonal distributions of the observed TLE activity by the 2009-2013 yearly average (Fig. 2). Results of the normalization are reported in Fig. 7 as percent component of the yearly mean. The magnitude of the seasonal changes in the distribution of TLEs is 550
now more clearly visible: TLEs are detected largely over the sea in winter followed by a negligible activity over land in spring. In summer, TLEs are detected largely over land and the higher alpine regions (see both activity over the Pyrenees and the Alps) abruptly shifting the activity over the coastal areas and sea in autumn. The strongest activity over the sea in most areas is seen in autumn, together with a strong in activity throughout Italy (with maximum activity spread in autumn and 555
winter). Particularly interesting is the highlight of the activity over the Southern Mediterranean Sea around Cyprus, shifting from the southern area in autumn to the northern area in winter.
4.3 TLE seasonal cycle above Europe: a monthly mean perspective
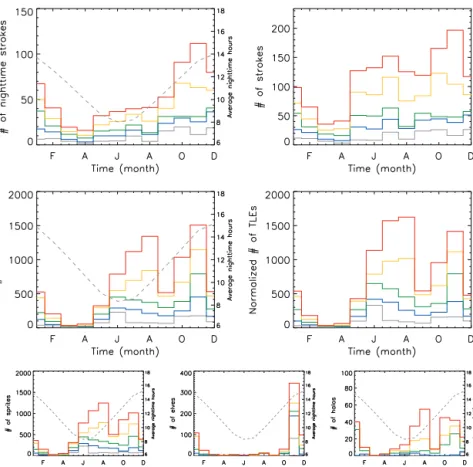
We further analyzed the seasonal evolution of TLEs calculating total average TLE and lightning stroke counts above Europe per month (see Fig. 8). The calculation for TLEs was performed without 560
the inclusion of ILAN observations of the Southern Mediterranean in order to have a more uniform area and a more consistent seasonal behavior; for consistency, we included only lightning data within the main TLE coverage (see white contours in Fig. 3). Monthly nighttime lightning and TLE counts (Fig. 8) both show a largely consistent seasonal cycle with generally two active seasons (summer and autumn) separated by a deep minimum in late winter–spring (mainly March and April), and a 565
relative minimum in late summer–early autumn (in September for TLEs, and August for lightning but not when including 2013). Maxima are reached in August and November for TLEs, and July and November for lightning. This behavior is fairly consistent among the 5 years, apart from a very active June in 2009 (which was largely affected by the most prolific thunderstorm in the sample, see 4.4). Both in summer and autumn, TLEs appear to peak some time later than lightning, but in both 570
cases November is the most prolific month. In Northern Europe, most of the TLE observations are made in late summer (Aug-Oct) between 19 and 03 UTC. Despite most of the lightning occurs in June to August in this region, the relative number of TLE detections is lower in this period partly because of the bright summer sky but mostly due to the much higher threshold in lightning charge moment change required to initiate daytime sprites (Stanley et al., 2000).
575
In addition to total TLE counts, bottom panels in Fig. 8 report the individual seasonal evolution of the occurrence of sprites, elves and halos (left to right). The overall behavior of the TLE seasonal
cycle is very close to that of sprites, although elves contribute significantly to the November peak, which in the sprite cycle is smaller than the August one. Elves partially contribute also to December and January, making the period November-January the only one with significant activity, consistently 580
with the shift in activity over the sea shown in Fig. 7. Halos tend to mimic the sprite seasonal cycle and lead to no significant effect on the TLE seasonal cycle.
The seasonal evolution of the number of nighttime hours should be taken in consideration when comparing summer and autumn counts since optical observations of TLEs are only available at night.
This effect can be very pronounced at high latitude. In order compensate for the varying length of 585
nighttime conditions, we calculated an average nighttime duration (considering duration for Bari, Budapest, Warsaw and Granada – see dashed grey curve in Fig. 8) and normalized the monthly counts to a constant 12-hour night. The results are reported in Fig. 8 together with monthly mean lightning activity from the whole day (right panels). The overall TLE behavior is confirmed, with two distinct summer and autumn seasons now reaching similar total counts per month. An almost 590
flat distribution between May to November is found for lightning, with an increase during July in some years.
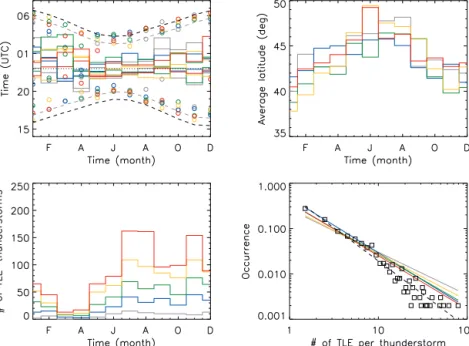
An analysis of the time of occurrence of the observed TLEs is shown in Fig. 9 (top-left panel), reporting for each month both the average start and end of the observations (step lines) and the earliest as well as the latest observation (circles). The average start and end tends to be very close 595
to the reference local midnight (at 11 UTC, dotted black line) in May to August, then increasing the average observation interval with increasing nighttime hours in autumn and winter, with a tendency to last longer during the second part of the night. First observations of each month generally start 1 or 2 hours after sunset (see bottom of the figure), whereas the last observations typically occur within 1 hour before sunrise, and sunrise (or slightly beyond). This indicates well that nighttime ionospheric 600
conditions change locally only about 20 minutes past the ground-level sunrise time (Satori et al., 2007). Note that the time information for February to April is based on a very limited number of observations.
Figure 9 also reports the seasonal evolution of the average latitude of the observations during the 5 years (top-right panel, compare to Fig. 7). The seasonal changes in the distribution discussed above 605
are now summarized by an average latitude: It cycles between 41–42 latitude in autumn and winter, and 46–47 latitude in summer, with a fairly consistent behavior among the years, and therefore well characterizing the geographical change above Europe. Since the main seasonal change in TLE activity occurs in latitude, no meaningful information can be extracted from average longitude.
4.4 TLE-producing thunderstorms 610
The seasonal evolution of the number of observed TLE-thunderstorms in 2009 to 2013 is reported in Fig. 9 (bottom-left panel) in a similar fashion as for the number of TLEs in Fig. 8. For consis- tency, data from Israel were again excluded from the analysis. Here we assume that each entry of the
database (i.e. a collection of TLEs observed above the same thunderstorm or closely related thun- derstorm cells) can be considered as an individual thunderstorm system, although some database 615
entries may likely extend over several thunderstorm cells which were observed during the observing period. In general, separated sprite-producing periods were reported so the opposite may also be true: Several entries may correspond to the same thunderstom at different stages. Care should thus be taken to interpret these results correctly. Peaks in number of observed TLE-thunderstorms are reached in July, August and November, consistently with lightning activity, with about 150 TLE- 620
thunderstorms accumulating over the 5 years. Comparison to TLE counts in Fig. 8 (top-left panel) shows that November is characterized by fewer but more prolific TLE-thunderstorms as compared to summer months. Out of 1018 observed thunderstorms, 801 (79%) were reported with less than 10 TLEs each, 921 (90%) with less than 20, 97 (10%) with 20 or more, 56 (6%) with more than 30, 34 (3%) with more than 40. The majority of the observations were related to relatively small 625
thunderstorms and small TLE area. An inspection of the size of the reported TLE area showed in fact about 600 entries reported with a 0-10,000 or 10-20,000 km2area, followed by a second group of about 200 entries with a 30-40,000 km2area and the remaining 200 entries with reported larger areas. Considering that also the possible motion of the thunderstorm during the observation affect the area, this is an indication that the TLE production area was often close to the size of TLEs and 630
of the uncertainty in their geolocation. Clearly, closer analysis of individual thunderstorms will be needed to further asses the actual TLE-production area.
The distribution in number of TLEs observed per thunderstorm is reported in Fig. 9 (bottom-right panel) in a log-log view. The occurrence is defined as the fraction of thunderstorms having a certain number of TLEs; only cases occurring more than once are considered. The distribution of number of 635
thunderstorms as function of number of TLEs per thunderstorm (n) follows a power law proportional ton kas shown by a best linear fit in the log-log plot with coefficientk= 1.5(dashed black line) and having a correlation of –0.96. The power law fits for individual years 2009 to 2013 are also shown, and have correlation coefficients -0.87, -0.97, -0.91, -0.88 and -0.95 respectively. The linear fits for individual years are similar among them (-0.94 for 2009 and between -1 and -1.2 for the other 640
years), but have a weaker slope as compared to the multiyear average: this is due to the fact that increasing the number of entries, more bins with more than one count enter the curve and these bins are increasing the weight of the fit on the right tail of the distribution. Correlation coefficients and slopes for individual years and for the multiyear distribution show a consistent power law behavior, suggesting the law may be expected to apply for large sample of thunderstorms observed over Europe 645
in future years.
The 30 most prolific thunderstorms are summarized in Tab. 1. In particular, 12 of these thunder- storms were observed during the summer season (or late spring), and 18 during the autumn-winter season. Seven thunderstorms were reported with more than 100 TLEs each, the most prolific one being observed 29 October 2013 with 195 TLEs (193 sprites and 2 halos), followed by a thunder- 650
storm on 10 June 2009 with 147 TLEs (146 sprites and 1 halo, a thunderstorm analyzed in detail by Bór (2013)) and by a thunderstorm on 28 November 2011 with 140 TLEs (131 sprites, 8 elves and 1 halo). The 29 October 2013 case was studied by (Soula et al., 2017), with more than 100 sprite videos reported in terms sprite/stroke pairs. The 10 June 2009 thunderstorm makes up most of the anomalously high June TLE count found in 2009 as shown in Fig. 8 (top-left panel). Most of the 655
prolific thunderstorms were reported with almost only sprites. Seven thunderstorms were reported with a significant (greater than 30) number of elves and were all observed during the autumn-winter season (4 in November, one in December and one in January). The 12 December 2009 thunderstorms included observation of the gigantic jet discussed above, and of an upward lightning. For compari- son, data for the 12 November 2011 thunderstorm observed from Israel were included in the table:
660
this is the only case of a very prolific thunderstorm observed to last only 40 minutes, whereas all other prolific thunderstorms observed above Europe and coastal areas lasted several hours each.
5 Discussion
The dataset and climatology presented in the previous section represent the first attempt to have such a coordinated ground-based climatology over Europe and Mediterranean sea. Similar continuous 665
observations were performed over limited regions such as the US High Plains (Lyons, 1996) or in Japan (Adachi et al., 2005; Suzuki et al., 2011). Considering that only a negligible fraction of satellite observations of TLEs are currently taken over Europe (Chen et al., 2008), this is also the largest European TLE dataset available to date. The overall distribution and seasonal cycle of TLEs present robust features repeated in all the 5 years included in the sample, both as number of observed TLE- 670
producing thunderstorms and as number of observed TLEs. This includes the two-peak seasonal cycle, with maxima in summer and late autumn, separated by two minima in March-April and less pronouncedly in September-October. The two active seasons are due to land driven convection during summer, typically associated with large thunderstorms, and sea driven convection during autumn and winter, found in synoptic-scale weather systems which transport cold continental air masses over 675
the relatively warm Mediterranean Sea water, leading to instability and convection, and generating smaller thunderstorm cells. For example, the thunderstorm producing 54 TLEs on 12 December 2009 including the first European GJ, was composed by several small cells with cloud top height of only 6 km (van der Velde et al., 2010a). Nevertheless, TLEs were observed to be produced by fewer but more prolific thunderstorms in autumn rather than in summer. The shift of TLE activity from the 680
continental areas in summer to sea and coastal areas in autumn and winter is therefore abrupt both in the region of activity and in the leading processes driving the TLE production.
The observed evolution of the TLE distribution is remarkably consistent with lightning activity reported by the WWLLN network within the region of Eurosprite observations, similarly to the migration from land to coastal and maritime regions previously observed over the oceans (Füllekrug 685
et al., 2002). The adoption of an observational sensitivity map based on actual regions covered by each camera and the related simulated TLE climatology allows a better interpretation of the main features of the observed climatologies, assigning them to either observational limitations or lightning activity. Considering the number of shortages that were not included in the calculation, the agreement between the observed and simulated climatologies is remarkable. On the one hand, dedicated studies 690
can be planned to further inspect specific regions and try to resolve the differences in terms of observational capabilities. On the other hand, this comparison also sheds light on possible differences in the behavior of TLE-producing thunderstorms in terms of production rates: can one expect the same TLE to lightning rate for all thunderstorms? Our results point to a very good consistency in the majority of cases but cannot exclude large differences. Discrepancies will therefore need to be 695
further investigated inspecting the +CGs/-CGs ratio or further characteristics of the thunderstorms.
Thunderstorm characteristics can be very much different in autumn/winter maritime thunderstorms and in summer continental ones (e.g., McGorman and Rust, 1998). Interestingly, our results for the summer season show a very similar distribution as those found with radio measurements by (Füllekrug and Reising, 1998, , their figure 3).
700
This includes also a larger fraction of high charge moment change and high peak current light- ning, respectively needed for sprite and elve generation (e.g. Pasko et al., 2011). The climatological approach will aid in the comparison to relevant electrical and atmospheric parameters at large scale.
In agreement with previous studies of European TLE-producing thunderstorms (Neubert et al., 2001; Neubert et al., 2005, 2008; Soula et al., 2010; van der Velde et al., 2010b), the majority of 705
TLE-producing thunderstorms in 2009-2013 was relatively small, with a limited TLE area and were reported to produce a small number of TLEs as compared to large thunderstorm observed e.g. in North or South America (Lyons, 1996; Taylor et al., 2008). The power law we found describing the number of thunderstorms producing a certain number of TLEs is novel and not reported before and would certainly need to be proved also in other continents. This power law behavior is not un- 710
expected, since it is often found in several other natural phenomena, such as when describing the occurrence and intensity of e.g., tornadoes, fires, earthquakes (see the review by Pinto et al., 2012).
Furthermore, it is also found in describing the distribution of terrestrial gamma ray flashes (TGFs), the second type of exotic emissions produced by thunderstorm activity (Smith et al., 2005). Since the power law was found to be consistent over the 4 most prolific years, it suggests a possible new 715
pathway for modeling the occurrence and distribution of TLEs and TLE-producing thunderstorms above Europe and other regions, so as to further fill the gaps in the observations and allow inclu- sion in global models (see e.g. the parametrization adopted by Arnone et al., 2014). Given a large sample of TLEs (e.g. from intermittent satellites passages over Europe), the scaling to obtain yearly rates should be performed by clustering the observations over individual thunderstorms as described 720
by the power law. It also allows a new approach for comparing the distribution of TLE-producing thunderstorms over different regions of the globe.