POINT OF VIEW
Challenges in developing an interdisciplinary teaching material on effects related to the Earth’s rotation 1
Andrea Gróf, Ákos Szeidemann, and Tamás Tél
Abstract:The increasing public attention attracted by environmental issues requires the understanding of the physics behind large scale motions of the atmosphere and the oceans. It is therefore necessary to extend the scope of secondary education to the physical principles behind these phenomena related to the Earth’s rotation. The main message to convey is the fascinating effect that the importance of the Coriolis deflection increases with extension in space. The communication of size making such a difference requires quantitative considerations, whereas high school treatment is scarce and only provides a qualitative explanation of the Coriolis deflection. To bridge this gap, we have developed secondary level teaching material on the physical background of large-scale environmental processes and made it available on the internet for interested students and teachers. Aimed at regular secondary school students, it requires no further knowledge beyond the very basics of mechanics. The material consists of a core study and several extensions. The core study only uses elementary formulae and is easily followed by as independent learner or completed in three teaching periods in class. It begins with simple hands-on experiments from which students can derive the expression of the Coriolis acceleration. Students can also use data from their own experiments or everyday life observations to obtain a numerical measure of the strength of the Coriolis effect. Through the three sections, the material proceeds from small scales, where the Coriolis effect is practically negligible, to planetary scales, where the effect inevitably becomes dominant. As an illustration of the difference between the large and small scales, it also reveals why a video pretending to demonstrate the different rotation of plughole vortices around the Equator must be faked. The material has been developed in permanent contact with students, the paper also shows steps of improvement based on the feedback received from them.
Key words:secondary school teaching, rotating Earth, Coriolis force, self-study, cyclone.
Résumé :L’engouement croissant du public pour les questions environnementales requiert une connaissance de la physique derrière les mouvements à grande échelle de l’atmosphère et de l’océan. Il devient alors nécessaire d’étendre le champ de l’éducation secondaire concernant les principes physiques à la base des phénomènes reliés à la rotation de la Terre. Le message principal à transmettre est que l’effet fascinant de la déflexion de Coriolis croît avec l’extension de l’espace. Communiquer l’importance de la taille de l’espace requiert une étude quantitative, alors que l’explication de l’effet Coriolis au secondaire se fait largement de façon qualitative. Afin de combler ce fossé, nous développons du matériel didactique de niveau secondaire sur les fondements physiques des processus à grande échelle, qui est rendu disponible sur Internet pour les étudiants intéressés et pour leurs professeurs. Visant les étudiants du secondaire, ce didacticiel ne requiert aucune connaissance au-delà de la mécanique très élémentaire. Le matériel se divise en un cœur et plusieurs extensions. Le cœur n’utilise que des formules élémentaires et un étudiant peut le suivre par lui-même ou il peut être complété en trois périodes d’enseignement en classe. Il débute avec des expériences pratiques simples, desquelles les étudiants peuvent dériver l’expression de l’accélération de Coriolis. Les étudiants peuvent aussi utiliser les données de leurs expéri- ences ou leurs observations dans la vie de tous les jours pour obtenir une mesure quantitative de l’effet de Coriolis. À travers les trois sections, le matériel débute avec les petites échelles où l’effet de Coriolis est pratiquement négligeable jusqu’à l’échelle planétaire où l’effet devient inévitablement dominant. Comme illustration de la différence entre petite et grande échelle, le matériel révèle pourquoi un vidéo qui prétend démontrer que les vortex d’évier changent de direction en traversant l’équateur doit être truqué. Le matériel est développé en constant contact avec des étudiants et nous identifions les améliorations qui ont été apportées suite aux commentaires des étudiants. [Traduit par la Rédaction]
Mots-clés :enseignement au secondaire, terre en rotation, force de Coriolis, auto-apprentissage, cyclone.
1. Motivation
The physical processes of the atmosphere and oceans are sub- jects of ongoing scientific research [1]. Since the issues of sustain- able development, the depletion of energy sources, and climate change receive a lot of public attention, it is imperative that sec- ondary education also takes action. The elements of large-scale
environmental processes such as cyclones or climate change can- not be understood without understanding the dynamics of rotat- ing systems, which is typically not part of the physics curriculum.
Most existing treatment of the Coriolis effect at the high school level involves a simplified qualitative approach explaining why deflection occurs, and applications to the Earth’s rotation do not
Received 2 August 2019. Accepted 29 May 2020.
A. Gróf.Karinthy Frigyes Gimnázium, 7 Thököly utca, Budapest 1183, Hungary.
Á. Szeidemann.Eötvös József Secondary School, Tanoda tér 5, Tata 2890, Hungary.
T. Tél.Institute for Theoretical Physics, Eötvös Loránd University, and MTA-ELTE Theoretical Physics Research Group, Pázmány Péter sétány 1/A, Budapest 1117, Hungary.
Corresponding author:Ákos Szeidemann (email:szeidiak@gmail.com).
1This paper is a part of the July 2020 special issue honoring Professor Li-Hong Xu.
Copyright remains with the author(s) or their institution(s). Permission for reuse (free in most cases) can be obtained fromcopyright.com.
Can. J. Phys. Downloaded from www.nrcresearchpress.com by Ákos Szeidemann on 08/13/20 For personal use only.
normally venture beyond Foucault’s pendulum demonstrating the effect (see e.g., [2]).
Although large-scale phenomena constitute the main focus of the material, there appears to be a strong demand to address the question of whirling water in a plughole, too, as learnt from the participants of an in-service training course offered to interested high school teachers years before this project was launched.
When they were shown how the appropriate formula (eq. (3)dis- cussed below) can be used to estimate the importance of the Coriolis effect, they immediately asked how all this applied to a kitchen sink. They said that was what their students always wanted to know.
Therefore, our interactive material available on the internet [3]
aims to provide an understanding of the Coriolis effect from small (household) scales to large, geographical scales. In the case of large-scale motions, the existence of the von Karman Laboratory for Environmental Flows [4] operating at Eötvös Loránd University adds extra motivation to our work. The Laboratory is open to visitors of all ages: kindergarteners to adults. Visitors are shown demonstration experiments including the formation of cyclones.
Seeing the appearance of such flows, they can observe how the Coriolis deflection leads to counterintuitive consequences not supported by everyday experience. The teaching material was also designed with the purpose to help interested students learn about the physical background of what was seen in the demonstrations of such laboratories.
Based on the textbooks that we know, printed secondary-level resources on this topic are scarce. Materials available on the inter- net are also either too technical [5], entirely qualitative [6], or written for university courses [7]. Our aim has been to give sec- ondary school students the opportunity to come to a quantitative understanding by applying simple formulae to the estimation of the strength of the Coriolis deflection. To gain better insight, the reader might want to refer to the material [3] along with reading this paper presenting the challenges of making the topic accessi- ble to secondary school students.
2. Structure and development of the material
The material is designed to support either independent learn- ing or assisted classroom treatment. In addition to demonstrating videos, the reader is invited to carry out simple experiments. The experiments do not require sophisticated technology or extensive preparation. Students enjoy the experiments, which can be easily carried out either at home or within the framework of a standard teaching period at school, including discussion and the process- ing and analysis of the data collected.
The material aims to cater to students of various levels of mo- tivation and mathematical skill. The backbone of the course allows the reader to follow a straight linear path from the intro- duction to the final conclusions. Branching off from the main path, an advanced or motivated reader can follow ample exten- sions with extra information. Numerical problems requiring the use of (secondary school level) mathematics to support deeper understanding are available throughout the material.
The course is divided into three main sections. After two videos to present the issue of Coriolis deflection, the introductory sec- tion uses a simple hands-on student activity with rotating disks that enables students to deduce the relationships needed for quantitative treatment. The activity involves a paper disk on a drawing board that is rotated around a pin by an assistant while the experimenter is drawing a line on it, moving the pencil uni- formly. With the simplifying assumption that the deflection is small relative to the displacement in the original direction, the formula for Coriolis acceleration is discovered.
The second part applies the results to the rotating Earth by discussing situations where the Coriolis effect is weak. It ad- dresses the deflection of projectiles in sports and in warfare, as
well as the case of draining water, concluding that the effect is imperceptible under household circumstances, and requires so- phisticated experimental precision to demonstrate. In addition, ingenious historic experiments by Foucault and Eötvös are also mentioned.
All the phenomena treated in the previous section occur on
“human” scales and range in size from a fraction of a metre to a few hundred metres, at most. However, the quantitative descrip- tion of the strength of the effect has a remarkable consequence:
the relevance of the effect increases with size. Therefore, the Coriolis deflection always becomes dominant on geographical scales. The third section expands on large-scale motions in the atmosphere and oceans. It explains the operation of cyclones and anticyclones, wind direction on weather maps, and some interest- ing features of ocean currents.
At the end of each of the three main sections, the readers are offered a short quiz to provide immediate feedback on their prog- ress.
3. Challenges faced in developing the material
Because of the high degree of abstraction and the mathematics applied, the well-established and clear description of accelerated frames in theoretical physics [8,9] or in meteorology literature [10–12] cannot be presented in secondary education. The interpre- tation of the physics behind the Coriolis effect for high school students thus entails a wide range of difficulties to overcome.
Complex phenomena need to be simplified to develop a high school level approach, but they should not be oversimplified to the point where the reader is deceived.
At various stages in the development process, the material was tested with groups of volunteering 9thgraders to check their un- derstanding. They were given multiple choice questions and the results of these intermediate surveys were used in modifying the course through several steps of iteration in the spirit of design- based research [13]. The challenges presented by some of the iden- tified problem areas, and the steps taken towards eliminating them, will also appear in the sections below.
3.1. Keeping the mathematics simple
The first part of the material is based on teaching experience that a motivated student with a willingness to manipulate alge- braic expressions does not need to be presented the Coriolis ac- celeration formula, they can develop it for themselves. The experiments with rotated cardboard disks offer the opportunity to explore the phenomenon beyond the mere observation that the path will be curved in a rotating frame.
The quantitative approach should be based on and linking to existing high school knowledge. The initial segment of the pencil mark on the rotated disk resembles a half parabola. Students are comfortable with the kinematics of uniformly accelerated motion and can interpret the information in a parabolic displacement time graph. By taking measurements on the paper disk (Fig. 1) and graphing the displacement against the square of time (measured in arbitrary units), they can verify that the relationship is qua- dratic for small enough deflections.
Students are also familiar with the kinematics of uniform cir- cular motion. By putting together knowledge from the two previ- ously unrelated chapters of kinematics, and restricting the analysis to short times, students are guided to develop the expres- sion for the Coriolis acceleration for themselves.
aC⫽2v⍀
wherevis the velocity of the moving object relative to the rotating disk during this short time of observation and⍀is the angular velocity of the rotating reference frame.
Can. J. Phys. Downloaded from www.nrcresearchpress.com by Ákos Szeidemann on 08/13/20 For personal use only.
It is important to point out that the curved nature of the path on a rotated paper sheet is illustrated by several videos available on the internet (see e.g., [14,15]), but none of these arrive at the conclusion that the curve is locally parabolic, let alone the quan- titative relation for the acceleration.
However, there is a price to pay for reducing the level of abstrac- tion by the simplifying approach through the concept of uni- formly accelerated motion. It takes extra abstraction to realize that the reason for the approximation with a parabola being valid only while the deflections are sufficiently small is that with the direction of motion changing, the direction of the acceleration is changing, too. When the motion is observed at a later time, the direction and magnitude of velocityvis typically different. Stu- dents need to understand thataCis the magnitude of a changing acceleration vector that always remains orthogonal to the instan- taneous velocity vector, directed to the right in the case of positive (counterclockwise) rotation.
In a suggested additional experiment and in the related numer- ical exercise, the starting point of the line drawn on the rotated cardboard disk is not at the centre of rotation. In this way, stu- dents can discover the presence of an additional acceleration that points radially outwards. A formula for the magnitude of this acceleration can also be deduced from the data measured. This leads to the realization that both the Coriolis and centrifugal accelerations are relevant on a rotating disk. It is important to point out, however, that when we switch to investigating motions on the rotating Earth later on, the centrifugal acceleration need not be considered any more, as it is already included in the free fall accelerationg.
The paper disk experiments naturally lend themselves to going even further, such as investigating the ratio of the modulusDof the deflection to the distanceLtravelled. For small values of the relative deflectionD/L, where the deflection is caused by the Co- riolis force alone, it is easily shown to be expressed as
D L ⫽⍀L
U (1)
withUrepresenting the typical speed of the moving object. In this first setup, it denotes the projection of the instantaneous velocity onto the direction of the displacement, averaged over the motion.
By substituting estimated values of the quantities involved, the relative deflection is found to be only about 0.001 for a WWI
cannon ball, and as low as 5 × 10⁻⁵for water whirling in a kitchen sink.
A plughole vortex therefore requires a more thorough investi- gation. As water flows towards the drain, the inward motion of the water gives rise to a rightward Coriolis force (on the northern hemisphere), making it reasonable to expect a counterclockwise vortex to form (Fig. 2). However, the observation of household sinks reveals that the rotation may occur in either direction.
To see that the direction in which the whirling is initiated de- pends on other factors, it is instructive to quantitatively compare the Coriolis acceleration of the water to that caused by other forces that prove to be several orders of magnitude stronger. In one of the numerical problems, students are guided to estimate the acceleration of the water owing to a pressure difference that results from a surface height difference as small as 1 mm over a distance of 1 cm. The horizontal acceleration is found to have a magnitude of 1 m/s2, which is 105times larger than the typical Coriolis acceleration in a plughole.
3.2. Misconceptions and lack of critical thinking
The general interest in the behaviour of draining water suggests a possible way of attracting readers to the course. The material therefore begins with a video [16] chosen from several similar videos that everyone can find on the internet. The other purpose of using this kind of video was to make students conscious of the internet often being an unreliable source of information.
The film shows water draining from a container through a hole at the bottom, and “demonstrates” how the sense of rotation changes if the container is moved across the Equator and the experiment is repeated 20 metres away. After watching the film, the reader is asked whether the demonstration in the film was justified or not. The answer is not given at that point; the reader is invited to continue, and at the appropriate point of the course, with all the physical background explored, the question is re- peated.
It was reasonable to expect that the conclusions reached by the material would suffice to debunk the myth of the plughole and help students conclude that the video was based on cheating.
However, readers of an earlier version of the material were found to be unable to connect the video to what was learnt from the course. The widespread myth of drains turning in different direc- tions on the two hemispheres, reinforced further by such fake demonstrations, turned out to suppress all critical thinking.
A more subtle indication of the lack of critical thinking is the failure to recall what was learnt at school about inertial reference frames. The everyday practice to assume that a laboratory can be considered an inertial reference frame is justified by the fact that the Coriolis force is practically negligible on the scale of everyday living and working spaces. It would represent a contradiction if the swirling in a kitchen sink could convey information about its position on the rotating Earth.
To a question of the intermediate quiz addressing the direction of plughole vortices in the northern hemisphere, no one chose the correct answer of there being no preferred direction (58% an- swered counterclockwise and 42% answered clockwise). When asked whether the sense of rotation in the video was determined by the Coriolis deflection or by the shape of the container and the way it was filled with water, 90% named the Coriolis effect. As described below, these results prompted adding more explana- tion and more hints to the material to guide the reader towards the correct conclusion.
3.3. Interpreting the quantitative expressions obtained Physics exams and tests traditionally contain questions on how a certain quantity will change if one or more other quantities are changed by a given factor. Students often tend to answer these questions intuitively rather than by referring to the appropriate Fig. 1. Diagram created by a student analyzing the deflection of a
pencil line on a paper disk rotated clockwise. Thetaxis in the diagram corresponds to the pencil line as it would appear on the nonrotating disk. [Colour online.]
Can. J. Phys. Downloaded from www.nrcresearchpress.com by Ákos Szeidemann on 08/13/20 For personal use only.
formula. This may have been the case with students answering such questions on the intermediate quiz.
They were asked:
1. how the deflecting force would be influenced by doubling the angular velocity of the rotating disk, and
2. how the deflecting force would be changed by doubling the velocity of the object moving on the rotating disk.
In the case of the angular velocity, nearly 70% knew that the Coriolis force would also double, while in the case of the ve- locity of the moving object, more than 50% claimed that the Coriolis force would be halved (rather than doubled). The fail- ure to answer this question is in remarkable contrast with the surprisingly high rate of success with the question asking 3. how doubling the velocity of the moving object would affect
the relative deflection (represented by the ratio of the deflec- tion to the distance covered in the original direction) when the deflection is weak.
In this question, 70% answered correctly that the relative deflec- tion would be halved.
These results indicate that students read the questions too su- perficially to be able to distinguish between questions 2 and 3, or that the answers in both cases were actually prompted by the same semiquantitative reasoning: if the object travels twice as fast from the centre of the disk to the rim, the disk will have half as much time to rotate under it, so the deflection will be half as much. While in question 3 this leads to the correct answer, in question 2 it is in error: half as much displacement in half as much time involves twice as much acceleration (since half as much time and the same acceleration would produce only one quarter as much displacement). Whatever the mechanism, in one way or another, these answers reveal that the quantitative relationships between the quantities require more emphasis, therefore the ma- terial was changed accordingly by bringing the formula of Coriolis acceleration more into focus.
3.4. The vector nature of angular velocity
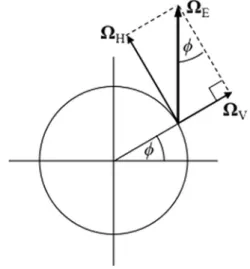
Another challenge lies with making a transition from the rotat- ing disk or playground carousel to the rotating Earth. Since the motions we were aiming to explain typically occur along horizon- tal surfaces instead of planes perpendicular to the axis of rotation, we cannot avoid decomposing the angular velocity ⍀E of the Earth into components and showing how the vertical component is obtained at a given geographical location.
The treatment of angular velocity as a vector proved to be a great deal of abstraction in itself. In an earlier version of the material, intermediate student feedback revealed that we lost most of our readers at this point: only about 40% were able to
recall that the angular velocity vector was parallel to the rotation axis. Further questions on components showed even more confu- sion. To improve the efficiency of this part of the course, a dia- gram was added, with vectors drawn to a point of intermediate latitude on the Earth (Fig. 3).
The current form of the material emphasizes that on the rotat- ing Earth, it is actually the vertical component⍀Vthat should be used instead of⍀in the expression(1)
D L ⫽⍀VL
U (2)
A video animation was also added, demonstrating that a rotation about one axis is represented as the result of two subsequent rotations about a pair of perpendicular axes, with the correspond- ing components of the angular velocity. However helpful a visual aid such as the animation is found to be in eliminating one con- ceptual difficulty, it needs to be handled with care to avoid an- other pitfall. It needs to be emphasized that the angles in the animation are exaggerated: the decomposition into components applies to (instantaneous) angular velocities, but does not actually apply to large angular displacements.
3.5. The extreme positions: two complementary views Another option would be to ignore the dependence on geo- graphical latitude altogether, and use the full angular velocity of the Earth in all applications. At mid-latitudes, that would result in an extraneous factor of about公2, not influencing any conclu- sions significantly. Although this approach would lift the burden of angular velocity vectors, it would also have its shortcomings from a didactic point of view. It would circumvent the consider- ation of the extreme positions on the Earth and would not deliver the conclusions that distinguish between the poles and the Equa- tor.
The separate treatment of angular velocity components not only shows that ⍀V = 0 in(2)results in the absence of Coriolis deflection in a horizontal plane at the Equator, revealing why the original video is cheating, but also helps explain the behaviour of Foucault’s pendulum. It becomes clear why it took more than one day to turn around and reveals that it would not have turned around at all, had Foucault set it up on the Equator instead of in Paris.
While everyone knows Foucault’s historic experiment provid- ing the first direct evidence for the rotation of the Earth, illus- Fig. 2. The expected deflection (right panel) of the initial, radially
inward flow (left panel) for⍀> 0 (northern hemisphere) provided only the Coriolis force acts. This deflection is not perceivable in the case of a household scale drain because of the presence of other forces (e.g., the ones resulting from surface waves). [Colour online.]
Fig. 3. The angular velocity vector of the Earth and its vertical and horizontal components at latitude.
Can. J. Phys. Downloaded from www.nrcresearchpress.com by Ákos Szeidemann on 08/13/20 For personal use only.
trated by a multitude of videos and simulations available on the internet (see e.g., ref.2), it is instructive to show another historic experiment that is much less widely known. Owing to the hori- zontal component⍀H(always pointing to the north), all eastward moving objects will experience an upward Coriolis force, mak- ing them slightly lighter, while westward moving objects will become somewhat heavier. This phenomenon is known as the Eötvös effect.
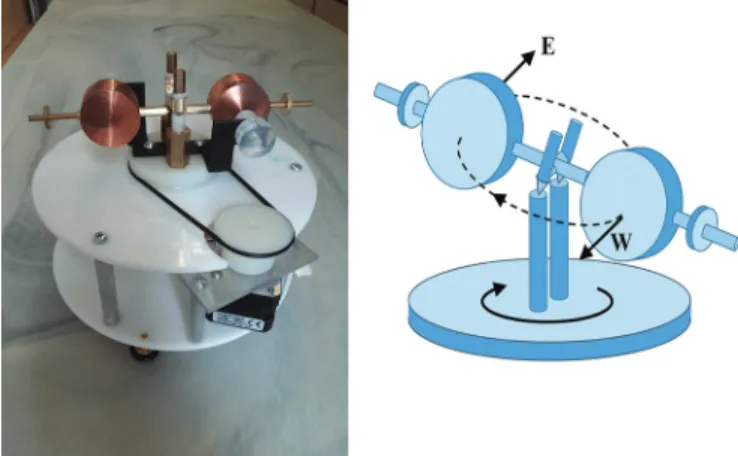
Hungarian physicist Loránd Eötvös2(1848–1919) is best known for his gravitational measurements with torsional balances, in- cluding the demonstration of the equivalence of inertial and grav- itational mass with a precision improved by two orders of magnitude, as well as the invention of a method of mapping grav- itational anomalies, to be used worldwide in search of natural oil and gas [17]. The device, generally known as “the Eötvös balance”, is the torsion balance used in the anomaly mapping. A rotating Eötvös balance (Fig. 4, left panel) making use of the Eötvös effect to demonstrate the rotation of the Earth is a totally different device.
The rotating balance consists of a barbell-shaped structure mounted on a rotating platform. As the weights turn around, whenever one weight is moving to the east, the other is moving to the west, and then they switch roles. Thus, the pair of vertical Coriolis forces acting on them gives rise to a net torque applied periodically, and the axis is tilted at a constant angle (Fig. 4, right panel).
The teaching material lays emphasis on the distinction between extreme positions on the Earth. It helps students realize that the Eötvös effect is strongest at the Equator and does not change sign there. Thus, if the demonstration in the original video used the rotating balance instead of draining water, it would be a true demonstration of the Earth’s rotation, though crossing the Equa- tor would not make any difference. In comparison, Foucault’s pendulum would not rotate at all at the Equator, but would rotate the fastest at the pole, where the Eötvös effect is not present. The two effects, both representing weak changes on human scales, can thus be viewed as complements of each other. However, there is an important difference between the two effects: while the strength of the Coriolis deflection increases with extension in
space, the strength of the Eötvös effect, estimated by the expres- sion 2⍀HU/g, is independent of the sizeL.
4. The main message: size makes a difference
The transition to large-scale (horizontal) motions of the atmo- sphere and oceans involves another step of generalization that needs to be communicated to students. When considering (2), they can observe that the relevance of the Coriolis deflection in- creases with size, therefore these motions are heavily dominated by the Coriolis force. However,(2)was obtained from(1), which was developed by considering the ratio of the deflectionDto the distanceLcovered by the object, and the reasoning made use of the assumption thatDwas small in comparison toL. Therefore, to understand large-scale motions, it is essential to convey to the reader the idea that the quantity
S⫽⍀VL
U (3)
whereUandLrepresent typical speed and size, respectively, re- mains to be a characteristic measure of the significance of the Coriolis deflection in a particular phenomenon even though it can no longer be equated withD/L. The Coriolis deflection is strong if Dis comparable toL(i.e., if quantity(3)is on the order of unity, or larger).3
The material then continues with large-scale phenomena on the rotating Earth. Cyclones are low-pressure systems. Since pres- sure is low at the centre, the pressure difference drives air in- wards, and there is upwelling in the middle (causing rainy weather). Since students are interested in the behaviour of drains, we can use that as an analogy and say that a cyclone is an “inverted drain” (Fig. 5). The value of(3)obtained for a typical cyclone is about 5, which is a result five orders of magnitude larger than it was in the case of a plughole vortex. This explains that a house- hold plughole vortex only 10 cm across may be found to rotate in any direction, while the gigantic inverted plughole constituted by the cyclone 1000 km across will consistently rotate counterclock- wise on the north, and clockwise on the south. In a cyclone, the flow in a horizontal plane at ground level is always as sketched in Fig. 2, as also seen inFig. 5.
By substituting the parameters of their rotating paper disk ex- periment in expression(3), students typically get a value near 1.6, showing that the Coriolis effect was strong in the experiment.
As a new feature of the material, a section has been added on experiments with liquids modelling strong Coriolis deflection in a laboratory [18,19]. It is instructive to see that by setting the pa- rameters (angular velocity, size, speed of flow) of the system to make the strength of the Coriolis deflection match the strength characteristic of atmospheric phenomena, one can observe anal- ogous phenomena in rotating tanks (Fig. 6). Even climate change can be simulated with such simple technology [20].
To support knowledge transfer between subjects, an inter- disciplinary teaching material should link to geography and envi- ronmental issues (e.g., to weather maps that students may have seen in forecasts on television or on web pages, such as ref.21).
Cyclones/anticyclones are easily identified in pressure maps: they are marked with a letter L (for “low”)/H (for “high”) surrounded by closed curves.
Some pressure maps also display wind speed and direction (as in ref.21). It is a general belief, based on everyday observations, that currents flow from high pressure towards low pressure. This
2With UNESCO, the year 2019 was declared Eötvös year in Hungary.
3Research literature (see, e.g., ref.1) uses the so-called Rossby number, Ro⫽ U 2⍀L⫽ 1
2Sto characterize the importance of the Coriolis deflection, a number smaller than unity for strong Coriolis effects.
Fig. 4. Left panel: A rotating Eötvös balance (made of copper) used in high school demonstrations. Right panel: Schematic diagram of the rotating balance in operation. [Colour online.]
Can. J. Phys. Downloaded from www.nrcresearchpress.com by Ákos Szeidemann on 08/13/20 For personal use only.
could be reasonable since atmospheric motions are initiated by the pressure differences brought about by the uneven heating of the surface; however, pressure maps reveal that wind tends to blow at right angles to the direction of the pressure drop. Since we do not experience the Coriolis effect directly in our daily routine, its consequences appearing in large-scale motions often appear counterintuitive.
The explanation for wind direction requires the understanding that although atmospheric motions are initiated by pressure dif- ferences, the resulting wind patterns persisting for long times indicate approximately equilibrium situations (Fig. 7) where the force arising from the pressure difference is balanced by the Co- riolis force. Since the Coriolis force acts sideways on the moving air, so must the pressure force.
The intermediate quiz given to students testing the material also contained questions concerning wind direction and the sense of rotation of cyclones and anticyclones in either hemisphere of the Earth. As the answers turned out to be heavily dependent on facts recalled from geography class, these questions proved to assess interdisciplinary knowledge rather than the knowledge ac- quired from this material. Direct feedback on this part of the material requires a question on a phenomenon that does not appear in the geography curriculum. The balance of forces in Fig. 7, as applied to ocean currents instead of atmospheric mo- tions, has a surprising consequence: the pressure difference bal- ancing the Coriolis force arises from a difference in depth, therefore the ocean surface above the currents is tilted in the direction opposite to that of the flow (see, e.g., ref.22). The present version of the material contains a question on the tilt of the water surface as well.
While intermediate quizzes were delivered to students on pa- per, now the questions have been incorporated in the material. At the end of each of the three main sections, users are provided immediate feedback, including the correct answer where a ques- tion is answered incorrectly.
5. Conclusion
However natural it is becoming for students and teachers alike to search the internet whenever in need of teaching or learning resources, very few of these resources support independent learn- ing in sufficient depth. The physics of large-scale environmental processes appears to represent a gap to be filled.
The material is not only suitable for independent learning, teachers may also use it as a resource. In the case of assisted
classroom treatment, the three sections of the core material can be completed with regular secondary school students within three standard 45-minute teaching periods. After introducing the acceleration through an experiment, the core material only makes use of one very elementary formula per section, as marked (1) to (3)above, which are sufficient for quantitative conclusions.
The application of these formulae also has a novel feature in high school instruction: students become familiar with the spirit of approximate formulae and order-of-magnitude estimations.
The quantitative considerations supported by independent exper- imental activities provide a means of fighting such persistent mis- conceptions as the legend of the plughole vortex.
Furthermore, the material works towards emphasizing the in- terdisciplinary dimension of such hot topics as climate change.
Fig. 5. Schematic drawing of the air motion in a cyclone on the northern hemisphere. [Colour online.]
Fig. 6. Schematic diagram of water in a rotating tank experiment.
With a radius ofL= 10 cm, a rotation rate as low as⍀= 0.5 rad/s, and a fluid velocityU= 1 cm/s, it is easy to set exactly the same value of 5 for the strength of the Coriolis deflection,⍀L/U, as a characteristic of a cyclone. [Colour online.]
Fig. 7. Schematic diagram illustrating the wind direction in weather maps in the northern hemisphere. The wind velocity (v) is perpendicular to the Coriolis force, which is in approximate balance with the pressure forceF. Thus, the wind blows parallel to the lines of constant pressure, with higher pressure on the right in the northern hemisphere. [Colour online.]
Can. J. Phys. Downloaded from www.nrcresearchpress.com by Ákos Szeidemann on 08/13/20 For personal use only.
While the environmental processes discussed by this material do not normally appear in physics curricula, they do appear in all geography or earth science courses. It is important for students to realize that there are physical laws in the background of phenom- ena associated with other disciplines.
In addition to the multiple-choice quizzes to give feedback on the understanding of the concepts and principles involved, stu- dents participating in the testing of the material were also given the opportunity to add any comments or suggestions they wished.
The majority of the students found the topic interesting, and some of them pointed out that they would prefer more detailed explanations.
However useful their contribution has been for us, the total number of students (51) testing the material at various stages of development was small. Although we are open to further sug- gestions for improvement, we believe the development of the material has now reached a point where it is ready for wider application with a larger number of students. They need to be given pre-tests and post-tests, and their progress needs to be mon- itored by teachers, which is a task for the future. Our experience shows that the material is welcome by secondary school students and can be effectively used in both assisted and individual learning.
Acknowledgements
Useful discusssions with I.M. Jánosi and M. Vincze on the exper- imental investigation of environmental flows in the von Karman Laboratory are acknowledged. This study was funded by the Con- tent Pedagogy Research Program of the Hungarian Academy of Sciences. This work was also supported by the Hungarian Re- search, Development and Innovation Office—NKFIH under grant K-125171.
References
1. G.K. Vallis.Essentials of atmospheric and oceanic dynamics. Cambridge University Press, Cambridge (2019).
2. Foucault pendulum [online]. Available fromhttps://en.wikipedia.org/wiki/
Foucault_pendulum. [Accessed 10 April 2020.]
3. From the motion on carousels to cyclones and the Gulf Stream: a guided tour full of surprises—an interactive material for secondary school students for assisted or individual learning. Available fromhttp://theorphys.elte.hu/
fiztan/Coriolis. [Accessed 10 April 2020.]
4. Available fromhttp://www.karman.elte.hu/index_eng.php. [Accessed 10 April 2020.]
5. Coriolis force [online]. Available fromhttps://www.britannica.com/science/
Coriolis-force. [Accessed 10 April 2020.]
6. Coriolis force: an artifact of the Earth’s rotation [online]. Available from ww2010.atmos.uiuc.edu/(Gh)/guides/mtr/fw/crls.rxml. [Accessed 10 April 2020.]
7. Coriolis effect activity. Available fromhttps://serc.carleton.edu/teachearth/
activities/181248.html. [Accessed 10 April 2020.]
8. H. Goldstein, C. Poole, and J. Safko.Classical mechanics. 3rd ed. Addison Wesley, San Francisco (2002).
9. S.T. Thornton and J.B. Marion.Classical dynamics of particles and systems. Brooks Cole (2003).
10. N.A. Phillips. Bull. Am. Met. Soc.81, 299 (2000). doi:10.1175/1520-0477(2000) 081<0299:AEOTCE>2.3.CO;2.
11. A. Persson. ICHM Hist. Meteorol.2, 1 (2005).
12. A. Persson. Q.J.R. Meteorol. Soc.141, 1957 (2015). doi:10.1002/qj.2477.
13. Design-Based Research Collective. Educational Researchers,32, 5 (2003). doi:
10.3102/0013189X032001005.
14. Mr. Aubrey explaining how to demonstrate Coriolis Effect [online]. Available fromhttps://www.youtube.com/watch?v=7DVL0ugj1O4. [Accessed 10 April 2020.]
15. Jamie McCaughty Demo video on Coriolis Effect [online]. Available from https://www.youtube.com/watch?v=LWv-eWLDn_A. [Accessed 10 April 2020.]
16. Coriolis Effect Demonstration [online]. Available fromhttps://www.youtube.
com/watch?v=Kk7sXkzmtp0[Accessed 10 April 2020.]
17. Roland Eötvös (1848–1919) [online]. Available fromhttps://eotvos100.hu/en/
page/eotvos-elet[Accessed 10 April 2020.]
18. J. Marshall and R.A. Plumb.Atmosphere, ocean and climate dynamics: an introductory text. Elsevier, Amsterdam (2008).
19. J. Marshall and R.A. Plumb. Atmosphere, ocean and climate dynamics [on- line]. Available fromhttp://marshallplumb.mit.edu/experiments[Accessed 10 April 2020.]
20. M. Vincze. Modeling climate change in the laboratory. In: A. Király and T. Tél, editors.Teaching Physics Innovatively, PhD School of Physics, Eötvös University, Budapest, pp. 107–118 (2016).
21. Available fromhttps://wordpress.accuweather.com/wp-content/uploads/2017/01/
drawing-a-surface-weather-map-arizonaedu.jpg?w=632[Accessed 12 June 2020.]
22. A. Gróf.From pressure maps and wind velocity to northern lights and other fascinating phenomena on the rotating earth, preprint (2019).
![Fig. 5. Schematic drawing of the air motion in a cyclone on the northern hemisphere. [Colour online.]](https://thumb-eu.123doks.com/thumbv2/9dokorg/785519.36422/6.918.92.428.144.421/schematic-drawing-motion-cyclone-northern-hemisphere-colour-online.webp)
