Article
Preparation of TiO 2 /WO 3 /C/N Composite Nanofibers by
Electrospinning Using Precursors Soluble in Water and Their Photocatalytic Activity in Visible Light
Vincent Otieno Odhiambo1,* , Chra Rasool M. Mustafa1 , Le Ba Thong1 , Zoltán Kónya2 , Csaba Cserháti3 , Zoltán Erdélyi3, István Endre Lukác4and Imre Miklós Szilágyi1,*
Citation: Odhiambo, V.O.; Mustafa, C.R.M.; Thong, L.B.; Kónya, Z.;
Cserháti, C.; Erdélyi, Z.; Lukác, I.E.;
Szilágyi, I.M. Preparation of TiO2/ WO3/C/N Composite Nanofibers by Electrospinning Using Precursors Soluble in Water and Their Photocatalytic Activity in Visible Light.Nanomaterials 2021,11, 351. https://doi.org/
10.3390/nano11020351
Received: 15 December 2020 Accepted: 25 January 2021 Published: 1 February 2021
Publisher’s Note:MDPI stays neutral with regard to jurisdictional claims in published maps and institutional affil- iations.
Copyright: © 2021 by the authors.
Licensee MDPI, Basel, Switzerland.
This article is an open access article distributed under the terms and conditions of the Creative Commons Attribution (CC BY) license (https://
creativecommons.org/licenses/by/
4.0/).
1 Department of Inorganic and Analytical Chemistry, Budapest University of Technology and Economics, Szent Gellért tér 4., H-1111 Budapest, Hungary; chra.rasool@yahoo.com (C.R.M.M.);
kenty9x@gmail.com (L.B.T.)
2 Department of Applied and Environmental Chemistry, University of Szeged, Rerrich Béla tér 1., H-6720 Szeged, Hungary; konya@chem.u-szeged.hu
3 Department of Solid-State Physics, Faculty of Sciences and Technology, University of Debrecen, Bem ter 18/b, H-4026 Debrecen, Hungary; cserhati.csaba@science.unideb.hu (C.C.); zoltan.erdelyi@science.unideb.hu (Z.E.)
4 Research Institute for Technical Physics and Materials Science, Hungarian Academy of Sciences, Konkoly Thege M.út 29-33., H-1121 Budapest, Hungary; lukacs.istvan@energia.mta.hu
* Correspondence: vincent.odhiambo@mail.bme.hu (V.O.O.); imre.szilagyi@mail.bme.hu (I.M.S.)
Abstract:Extending the absorption range of TiO2nanofibers to visible light is a great improvement of the photocatalytic property of TiO2. In this study, TiO2/WO3/C/N nanofibers were prepared by elec- trospinning using precursors soluble in water then annealing in argon. Titanium(IV) bis(ammonium lactato)dihydroxide (TiBALDH) and ammonium metatungstate (AMT) were used as the precursor for TiO2and WO3respectively. Different volume ratios of the precursors were added to a solution of PVP before electrospinning. The fibers were studied by XPS, SEM-EDX, TEM, FTIR, XRD, Raman spectroscopy and UV–VIS diffuse reflectance spectroscopy (DRS). The photocatalytic degradation of methylene blue by the fibers in visible light was investigated. The fibers had anatase TiO2and monoclinic WO3. Based on UV–VIS DRS and Kubelka-Munk function the fibers could absorb visible light. Moreover, 100% TiBALDH had an indirect band gap of 2.9 eV, and the band gap decreased with increase in AMT, i.e., for 0% TiBALDH, band gap was 2.4 eV. The fibers degraded methylene blue dye in visible light, and 90% TiBALDH had the highest photocatalytic activity, i.e., it degraded 40% of the dye after 240 min.
Keywords:electrospinning; TiO2precursor soluble in water; composite nanofibers; photocatalysis
1. Introduction
Photocatalytic reactions are advanced reduction and oxidation process widely used in water and cleansing systems, self-cleaning of surfaces, hydrogen production, and photoelec- trochemical reactions [1–3]. TiO2,a heterogeneous photocatalyst, has been demonstrated to effectively degrade organic pollutants in the environment into products such as CO2
and H2O. However, it has a significant setback of high bandgap that makes it utilize only UV light during photocatalysis, also photogenerated electron–hole pairs recombine very fast [4–7]. Many studies have been done to prepare high-performance TiO2catalysts by making nanostructure composites of TiO2with noble metals and other semiconductor oxides like WO3[8–10]. Coupling TiO2-based nanofibers with heteroatom dopants lead to extra energy levels in the TiO2band gap that allows for the absorption of visible light photons [11]. TiO2/WO3and TiO2/carbon composites have been widely reported to have a lower band gap and reduced charge recombination rate. This improves photocatalytic degradation efficiency and charge transfer characteristics of the catalyst [12,13]. Nitrogen is
Nanomaterials2021,11, 351. https://doi.org/10.3390/nano11020351 https://www.mdpi.com/journal/nanomaterials
Nanomaterials2021,11, 351 2 of 12
a preferred nonmetal dopant of TiO2; it has low ionization energy, its atomic size is similar to oxygen, and it substitutes oxygen in the base lattice [14].
In several studies, different synthesis methods are combined to prepare TiO2-based composite photocatalysts. While this approach tries to maximize each method’s advan- tages, it will increase the number of procedures spent preparing the composite photocat- alyst [15–17]. The challenge of improving TiO2photocatalytic activity in a cost-efficient way justifies the need for further studies in this field [18]. Electrospinning is a simple and adaptable procedure used to prepare long fibers with diameters in the range of tens to hundreds of nanometers for application in many fields [19–22].
Zhao et al. coupled self-assembly of polystyrene-block-poly(ethylene oxide)-containing titanium-tetraisopropoxide and tungsten hexaphenoxide with electrospinning technique to fabricate hierarchically porous TiO2/WO3composite nanofibers [23]. Simsek et al. synthe- sized TiO2/WO3/carbon composite for enhanced photocatalytic performance by controlled carbonization of a cellulosic precursor and solvothermal synthesis [24]. Hu et al. prepared TiO2/WO3nanofibers coated with carbon by combining the electrospinning process with hydrothermal synthesis for enhanced hydrogen catalytic production [25]. Choi et al. re- ported fabricating TiO2/WO3-based films doped with chlorine or nitrogen for self-cleaning glass applications by a sol–gel spin coating method using HCl and HNO3[26]. Lee et al.
successfully synthesized WO3–N–TiO2nanosheets using a combined sonochemical impreg- nation procedure for the photocatalytic treatment of harmful organic vapor [27]. Gao et al.
synthesized TiO2-N-x%WO3nanoparticles by synthesizing nitrogen-doped TiO2powder using hydrolysis of TiCl4by ammonia and then introducing WO3into them by forming suspension with tungstic acid; the suspension was dried and then thermally treated. The composite nanoparticles had a more significant photocatalytic property than TiO2and nitrogen-doped TiO2in UV and visible light [28]. There are no reports of preparation of TiO2/WO3/C/N composite nanofibers by electrospinning using precursors of TiO2and WO3that dissolve in water.
Previously, we used electrospinning and precursors soluble in water to prepare TiO2/WO3 composite nanofibers and demonstrated that conditions of heat treatment influenced the nanofibers’ final composition [29]. When the fibers are annealed in inert conditions, the polymer decomposes without undergoing combustion. The semiconductor oxides are formed within the resulting carbon matrix [30].
In this study, TiO2/WO3/C/N composite nanofibers were prepared by electrospin- ning and annealing in argon. Water-soluble titanium(IV) bis(ammonium lactato)dihydroxide (TiBALDH) was the precursor for TiO2, while ammonium metatungstate (AMT) was the source of WO3. C and N are in the amorphous char material, which is the polymer’s residue after annealing in argon. The fibers were studied by XPS, SEM-EDX, TEM, FTIR, X-ray diffraction, Raman spectroscopy, and diffuse reflectance UV–VIS spectroscopy. The rate of the fibers to catalytically degrade methylene blue in visible light was investigated.
2. Materials and Methods
2.1. Synthesis of N Doped TiO2/WO3/C Nanofibers
Chemicals were of analytical grade, acquired from Sigma Aldrich (Budapest, Hun- gary) and used as obtained. The fibers were prepared by electrospinning. Titanium(IV) bis(ammonium lactato)dihydroxide (TiBALDH) solution was added to an aqueous solution of (ammonium metatungstate) AMT in different volume ratios (100%, 90%, 50%, 10%, and 0%). Then, 2 mL of this mixture was added to 2 mL of a polymer solution made by adding 0.5 mg polyvinylpyrrolidone (PVP) in a solution of ethanol and acetic acid in equal volume ratio. The mixture was stirred for 8 h at room temperature before electrospinning using a voltage of 20 kV and an intrusion rate of 1 mLh−1. The distance of the collector from the needle tip was 12 cm. The electrospun fibers were thermally treated in argon at 60◦C per hour till 600◦C.
2.2. Characterization of the Nanofibers
The surface morphologies and composition of the nanofibers were investigated by X-ray photoelectron spectrometer (XPS) (Phoibos, Berlin, Germany), scanning electron microscope (SEM) (JEOL Ltd., Tokyo, Japan) coupled with energy-dispersive X-ray spec- trometer (EDX) (JEOL Ltd., Tokyo, Japan), and transmission electron microscope (TEM) (JEOL Ltd, Tokyo, Japan). SPECS X-ray photoelectron spectrometer (Berlin, Germany) fitted with a dual anode X-ray source, XR-50, and a PHOIBOS 150 energy analyzer (Berlin, Germany) was used to obtain the XPS spectra. Powdered samples were pressed onto indium foil for mounting. For the measurements, Al KαX-ray source was operated with 150 W (14 kV). Survey spectra were acquired using 1 eV step size and 40 eV of pass energy.
High-resolution spectra were acquired with a step size of 0.1 eV and a pass energy of 20 eV.
All high-resolution spectra were charge corrected considering the C-C peak of the C 1 s spectrum to be at 284.8 eV [31]. The number of scans varied between 10 and 25. SEM-EDX measurements were done using a JEOL JSM-5500LV scanning electron microscope (JEOL Ltd., Tokyo, Japan) in a high vacuum mode. TEM measurements of the annealed fibers were done by sonicating the fibers in ethanol for 10 min, and then the liquids containing the fibers dropped onto a C-coated TEM grid. JEOL 200 FX-II transmission electron mi- croscope (JEOL Ltd., Tokyo, Japan) was used for producing bright-field images from the different fibers.
Attenuated total reflection Fourier-transform infrared spectroscopy (ATR-FTIR) mea- surements of electrospun and annealed nanofibers were done using a Bruker Tensor 37 with a Specac Golden Gate ATR accessory (Billerica, MA, USA).
X-ray diffraction patterns were collected by a PANalytical X’Pert Pro MPD X-ray diffractometer (PANalytical, Almelo, Nerthalands) using Cu Kαirradiation. Raman spectra were obtained using a Jobin Yvon LabRAM Raman spectrometer (Horiba, Kyoto, Japan) equipped with an Olympus BX41 microscope (Olympus, Tokyo, Japan. The radiation source was Nd-YAG laser (Tokyo, Japan) operating at 532 nm.
UV–VIS DRS of the fibers were measured by AvaSpec 2048 with a Fiber Optic Spec- trophotometer (Avantes BV, Apeldoorn, Netherlands) between 250 and 800 nm. The fibers’
optical band gap energy was determined using absorption edge from UV–VIS DRS and Tauc plots.
2.3. Photocatalysis in Visible Light
For this, 1.0 mg of the nanofibers was added to a 3 mL aqueous solution of methylene blue dye with a concentration of 0.0126 g/L in a quartz cuvette. To obtain adsorption equi- librium, the samples were put overnight in a dark place. The photocatalytic degradation of methylene blue after exposure to visible light was investigated by recording the absorbance of the peak at 664 nm for every 30 min for 4 h using a Jasco V-550 UV–VIS spectrometer (Jasco, Tokyo, Japan).
3. Results and Discussion
XPS spectra of the fibers after heat treatment in argon are presented in Figures1and2.
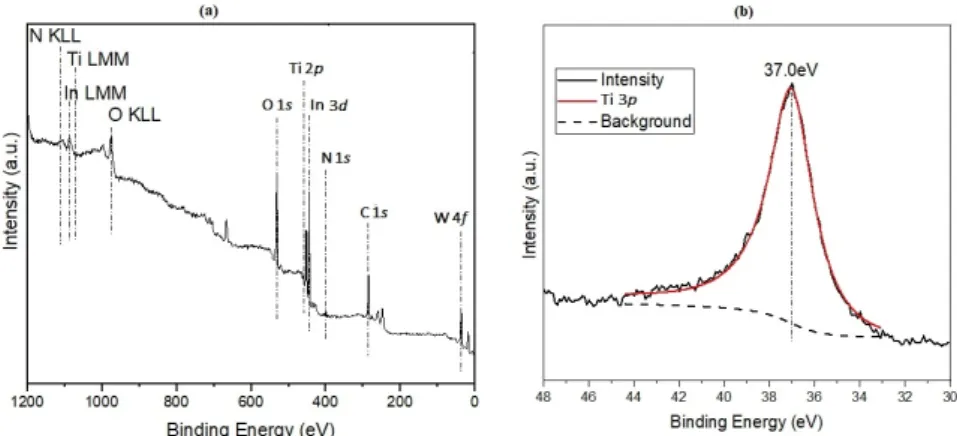
Figure1a is a survey spectrum of the 50% TiBALDH composite fibers. Based on the spectrum, the following elements were detected: C, O, Ti, W, and N; their main regions are marked on the survey spectra. The N 1speak around 400 eV can be attributed to substitution of oxygen in the base lattice by nitrogen to form N-Ti-O [11]. Due to the use of In foil, In was also identified. Figure1b shows the Ti 3pspectrum obtained from 100%
TiBALDH fibers. Since the Ti 3pspectrum region overlaps the W 4f spectrum region, this Ti 3ppeak shape was used to precisely distinguish between the two elements.
Figure2a shows the Ti 2pXPS spectrum of the composite fibers. For all of the XPS signals, the Ti2P1/2peak was observed at 464.3 eV, while the Ti2P3/2peak was observed at 458.7 eV; this was consistent with Ti4+ [32,33]. According to Figure2b, for all the composite fibers, W4f7/2 peaks had binding energy of 35.3 eV, while W4f5/2 peaks had 37.5 eV characteristic of W+6coordinated by oxygen atoms [34]. The relative intensities of
Nanomaterials2021,11, 351 4 of 12
the elements were used to calculate the surface concentration of the various elements in the fibers. The result was further corroborated with SEM-EDX. Table1shows the elemental composition of the annealed fibers from XPS and EDX data. The Ti/W based on the atomic percent was different from the volume ratios of the precursors; 90% TiBALDH had Ti/W of 3.5, 50% TiBALDH had Ti/W of 0.31, and 10% TiBALDH had Ti/W of 0.22. This is because although TiBALDH contains only 16% titanium, AMT contains 30% tungsten. The high amount of carbon in the samples can be due to carbon formation within the fibers’ structure because of the decomposition of the as-spun fibers without combustion. Nitrogen is also in the carbon matrix formed when the as-spun fibers’ polymer part is pyrolyzed.
Nanomaterials 2021, 11, x FOR PEER REVIEW 4 of 14
Figure 1. (a) XPS survey spectrum of 50% TiBALDH fibers and (b) Ti 3p XPS spectrum of 100% TiBALDH fibers.
Figure 1. (a) XPS survey spectrum of 50% TiBALDH fibers and (b) Ti 3pXPS spectrum of 100%
TiBALDH fibers.
Nanomaterials 2021, 11, x FOR PEER REVIEW 5 of 14
Figure 2. (a) Ti 2p XPS spectrum of composite fibers and (b) W 4f spectrum of composite fibers.
Figure 2a shows the Ti 2p XPS spectrum of the composite fibers. For all of the XPS signals, the Ti2P1/2 peak was observed at 464.3 eV, while the Ti2P3/2 peak was observed at 458.7 eV; this was consistent with Ti4+ [32,33]. According to Figure 2b, for all the composite fibers, W4f7/2 peaks had binding energy of 35.3 eV, while W4f5/2 peaks had 37.5 eV charac- teristic of W+6 coordinated by oxygen atoms [34]. The relative intensities of the elements were used to calculate the surface concentration of the various elements in the fibers. The result was further corroborated with SEM-EDX. Table 1 shows the elemental composition of the annealed fibers from XPS and EDX data. The Ti/W based on the atomic percent was different from the volume ratios of the precursors; 90% TiBALDH had Ti/W of 3.5, 50%
TiBALDH had Ti/W of 0.31, and 10% TiBALDH had Ti/W of 0.22. This is because although TiBALDH contains only 16% titanium, AMT contains 30% tungsten. The high amount of carbon in the samples can be due to carbon formation within the fibers’ structure because of the decomposition of the as-spun fibers without combustion. Nitrogen is also in the carbon matrix formed when the as-spun fibers’ polymer part is pyrolyzed.
Figure 2.(a) Ti 2pXPS spectrum of composite fibers and (b) W 4fspectrum of composite fibers.
Table 1. Elemental composition of the annealed fibers based on XPS and energy-dispersive X-ray (EDX).
Sample C O Ti W N
At%
100%
TiBALDH
XPS 35.3 52.4 10.3 2.0
EDX 30.1 47.2 18.2 4.5
90%
TiBALDH
XPS 24.9 57.6 11.7 3.5 2.3
EDX 40.4 44.2 6.3 1.0 8.1
50%
TiBALDH
XPS 50.7 38.0 1.5 4.8 5.0
EDX 22.1 51.8 9.6 14.5 2.0
10%
TiBALDH
XPS 28.7 54.7 2.8 12.6 1.2
EDX 21.1 41.8 1.3 34.7 1.1
0%
TiBALDH
XPS 30.0 52.5 15.9 1.6
EDX 14.2 42.5 41.7 1.6
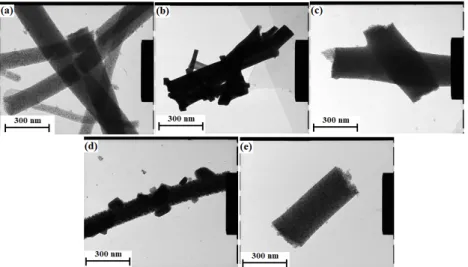
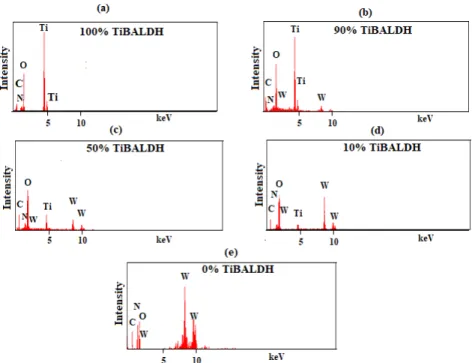
Figures3and4are images of the samples after annealing obtained by SEM and TEM, respectively. The images show that the samples were fibrous. The diameter of the samples increased with a decrease in the amount of TiBALDH. Further, 100% TiBALDH fibers had a diameter of between 150 and 200 nm, while 0% TiBALDH fibers had a diameter of between 300 and 400 nm. The EDX spectra and elemental composition of the samples are shown in Figure5. The spectra confirmed the presence of C, N, O, Ti, and W in the composite fibers.
Nanomaterials 2021, 11, x FOR PEER REVIEW 6 of 14
Table 1. Elemental composition of the annealed fibers based on XPS and energy-dispersive X-ray (EDX).
Sample C O Ti W N
At%
100% Ti- BALDH
XPS 35.3 52.4 10.3 2.0 EDX 30.1 47.2 18.2 4.5 90% TiBALDH XPS 24.9 57.6 11.7 3.5 2.3 EDX 40.4 44.2 6.3 1.0 8.1 50% TiBALDH XPS 50.7 38.0 1.5 4.8 5.0 EDX 22.1 51.8 9.6 14.5 2.0 10% TiBALDH XPS 28.7 54.7 2.8 12.6 1.2 EDX 21.1 41.8 1.3 34.7 1.1 0% TiBALDH XPS 30.0 52.5 15.9 1.6 EDX 14.2 42.5 41.7 1.6
Figures 3 and 4 are images of the samples after annealing obtained by SEM and TEM, respectively. The images show that the samples were fibrous. The diameter of the samples increased with a decrease in the amount of TiBALDH. Further, 100% TiBALDH fibers had a diameter of between 150 and 200 nm, while 0% TiBALDH fibers had a diameter of be- tween 300 and 400 nm. The EDX spectra and elemental composition of the samples are shown in Figure 5. The spectra confirmed the presence of C, N, O, Ti, and W in the com- posite fibers.
Figure 3. SEM photographs of fibers after annealing: (a) 100% TiBALDH, (b) 90% TiBALDH, (c) 50% TiBALDH, (d) 10%
TiBALDH, and (e) 0% TiBALDH. Figure 3.SEM photographs of fibers after annealing: (a) 100% TiBALDH, (b) 90% TiBALDH, (c) 50%
TiBALDH, (d) 10% TiBALDH, and (e) 0% TiBALDH.
Nanomaterials 2021, 11, x FOR PEER REVIEW 7 of 14
Figure 4. TEM photographs of fibers after annealing: (a) 100% TiBALDH, (b) 90% TiBALDH, (c) 50% TiBALDH, (d) 10%
TiBALDH, and (e) 0% TiBALDH.
Figure 5. Energy-dispersive X-ray (EDX) spectra of the annealed fibers: (a) 100% TiBALDH, (b) 90% TiBALDH, (c) 50% TiBALDH, (d) 10% TiBALDH, and (e) 0% TiBALDH.
Fourier-transform infrared spectra obtained before and after annealing the fibers are presented in Figure 6. The as-spun fibers have peaks between 3500 and 3200 cm−1 that can result from O-H stretching bonds from water and N-H stretching bonds from AMT [35].
The peak observed at about 2900 cm−1 is due to C-H vibrations from TiBALDH and PVP.
Vibrations by C=O bonds were observed at about 1700 cm−1 [36]. -CH bending bonds of CH2 were observed around 1470 cm−1,while C-O stretching bonds of PVP were observed
Figure 4.TEM photographs of fibers after annealing: (a) 100% TiBALDH, (b) 90% TiBALDH, (c) 50%
TiBALDH, (d) 10% TiBALDH, and (e) 0% TiBALDH.
Nanomaterials2021,11, 351 6 of 12
Nanomaterials 2021, 11, x FOR PEER REVIEW 7 of 14
Figure 4. TEM photographs of fibers after annealing: (a) 100% TiBALDH, (b) 90% TiBALDH, (c) 50% TiBALDH, (d) 10%
TiBALDH, and (e) 0% TiBALDH.
Figure 5. Energy-dispersive X-ray (EDX) spectra of the annealed fibers: (a) 100% TiBALDH, (b) 90% TiBALDH, (c) 50% TiBALDH, (d) 10% TiBALDH, and (e) 0% TiBALDH.
Fourier-transform infrared spectra obtained before and after annealing the fibers are presented in Figure 6. The as-spun fibers have peaks between 3500 and 3200 cm−1 that can result from O-H stretching bonds from water and N-H stretching bonds from AMT [35].
The peak observed at about 2900 cm−1 is due to C-H vibrations from TiBALDH and PVP.
Vibrations by C=O bonds were observed at about 1700 cm−1 [36]. -CH bending bonds of CH2 were observed around 1470 cm−1,while C-O stretching bonds of PVP were observed
Figure 5.Energy-dispersive X-ray (EDX) spectra of the annealed fibers: (a) 100% TiBALDH, (b) 90%
TiBALDH, (c) 50% TiBALDH, (d) 10% TiBALDH, and (e) 0% TiBALDH.
Fourier-transform infrared spectra obtained before and after annealing the fibers are presented in Figure6. The as-spun fibers have peaks between 3500 and 3200 cm−1that can result from O-H stretching bonds from water and N-H stretching bonds from AMT [35]. The peak observed at about 2900 cm−1is due to C-H vibrations from TiBALDH and PVP. Vibrations by C=O bonds were observed at about 1700 cm−1[36]. -CH bending bonds of CH2were observed around 1470 cm−1, while C-O stretching bonds of PVP were observed between 1250 and 1200 cm−1. The spectra of the annealed fibers showed the presence of some functional groups. This confirmed that annealing in an inert environment did not fully decompose the polymer. The peak around 2300 cm−1can be caused by C-N stretching movements [37]. Peaks due to stretching vibrations of O-W bonds were observed at about 600 cm−1.
Nanomaterials 2021, 11, x FOR PEER REVIEW 8 of 14
between 1250 and 1200 cm−1. The spectra of the annealed fibers showed the presence of some functional groups. This confirmed that annealing in an inert environment did not fully decompose the polymer. The peak around 2300 cm−1 can be caused by C-N stretching movements [37]. Peaks due to stretching vibrations of O-W bonds were observed at about 600 cm−1.
Figure 6. FTIR spectra of fibers before and after annealing: (a) 0% TiBALDH, (b) 10% TiBALDH, (c) 50% TiBALDH, (d) 90% TiBALDH, and (e) 100% TiBALDH.
The XRD patterns of the fibers after heat treatment in argon are shown in Figure 7.
Fibers containing 100% TiBALDH had diffraction peaks characteristic of anatase TiO2 at 25.5°, 39.0°, 48.1°, 54.0°, and 63.0° assigned to (101), (112), (200), (105), and (204) planes, respectively [38,39]. Moreover, 0% TIBALDH had peaks typical of monoclinic WO3 at 23.1°, 23.5°, 24.4°, and 33.4° corresponding to (002), (020), (200), and (022) planes, respec- tively [34]. Fibers containing TiBALDH and AMT were less crystalline. Further, 90% Ti- BALDH and 10% TiBALDH had peaks for anatase TiO2 and monoclinic WO3.
Figure 6.FTIR spectra of fibers before and after annealing: (a) 0% TiBALDH, (b) 10% TiBALDH, (c) 50% TiBALDH, (d) 90% TiBALDH, and (e) 100% TiBALDH.
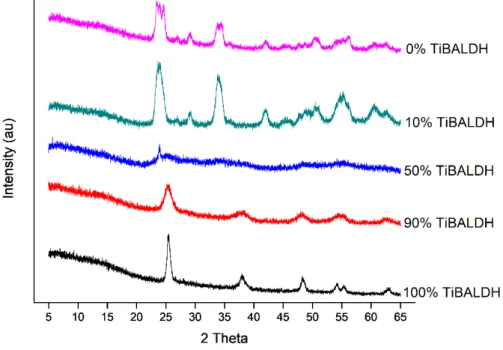
The XRD patterns of the fibers after heat treatment in argon are shown in Figure7.
Fibers containing 100% TiBALDH had diffraction peaks characteristic of anatase TiO2at 25.5◦, 39.0◦, 48.1◦, 54.0◦, and 63.0◦assigned to (101), (112), (200), (105), and (204) planes, respectively [38,39]. Moreover, 0% TIBALDH had peaks typical of monoclinic WO3at 23.1◦, 23.5◦, 24.4◦, and 33.4◦corresponding to (002), (020), (200), and (022) planes, respectively [34].
Fibers containing TiBALDH and AMT were less crystalline. Further, 90% TiBALDH and 10% TiBALDH had peaks for anatase TiO2and monoclinic WO3.
Nanomaterials 2021, 11, x FOR PEER REVIEW 9 of 14
Figure 7. XRD patterns of the fibers after annealing.
Raman spectra obtained after the fibers were annealed is shown in Figure 8. Fibers prepared from 100% TiBALDH had peaks at 144, 399, 515, and 630 cm−1 characteristic of anatase TiO2 [40]. For 0% TiBALDH, peaks around 250–330 cm−1 associated with O-W-O bending vibrations were not observed because the fibers were not highly crystalline. How- ever, the intense peaks around 710 and 801 cm−1 are Raman peaks for monoclinic WO3, which can be attributed to the O-W-O stretching vibrations [41]. Fibers containing both TiBALDH and AMT showed peaks associated with anatase TiO2 and monoclinic WO3 and broad peaks at 1350 and 1600 cm−1, assigned to D and G bands carbon, respectively [42].
Figure 7.XRD patterns of the fibers after annealing.
Raman spectra obtained after the fibers were annealed is shown in Figure8. Fibers prepared from 100% TiBALDH had peaks at 144, 399, 515, and 630 cm−1characteristic of anatase TiO2[40]. For 0% TiBALDH, peaks around 250–330 cm−1associated with O-W- O bending vibrations were not observed because the fibers were not highly crystalline.
However, the intense peaks around 710 and 801 cm−1are Raman peaks for monoclinic WO3, which can be attributed to the O-W-O stretching vibrations [41]. Fibers containing both TiBALDH and AMT showed peaks associated with anatase TiO2and monoclinic WO3and broad peaks at 1350 and 1600 cm−1, assigned to D and G bands carbon, respectively [42].
Figure9presents the diffuse reflectance UV–VIS spectra. The absorption edge of the composite fibers increased to the visible light region of the spectrum. C and nitrogen atoms in TiO2/WO3fibers allow valence electrons in the TiO2band gap to be excited at a wavelength greater than 370 nm. The increase in the excitation wavelength corresponded to the decrease in the amount of TiO2precursor. The shift in absorption edge is confirmed by the band gap of the fibers shown in Table2. The indirect band gaps were calculated by extrapolating the linear portions of Tauc plots based on the Kubelka-Munk function.
The Tau plots are shown in Figure S1. The reduction in band gap energy shows that the fibers can absorb light visible light, improving their photocatalytic efficiency. [43]. Fibers prepared from 50% TiBALDH were black and, therefore, absorbed light and did not have reflectance spectra.
NanomaterialsNanomaterials 2021, 11, x FOR PEER REVIEW 2021,11, 351 10 of 14 8 of 12
Figure 8. Raman spectra of the fibers after annealing.
Figure 9 presents the diffuse reflectance UV–VIS spectra. The absorption edge of the composite fibers increased to the visible light region of the spectrum. C and nitrogen at- oms in TiO2/WO3 fibers allow valence electrons in the TiO2 band gap to be excited at a wavelength greater than 370 nm. The increase in the excitation wavelength corresponded to the decrease in the amount of TiO2 precursor. The shift in absorption edge is confirmed by the band gap of the fibers shown in Table 2. The indirect band gaps were calculated by extrapolating the linear portions of Tauc plots based on the Kubelka-Munk function. The Tau plots are shown in Figure S1. The reduction in band gap energy shows that the fibers can absorb light visible light, improving their photocatalytic efficiency. [43]. Fibers pre- pared from 50% TiBALDH were black and, therefore, absorbed light and did not have reflectance spectra.
Figure 8.Raman spectra of the fibers after annealing.
Nanomaterials 2021, 11, x FOR PEER REVIEW 11 of 14
Figure 9. UV–VIS diffuse reflectance spectra of samples after annealing.
Table 2. Band gap values for annealed fibers.
Fibers 100% TiBALDH 90% Ti-
BALDH 10% TiBALDH 0% TiBALDH
Band gap (eV) 2.9 2.7 2.6 2.4
Figure 10 shows the photocatalytic degradation of methylene blue by the fibers in visible light. The set up for photocatalysis is shown in Figure S2 while the absorbance values recorded during the photocatalysis process are shown in Table S1. All the fibers demonstrated photocatalytic activity in visible light. Fibers with 100% TiBALDH had the least photocatalytic effect in visible light. Fibers prepared from 90% TiBALDH had the greatest degradation effect on methylene blue dye after 4 h, with a photocatalytic activity about two times better than P25 TiO2. The photocatalytic activity was also comparable to the performance of other N-containing, TiO2 photocatalysts. Choi et al. reported 80% deg- radation of methylene blue in visible light by TiO2/WO3-based films doped with nitrogen [26]. WO3-N-TiO2 nanosheets synthesized by Lee et al. degraded 43.4% of hexane vapor in visible light [27]. Combining TiO2 with WO3 and C and N allows absorption of visible light due to additional allowed energy levels in the band gap of TiO2, which decreases the rate of electron hole recombination during photocatalysis. This improves the photocata- lytic activity of TiO2. A graph of −ln(A/Ao) against time, shown in Figure S3, was used to determine the rate constants for the photocatalysis processes. The results are shown in Table 3. Fibers that showed a higher degradation rate of methylene blue had larger Kapp values.
Figure 9.UV–VIS diffuse reflectance spectra of samples after annealing.
Table 2.Band gap values for annealed fibers.
Fibers 100% TiBALDH 90% TiBALDH 10% TiBALDH 0% TiBALDH
Band gap (eV) 2.9 2.7 2.6 2.4
Figure10shows the photocatalytic degradation of methylene blue by the fibers in visible light. The set up for photocatalysis is shown in Figure S2 while the absorbance values recorded during the photocatalysis process are shown in Table S1. All the fibers demonstrated photocatalytic activity in visible light. Fibers with 100% TiBALDH had the least photocatalytic effect in visible light. Fibers prepared from 90% TiBALDH had the greatest degradation effect on methylene blue dye after 4 h, with a photocatalytic activity about two times better than P25 TiO2. The photocatalytic activity was also comparable to the performance of other N-containing, TiO2photocatalysts. Choi et al. reported 80%
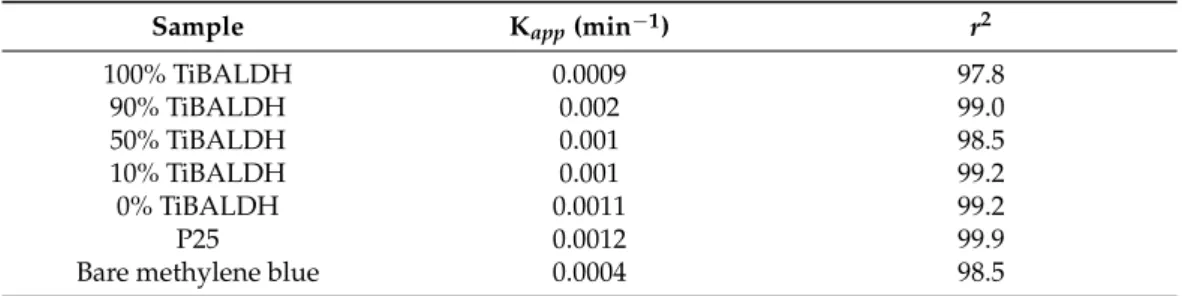
degradation of methylene blue in visible light by TiO2/WO3-based films doped with nitrogen [26]. WO3-N-TiO2nanosheets synthesized by Lee et al. degraded 43.4% of hexane vapor in visible light [27]. Combining TiO2with WO3and C and N allows absorption of visible light due to additional allowed energy levels in the band gap of TiO2, which decreases the rate of electron hole recombination during photocatalysis. This improves the photocatalytic activity of TiO2. A graph of−ln(A/Ao) against time, shown in Figure S3, was used to determine the rate constants for the photocatalysis processes. The results are shown in Table3. Fibers that showed a higher degradation rate of methylene blue had larger Kappvalues.
Nanomaterials 2021, 11, x FOR PEER REVIEW 12 of 14
Figure 10. Photocatalytic activity of annealed fibers on methylene blue in visible light.
Table 3. Values of rate constant and r2 for the photocatalysis decomposition of methylene blue under visible light.
Sample Kapp (min−1) r2
100% TiBALDH 0.0009 97.8
90% TiBALDH 0.002 99.0
50% TiBALDH 0.001 98.5
10% TiBALDH 0.001 99.2
0% TiBALDH 0.0011 99.2
P25 0.0012 99.9
Bare methylene blue 0.0004 98.5
4. Conclusions
TiO2/WO3/C/N composite nanofibers were prepared by electrospinning followed by annealing in argon. The polymer component of the fiber pyrolyzes during the annealing process to form a residue made of carbon and nitrogen. Characterization by XPS, SEM- EDX, FTIR, XRD, and Raman spectroscopy showed that C, N, Ti, and W were present in the composite fibers in different proportions. The UV–VIS DRS showed that the absorbed light at a higher wavelength than the values reported for pure TiO2 fibers. The decrease in the fibers’ band gaps showed that the photocatalytic activity of TiO2 could be improved by coupling TiO2 with WO3 and nonmetals such as carbon and nitrogen. The fiber’s C/N phase can sensitize the system to visible light and enhance the charge separation during photocatalysis. The degradation of methylene blue by the annealed fibers in visible light was studied. Fibers containing 90% TiBALDH had the highest C and N content, and they showed the most significant photocatalytic activity.
Supplementary Materials: The following are available online at www.mdpi.com/xxx/s1, Figure S1:
Tauc plots for fibers: (a) 100% TiBALDH (b) 90% TiBALDH, (c) 10% TiBALDH, and (d) 0% Ti- BALDH; Figure S2: Photocatalysis setup: a) fibers and dye allowed to stand overnight and b) mix- ture in visible light before absorption measurements are done using a Jasco V-550 UV–VIS spec- trometer; Figure S3: Apparent rate constant and r2 values for the photocatalytic degradation of meth- ylene blue in visible light; Table S1. Absorbance values for the photocatalytic process of methylene blue degradation in visible light.
Figure 10.Photocatalytic activity of annealed fibers on methylene blue in visible light.
Table 3.Values of rate constant andr2for the photocatalysis decomposition of methylene blue under visible light.
Sample Kapp(min−1) r2
100% TiBALDH 0.0009 97.8
90% TiBALDH 0.002 99.0
50% TiBALDH 0.001 98.5
10% TiBALDH 0.001 99.2
0% TiBALDH 0.0011 99.2
P25 0.0012 99.9
Bare methylene blue 0.0004 98.5
4. Conclusions
TiO2/WO3/C/N composite nanofibers were prepared by electrospinning followed by annealing in argon. The polymer component of the fiber pyrolyzes during the annealing
Nanomaterials2021,11, 351 10 of 12
process to form a residue made of carbon and nitrogen. Characterization by XPS, SEM-EDX, FTIR, XRD, and Raman spectroscopy showed that C, N, Ti, and W were present in the composite fibers in different proportions. The UV–VIS DRS showed that the absorbed light at a higher wavelength than the values reported for pure TiO2fibers. The decrease in the fibers’ band gaps showed that the photocatalytic activity of TiO2could be improved by coupling TiO2with WO3and nonmetals such as carbon and nitrogen. The fiber’s C/N phase can sensitize the system to visible light and enhance the charge separation during photocatalysis. The degradation of methylene blue by the annealed fibers in visible light was studied. Fibers containing 90% TiBALDH had the highest C and N content, and they showed the most significant photocatalytic activity.
Supplementary Materials:The following are available online athttps://www.mdpi.com/2079-4 991/11/2/351/s1, Figure S1: Tauc plots for fibers: (a) 100% TiBALDH (b) 90% TiBALDH, (c) 10%
TiBALDH, and (d) 0% TiBALDH; Figure S2: Photocatalysis setup: a) fibers and dye allowed to stand overnight and b) mixture in visible light before absorption measurements are done using a Jasco V-550 UV–VIS spectrometer; Figure S3: Apparent rate constant and r2values for the photocatalytic degradation of methylene blue in visible light; Table S1. Absorbance values for the photocatalytic process of methylene blue degradation in visible light.
Author Contributions:Conceptualization, V.O.O. and I.M.S.; methodology, V.O.O. and I.M.S.; soft- ware, L.B.T.; investigation, C.R.M.M., Z.K., C.C., Z.E, I.E.L., and V.O.O.; resources, V.O.O., I.M.S., and Z.E.; writing—original draft preparation, V.O.O.; writing—review and editing, C.R.M.M., Z.K., Z.E., L.B.T., and I.M.S.; supervision, I.M.S.; funding acquisition, I.M.S., V.O.O., and Z.E. All authors have read and agreed to the published version of the manuscript.
Funding:This research was funded by the European Union and the State of Hungary and cofinanced by the European Regional Development Fund, grant numbers NRDI K 124212 and an NRDI TNN_16 123631 within project No. VEKOP-2.3.2-16-2017-00013. The was supported by the BME Nanotech- nology and Materials Science TKP2020 IE grant of NKFIH Hungary (BME IE-NAT TKP2020). The Stipendium Hungaricum scholarship. The research was supported by the Thematic Excellence Programme (TKP2020-IKA-04) of the Ministry for Innovation and Technology in Hungary.
Institutional Review Board Statement:Not applicable.
Informed Consent Statement:Not applicable.
Data Availability Statement:The study did not report any data.
Acknowledgments:The authors wish to thank Tamas Igricz, Budapest University of Department of Organic Chemistry and Technology, for his help in Raman measurements.
Conflicts of Interest:The authors declare no conflict of interest.
References
1. Chowdhury, M.I.H.; Hossain, M.S.; Azad, M.A.S.; Islam, M.Z.; Dewan, M.A. Photocatalytic Degradation of Methyl Orange Under UV Using ZnO as Catalyst.Int. J. Sci. Eng. Res.2018,9, 1646–1649.
2. Soares, L.; Alves, A. Photocatalytic properties of TiO2 and TiO2/WO3 films applied as semiconductors in heterogeneous photocatalysis.Mater. Lett.2018,211, 339–342. [CrossRef]
3. Anderson, A.L.; Binions, R. A preferential precursor for photocatalytically active titanium dioxide thin films: Titanium bis- ammonium lactato dihydroxide as an alternative to titanium tetra iso-propoxide.Polyhedron2016,118, 81–90. [CrossRef]
4. Justh, N.; Mikula, G.J.; Bakos, L.P.; Nagy, B.; László, K.; Parditka, B.; Erdélyi, Z.; Takáts, V.; Mizsei, J.; Szilágyi, I.M. Photocatalytic properties of TiO2@polymer and TiO2@carbon aerogel composites prepared by atomic layer deposition.Carbon N. Y.2019,147, 476–482. [CrossRef]
5. Paula, L.F.; Hofer, M.; Lacerda, V.P.; Bahnemann, D.W.; Patrocinio, A.O.T. Unraveling the photocatalytic properties of TiO2/WO3 mixed oxides.Photochem. Photobiol. Sci.2019,18, 2469–2483. [CrossRef]
6. Zhang, L.; Qin, M.; Yu, W.; Zhang, Q.; Xie, H.; Sun, Z.; Shao, Q.; Guo, X.; Hao, L.; Zheng, Y.; et al. Heterostructured TiO2/WO3 Nanocomposites for Photocatalytic Degradation of Toluene under Visible Light. J. Electrochem. Soc. 2017, 164, 1086–1090.
[CrossRef]
7. Zhao, J.; Zhang, P.; Fan, J.; Hu, J.; Shao, G. Constructing 2D layered MoS 2 nanosheets-modified Z-scheme TiO2/WO3nanofibers ternary nanojunction with enhanced photocatalytic activity.Appl. Surf. Sci.2018,430, 466–474. [CrossRef]
8. Tryba, B.; Piszcz, M.; Morawski, A.W. Photocatalytic activity of TiO2—WO3Composites.Int. J. Photoenergy2009, 1–7. [CrossRef]
9. Chakornpradit, P.; Phiriyawirut, M.; Meeyoo, V. Preparation of TiO2/WO3Composite Nanofibers by Electrospinning.Key Eng.
Mater.2017,751, 296–301. [CrossRef]
10. Nagy, D.; Firkala, T.; Drotár, E.; Szegedi,Á.; László, K.; Szilágyi, I.M. Photocatalytic WO3/TiO2nanowires: WO3polymorphs influencing the atomic layer deposition of TiO2.RSC Adv.2016,6, 95369–95377. [CrossRef]
11. Viswanathan, B.; Krishanmurthy, K.R. Nitrogen incorporation in TiO2: Does it make a visible light photo-active material?Int. J.
Photoenergy2012, 1–10. [CrossRef]
12. Binas, V.; Venieri, D.; Kotzias, D.; Kiriakidis, G. Modified TiO2based photocatalysts for improved air and health quality.J. Mater.
2017,3, 3–16.
13. Park, H.; Kim HIl Moon, G.H.; Choi, W. Photoinduced charge transfer processes in solar photocatalysis based on modified TiO2. Energy Environ. Sci.2016,9, 411–433.
14. Ansari, S.A.; Khan, M.M.; Ansari, M.O.; Cho, M.H. Nitrogen-doped titanium dioxide (N-doped TiO2) for visible light photocatal- ysis.New J. Chem.2016,40, 3000–3009. [CrossRef]
15. Li, J.; Xu, J.; Dai, W.L.; Li, H.; Fan, K. One-pot synthesis of twist-like helix tungsten-nitrogen-codoped titania photocatalysts with highly improved visible light activity in the abatement of phenol.Appl. Catal. B Environ.2008,82, 233–243. [CrossRef]
16. Sajjad AK, L.; Shamaila, S.; Zhang, J. Study of new states in visible light active W, N co-doped TiO2photo catalyst.Mater. Res.
Bull.2012,47, 3083–3089. [CrossRef]
17. Lee, S.; Park, Y.; Lee, J.H.; Patel, R. Visible Light-based Photocatalytic Degradation by Transition Metal Oxide.Membr. J.2019,29, 299–307. [CrossRef]
18. Bai, S.; Liu, H.; Sun, J.; Tian, Y.; Chen, S.; Song, J.; Luo, R.; Li, D.; Chen, A.; Liu, C.C. Improvement of TiO2 photocatalytic properties under visible light by WO3/TiO2and MoO3/TiO2composites.Appl. Surf. Sci.2015,338, 61–68. [CrossRef]
19. Xue, J.; Xie, J.; Liu, W.; Xia, Y. 2017 Electrospun Nanofibers: New Concepts, Materials, and Applications.Acc. Chem. Res.2017,50, 1976–1987. [CrossRef]
20. Subbiah, T.; Bhat, G.S.; Tock, R.W.; Parameswaran, S.; Ramkumar, S.S. Electrospinning of nanofibers.J. Appl. Polym. Sci.2005,96, 557–569. [CrossRef]
21. Szilágyi, I.M.; Nagy, D. Review on one-dimensional nanostructures prepared by electrospinning and atomic layer deposition.J.
Phys. Conf. Ser.2014,559, 012010. [CrossRef]
22. Gao, H.; Zhang, P.; Hu, J.; Pan, J.; Fan, J.; Shao, G. One-dimensional Z-scheme TiO2/WO3/Pt heterostructures for enhanced hydrogen generation.Appl. Surf. Sci.2017,391, 211–217. [CrossRef]
23. Chen, Z.; Zhao, J.; Yang, X.; Ye, Q.; Huang, K.; Hou, C.; Zhao, Z.; You, J.; Li, Y. Fabrication of TiO2/WO3Composite Nanofibers by Electrospinning and Photocatalystic Performance of the Resultant Fabrics.Ind. Eng. Chem. Res.2016,55, 80–85. [CrossRef]
24. Balta, Z.; Bilgin Simsek, E.; Berek, D. Solvothermal synthesis of WO3/TiO2/carbon fiber composite photocatalysts for enhanced performance under sunlight illumination.Photochem. Photobiol.2019,95, 1331–1338. [CrossRef] [PubMed]
25. Hu, J.; Wang, L.; Zhang, P.; Liang, C.; Shao, G. Construction of solid-state Z-scheme carbon-modified TiO2/WO3nanofibers with enhanced photocatalytic hydrogen production.J. Power Sources2016,328, 28–36. [CrossRef]
26. Choi, T.; Kim, J.S.; Kim, J.H. Transparent nitrogen doped TiO2/WO3composite films for self-cleaning glass applications with improved photodegradation activity.Adv. Powder Technol.2016,27, 347–353. [CrossRef]
27. Lee, J.Y.; Jo, W.K. Heterojunction-based two-dimensional N-doped TiO2/WO3 composite architectures for photocatalytic treatment of hazardous organic vapor.J. Hazard. Mater.2016,314, 22–31. [CrossRef]
28. Gao, B.; Ma, Y.; Cao, Y.; Yang, W.; Yao, J. Great enhancement of photocatalytic activity of nitrogen-doped titania by coupling with tungsten oxide.J. Phys. Chem. B2006,110, 14391–14397. [CrossRef]
29. Odhiambo, V.O.; Ongarbayeva, A.; Kéri, O.; Simon, L.; Szilágyi, I.M. Synthesis of TiO2/WO3 composite nanofibers by a water-based electrospinning process and their application in photocatalysis.Nanomaterials2020,10, 882. [CrossRef]
30. Kéri, O.; Bárdos, P.; Boyadjiev, S.; Igricz, T.; Nagy, Z.K.; Szilágyi, I.M. Thermal properties of electrospun polyvinylpyrroli- done/titanium tetraisopropoxide composite nanofibers.J. Therm. Anal. Calorim.2019,137, 1249–1254. [CrossRef]
31. Biesinger, M.C.; Lau, L.W.; Gerson, A.R.; Smart, R.S.C. Resolving surface chemical states in XPS analysis of first row transition metals, oxides and hydroxides: Sc, Ti, V, Cu and Zn.Appl. Surf. Sci.2010,257, 887–898. [CrossRef]
32. Fu, P.; Luan, Y.; Dai, X. Preparation of activated carbon fibers supported TiO2photocatalyst and evaluation of its photocatalytic reactivity.J. Mol. Catal. A Chem.2004,221, 81–88. [CrossRef]
33. Potlog, T.; Dumitriu, P.; Dobromir, M.; Luca, D. XRD and XPS Analysis of TiO2Thin Films Annealed in Different Environments.J.
Mater. Sci. Eng. B2014,4, 163–170.
34. Thummavichai, K.; Wang, N.; Xu, F.; Rance, G.; Xia, Y.; Zhu, Y. In situ investigations of the phase change behaviour of tungsten oxide nanostructures.R. Soc. Open Sci.2018,5, 171932. [CrossRef] [PubMed]
35. Branca, C.; D’Angelo, G.; Crupi, C.; Khouzami, K.; Rifici, S.; Ruello, G.; Wanderlingh, U. Role of the OH and NH vibrational groups in polysaccharide-nanocomposite interactions: A FTIR-ATR study on chitosan and chitosan/clay films.Polymer2016,99, 614–622. [CrossRef]
36. Baganizi, D.R.; Nyairo, E.; Duncan, S.A.; Singh, S.R.; Dennis, V.A. Interleukin-10 conjugation to carboxylated PVP-coated silver nanoparticles for improved stability and therapeutic efficacy.Nanomaterials2017,7, 165. [CrossRef]
Nanomaterials2021,11, 351 12 of 12
37. Vijaya, N.; Selvasekarapandian, S.; Hirankumar, G.; Karthikeyan, S.; Nithya, H.; Ramya, C.S.; Prabu, M. Structural, vibrational, thermal, and conductivity studies on proton-conducting polymer electrolyte based on poly (N-vinylpyrrolidone).Ionics2012,18, 91–99. [CrossRef]
38. Mondal, K.; Bhattacharyya, S.; Sharma, A. Photocatalytic Degradation of Naphthalene by Electrospun Mesoporous Carbon-Doped Anatase TiO2Nanofiber Mats.Ind. Eng. Chem. Res.2014,53, 18900–18909. [CrossRef]
39. Kumar, A.; Jose, R.; Fujihara, K.; Wang, J.; Ramakrishna, S. Structural and optical properties of electrospun TiO2nanofibers.Chem.
Mater.2007,19, 6536–6542. [CrossRef]
40. Frank, O.; Zukalova, M.; Laskova, B.; Kürti, J.; Koltai, J.; Kavan, L. Raman spectra of titanium dioxide (anatase, rutile) with identified oxygen isotopes (16, 17, 18).Phys. Chem. Chem. Phys.2012,14, 14567–14572. [CrossRef]
41. Zou, Y.S.; Zhang, Y.C.; Lou, D.; Wang, H.P.; Gu, L.; Dong, Y.H.; Dou, K.; Song, X.F.; Zeng, H.B. Structural and optical properties of WO3films deposited by pulsed laser deposition.J. Alloys Compd.2014,583, 465–470. [CrossRef]
42. Bokobza, L.; Bruneel, J.-L.; Couzi, M. Raman Spectra of Carbon-Based Materials (from Graphite to Carbon Black) and of Some Silicone Composites.C J. Carbon Res.2015,1, 77–94. [CrossRef]
43. Liu, R.; Ye, H.; Xiong, X.; Liu, H. Fabrication of TiO2/ZnO composite nanofibers by electrospinning and their photocatalytic property.Mater. Chem. Phys.2010,121, 432–439. [CrossRef]