STATISTICAL DATA
Edited by
Éva Czethoffer
Compiled by
János Köllő
Judit Lakatos
József Tajti
Statistical tables on labour market trends that have been published in The Hungarian La- bour Market Yearbook since 2000 can be download in full from the website of the Research Centre for Economic and Regional Studies: http://adatbank.krtk.mta.hu/tukor_kereso 1. Basic economic indicators
2. Population 3. Economic activity 4. Employment 5. Unemployment 6. Wages 7. Education
8. Labour demand indicators 9. Regional inequalities 10. Industrial relations 11. Welfare provisions 12. The tax burden on work 13. International comparison
14. Description of the main data sources
DATA SOURCES
CIRCA Communication & Information Resource Centre Administrator
KSH Table compiled from regular Central Statistical Office publications [Központi Statisztikai Hivatal]
KSH IMS CSO institution-based labour statistics [KSH intézményi munkaügyi statisztika]
KSH MEF CSO Labour Force Survey [KSH Munkaerő-felmérés]
KSH MEM CSO Labour Force Account [KSH Munkaerő-mérleg]
NAV National Tax and Customs Administration [Nemzeti Adó- és Vámhivatal]
NEFMI Ministry of National Resources [Nemzeti Erőforrás Minisztérium]
NEFMI EMMI STAT Ministry of National Resources, Educational Statistics [Nemzeti Erőforrás Minisztérium, Oktatásstatisztika]
NFA National Market Fund [Nemzeti Foglalkoztatási Alap]
NFSZ National Employment Service [Nemzeti Foglalkoztatási Szolgálat]
NFSZ BT National Employment Service Wage Survey [NFSZ Bértarifa-felvétel]
NFSZ IR NFSZ integrated tracking system [NFSZ Integrált (nyilvántartási) Rendszer]
NFSZ PROG National Employment Service Short-term Labour Market Projection Survey [NFSZ Rövid Távú Munkaerőpiaci Prognózis]
NFSZ REG National Employment Service Unemployment Register [NFSZ regisztere]
NGM Ministry of National Economy [Nemzetgazdasági Minisztérium]
NMH National Labour Office [Nemzeti Munkaügyi Hivatal]
NSZ Population Census [Népszámlálás]
NYUFIG Pension Administration [Nyugdíjfolyósító Igazgatóság]
ONYF Central Administration of National Pension Insurance [Országos Nyugdíjbiztosítási Főigazgatóság]
TB Social Security Records [Társadalombiztosítás]
EXPLANATION OF SYMBOLS
( – ) Non-occurrence.
( .. ) Not available.
( n.a.) Not applicable.
( ... ) Data cannot be given due to data privacy restrictions.
1 Basic economic indicators Table 1.1: Basic economic indicators
Year GDPa Industrial
productionb Exportc Importc Real
earnings Employ-
ment Consumer
price index Unemploy- ment rate
1990 96.5 90.7 95.9 94.8 94.3 97.2 128.9 ..
1995 101.5 104.6 108.4 96.1 87.8 98.1 128.2 10.2
2000 104.2 118.1 121.7 120.8 101.5 101.0 109.8 6.4
2001 103.8 103.7 107.7 104.0 106.4 100.3 109.2 5.7
2002 104.5 103.2 105.9 105.1 113.6 100.1 105.3 5.8
2003 103.8 106.9 109.1 110.1 109.2 101.3 104.7 5.9
2004 105.0 107.8 118.4 115.2 98.9 99.4 106.8 6.1
2005 104.4 106.8 111.5 106.1 106.3 100.0 103.6 7.2
2006 103.9 109.9 118.0 114.4 103.6 100.7 103.9 7.5
2007 100.4 107.9 115.8 112.0 95.4 99.3 108.0 7.4
2008 100.9 100.0 104.2 104.3 100.8 98.6 106.1 7.8
2009 93.4 82.2 87.3 82.9 97.7 97.4 104.2 10.0
2010 100.7 110.6 116.9 115.1 101.8 99.6 104.9 11.2
2011 101.7 105.6 109.9 106.7 102.4 100.7 103.9 11.0
2012 98.4 98.2 100.7 99.9 96.6 101.8 105.7 11.0
2013 102.1 101.1 104.2 105.0 103.1 101.7 101.7 10.2
2014 104.2 107.7 106.9 108.8 103.2 105.3 99.8 7.7
2015 103.5 107.4 107.8 106.3 104.4 102.7 99.9 6.8
2016 102.3 100.9 104.4 104.9 107.4 103.4 100.4 5.1
2017 104.1 104.6 105.9 108.3 110.3 101.6 102.4 4.2
2018 104.9 103.6 104.2 106.3 108.3 101.1 102.8 3.7
a After 1996 there was a change in the methodology for accounting the undivided service fee of financial intermediation. The method of measurement changed in 2014 with the adoption of ESA2010 (European System of National and Regional Accounts). Unadjusted data. Previ- ous year = 100.
b 1990–2000: those with more than 5 employees, 2001–: excluding water and waste manage- ment, including businesses with fewer than 5 employees.
c Volume index.
Note: Previous year = 100, except for unemployment rate.
Source: GDP: STADAT (2019.03.01. version). Industrial production index: 2001–: STADAT (2019.04.12. version). Export and import: 2001–: STADAT (2019.03.04. version). Real earn- ings: 1995–: STADAT (2019.02.21. version). Employment: 1990: KSH MEM; 1995–: KSH MEF (2019.03.13. version). Consumer price index: STADAT (2019.01.15. version). Unem- ployment rate: STADAT (2019.03.13. version). Other data: KSH.
Online data source in xls format: http://www.bpdata.eu/mpt/2019ent01_01
Figure 1.1: Annual changes of basic economic indicators
Source: KSH.
–15 –12 –9 –6 –3 0 3 6 9 12 15
2018 2016 2014 2012 2010 2008 2006 2004 2002 2000 1998 1996 1994 1992 1990
Real earnings Employment Per cent GDP
Source: Eurostat.
Online data source in xls format: http://www.bpdata.eu/mpt/2019ena01_02
Figure 1.3: Employment rate of population aged 15 –64
Source: Eurostat.
Online data source in xls format: http://www.bpdata.eu/mpt/2019ena01_03
Figure 1.2: Annual GDP time series (2000 = 100%)
100 125 150 175 200
2018 2017 2016 2015 2014 2013 2012 2011 2010 2009 2008 2007 2006 2005 2004 2003 2002 2001 2000
Slovakia Poland Hungary Czech Republic EU-15
Per cent
50 55 60 65 70 75
2018 2017 2016 2015 2014 2013 2012 2011 2010 2009 2008 2007 2006 2005 2004 2003 2002 2001 2000
Slovakia Poland Hungary Czech Republic EU-15
Per cent
2 PoPulation Table 2.1: Population
aYear
In thousands 1992 = 100 Annual changes
Population age 15 –64, in thousands
Demographic dependency rate Total
populationb Old agec
2000 10,221 98.5 –0.3 6,961.3 0.47 0.21
2005 10,098 97.3 –0.2 6,940.3 0.45 0.23
2006 10,077 97.1 –0.2 6,931.8 0.45 0.23
2007 10,066 97.0 –0.1 6,932.4 0.45 0.23
2008 10,045 96.8 –0.2 6,912.7 0.45 0.24
2009 10,031 96.7 –0.1 6,898.1 0.45 0.24
2010 10,014 96.5 –0.1 6,874.0 0.46 0.24
2011 9,986 96.3 –0.2 6,857.4 0.46 0.24
2012 9,932 95.7 .. 6,815.7 0.46 0.25
2013 9,909 95.5 –0.2 6,776.3 0.46 0.25
2014 9,877 95.2 –0.3 6,719.7 0.47 0.26
2015 9,856 95.0 –0.2 6,664.2 0.48 0.27
2016 9,830 94.7 –0.3 6,609.4 0.49 0.27
2017 9,798 94.4 –0.3 6,546.7 0.50 0.28
2018 9,778 94.2 –0.5 6,504.5 0.50 0.28
a January 1st. The data for 2000 –2011 are estimates based on the 2001 census and demograph- ic data (reference date 2001.02.01.). Those for 2012 –2016 are estimates based on the 2011 census (reference day 2011.10.01.) and demographic data.
b (population age 0–14 + 65 and above) / (population age 15–64)
c (population age 65 and above) / (population age 15–64) Source: KSH STADAT (2018.06.29. version)
Online data source in xls format: http://www.bpdata.eu/mpt/2019ent02_01
Table 2.2: Population by age groups, in thousands
a Year0–14 15–24 25–54 55–64 65+
Total years old
2000 1,729.2 1,526.5 4,291.4 1,143.4 1,531.1 10,221.6
2005 1,579.7 1,322.0 4,409.1 1,209.2 1,577.6 10,097.6
2006 1,553.5 1,302.0 4,399.8 1,230.0 1,590.7 10,076.6
2007 1,529.7 1,285.9 4,393.9 1,251.5 1,605.1 10,066.1
2008 1,508.8 1,273.3 4,377.1 1,262.3 1,623.9 10,045.4
2009 1,492.6 1,259.9 4,346.1 1,292.0 1,640.3 10,030.9
2010 1,476.9 1,253.4 4,293.7 1,326.9 1,663.5 10,014.4
2011 1,457.2 1,231.7 4,257.7 1,367.8 1,671.3 9,985.7
2012 1,440.3 1,214.1 4,164.6 1,437.0 1,675.9 9,931.9
2013 1,430.9 1,196.4 4,144.8 1,435.0 1,701.7 9,908.8
2014 1,425.8 1,172.8 4,123.8 1,423.2 1,731.8 9,877.4
2015 1,427.2 1,147.1 4,112.6 1,404.5 1,764.2 9,855.6
2016 1,424.4 1,120.1 4,109.6 1,379.7 1,796.6 9,830.4
2017 1,422.9 1,089.7 4,105.3 1,351.4 1,828.3 9,797.6
2018 1,421.9 1,068.0 4,118.7 1,317.8 1,852.0 9,778.4
a January 1st. The data for 2000 –2011 are estimates based on the 2001 census and demograph- ic data (reference date 2001.02.01.). Those for 2012 –2016 are estimates based on the 2011 census (reference day 2011.10.01.) and demographic data.
Source: KSH STADAT (2018.06.29. version)
Online data source in xls format: http://www.bpdata.eu/mpt/2019ent02_02
Figure 2.1: Age structure of the Hungarian population, 1980, 2018
Source: KSH.
Online data source in xls format: http://www.bpdata.eu/mpt/2019ena02_01 0 30,000 60,000 90,000
90,000 60,000 30,000 0 90,000 60,000 30,000 00 30,000 60,000 90,000
90+
80
70
60
50
40
30
20
10
0
90+
80
70
60
50
40
30
20
10
0
Males Females Males Females
1980 2018
2 PoPulation Table 2.3: Male population by age groups, in thousands
aYear
0–14 15–24 25–59 60–64 65+
Total years old
2000 885.0 780.9 2,403.8 224.8 570.8 4,865.2
2005 809.5 674.6 2,480.0 252.2 576.8 4,793.1
2006 796.7 664.0 2,493.7 249.3 580.9 4,784.6
2007 784.5 655.4 2,503.7 249.4 586.1 4,779.1
2008 773.9 649.2 2,501.3 252.5 592.8 4,769.6
2009 765.8 642.7 2,497.0 258.4 599.2 4,763.1
2010 757.7 640.4 2,488.8 261.7 608.3 4,756.9
2011 747.6 629.7 2,480.4 274.7 611.5 4,743.9
2012 739.5 623.1 2,449.9 294.1 617.9 4,724.6
2013 734.7 614.4 2,439.4 297.0 630.5 4,716.0
2014 732.2 602.1 2,419.1 305.3 644.7 4,703.4
2015 732.8 589.1 2,395.1 319.1 659.7 4,695.8
2016 731.3 575.8 2,379.0 327.1 675.3 4,688.5
2017 730.4 560.3 2,365.0 330.8 688.9 4,675.4
2018 730.0 549.2 2,365.5 327.0 699.9 4,671.6
a January 1st. The data for 2000 –2011 are estimates based on the 2001 census and demo- graphic data (reference date 2001.02.01.). Those for 2012 –2016 are estimates based on the 2011 census (reference day 2011.10.01.) and demographic data.
Source: KSH STADAT (2018.06.29. version)
Online data source in xls format: http://www.bpdata.eu/mpt/2019ent02_03
Table 2.4: Female population by age groups, in thousands
a Year0–14 15–24 25–54 55–59 60+
Total years old
2000 844.3 745.6 2,170.5 334.8 1,261.3 5,356.5
2005 770.2 647.4 2,221.9 341.7 1,323.1 5,304.3
2006 756.8 638.6 2,213.0 356.6 1,327.0 5,292.0
2007 745.1 630.6 2,206.8 369.6 1,335.0 5,287.1
2008 734.9 624.1 2,194.5 373.2 1,349.1 5,275.8
2009 726.8 617.2 2,176.0 381.8 1,366.1 5,267.9
2010 719.2 613.1 2,145.5 396.8 1,382.8 5,257.4
2011 709.6 601.9 2,124.0 404.4 1,401.9 5,241.8
2012 700.8 590.9 2,079.5 416.2 1,419.9 5,207.3
2013 696.2 582.0 2,066.5 411.2 1,436.9 5,192.8
2014 693.6 570.7 2,052.7 395.5 1,461.5 5,174.0
2015 694.4 558.0 2,043.2 370.2 1,494.0 5,159.8
2016 693.1 544.3 2,037.9 347.4 1,519.2 5,142.0
2017 692.5 529.4 2,032.5 327.9 1,539.9 5,122.3
2018 691.9 518.8 2,035.0 314.1 1,547.0 5,106.8
a January 1st. The data for 2000 –2011 are estimates based on the 2001 census and demo- graphic data (reference date 2001.02.01.). Those for 2012 –2016 are estimates based on the 2011 census (reference day 2011.10.01.) and demographic data.
Source: KSH STADAT (2018.06.29. version)
Online data source in xls format: http://www.bpdata.eu/mpt/2019ent02_04
Table 3.1: Labour force participation of the population over 14 years, in thousands
aYear
Population of males 15–59
and females 15–54 Population of males over 59
and females over 54 Employed Unem-ployed
Inactive
Total Employed Unem-ployed
Pensioner, other inactive Total Pensioner Full time student On child
care leave Other
inactive Inactive total
1980 4,887.9 0.0 300.8 370.1 259.0 339.7 1,269.6 6,157.5 570.3 0.0 1,632.1 2,202.4 1990 4,534.3 62.4 284.3 548.9 249.7 297.5 1,380.4 5,977.1 345.7 0.0 1,944.9 2,290.6 1991 4,270.5 253.3 335.6 578.2 259.8 317.1 1,490.7 6,014.5 249.5 0.0 2,045.2 2,294.7 1992 3,898.4 434.9 392.7 620.0 262.1 435.9 1,710.7 6,044.0 184.3 9.8 2,101.7 2,295.8 1993 3,689.5 502.6 437.5 683.9 270.5 480.1 1,872.0 6,064.1 137.5 16.3 2,141.2 2,295.0 1994 3,633.1 437.4 476.5 708.2 280.9 540.7 2,006.3 6,076.8 118.4 11.9 2,163.8 2,294.1 1995 3,571.3 410.0 495.2 723.4 285.3 596.1 2,100.0 6,081.3 107.5 6.4 2,180.6 2,294.5 1996 3,546.1 394.0 512.7 740.0 289.2 599.4 2,141.2 6,081.3 102.1 6.1 2,184.6 2,292.8 1997 3,549.5 342.5 542.9 752.0 289.0 599.9 2,183.8 6,075.8 96.9 6.3 2,189.0 2,292.2 1998 3,608.5 305.5 588.8 697.0 295.5 565.7 2,147.0 6,061.0 89.3 7.5 2,197.6 2,294.4 1999 3,701.0 283.3 534.7 675.6 295.3 549.8 2,055.4 6,039.6 110.4 1.4 2,185.2 2,297.0 2000 3,745.9 261.4 517.9 721.7 281.4 571.4 2,092.4 6,099.7 130.3 2.3 2,268.0 2,400.6 2001 3,742.6 231.7 516.3 717.9 286.6 601.6 2,122.4 6,096.7 140.7 2.4 2,271.8 2,414.9 2002 3,719.6 235.7 507.1 738.3 286.8 593.0 2,125.2 6,080.5 164.1 3.2 2,263.9 2,431.2 2003 3,719.0 239.6 485.0 730.7 286.9 595.0 2,097.6 6,056.2 202.9 4.9 2,245.6 2,453.4 2004 3,663.1 247.2 480.5 739.8 282.4 622.4 2,125.1 6,035.4 237.3 5.7 2,236.1 2,479.1 2005 3,653.9 296.0 449.7 740.8 278.6 590.3 2,059.4 6,009.3 247.6 7.9 2,258.3 2,513.8 2006 3,680.1 309.9 416.1 811.4 261.1 524.3 2,012.9 6,002.9 248.3 8.4 2,270.2 2,526.9 2007 3,649.5 303.7 413.2 822.7 273.9 519.7 2,029.5 5,982.7 252.5 8.4 2,292.9 2,553.8 2008 3,596.3 315.5 394.7 814.3 282.2 549.0 2,040.2 5,952.0 252.0 10.9 2,323.6 2,586.5 2009 3,480.9 403.0 360.3 805.7 282.0 578.4 2,026.4 5,910.3 266.9 14.8 2,345.7 2,627.4 2010 3,435.8 450.1 336.6 805.4 275.9 558.1 1,976.0 5,861.9 298.5 19.3 2,353.3 2,671.1 2011 3,430.1 440.9 296.4 783.8 280.7 557.9 1,932.0 5,789.8 328.9 25.1 2,366.3 2,720.3 2012 3,498.6 447.0 260.1 769.6 263.2 484.3 1,777.2 5,722.8 328.6 26.1 2,407.2 2,761.9 2013 3,551.1 415.7 247.6 737.3 255.4 466.4 1,706.7 5,673.5 341.6 25.2 2,424.5 2,791.3 2014 3,720.7 317.5 222.3 701.2 237.8 412.5 1,573.8 5,612.0 380.0 25.8 2,419.0 2,824.8 2015 3,782.1 281.3 197.3 688.8 240.0 368.1 1,494.2 5,557.6 428.4 26.5 2,400.8 2,855.7 2016 3,860.6 211.3 181.6 656.3 242.4 361.2 1,441.5 5,483.8 491.0 23.3 2,364.1 2,878.4 2017 3,909.9 172.2 164.1 636.5 233.1 362.0 1,362.5 5,444.7 511.4 19.6 2,356.7 2,887.7 2018 3,933.9 158.3 140.9 627.6 232.1 368.4 1,369.0 5,461.2 535.6 13.6 2,339.2 2,888.4
a Annual average figures.
Note: Up to the year 1999, weighting is based on the 1990 population census. From 2000 to 2011, weighting is based on the 2001 population census. From 2012 onwards population weights are based on the 2011 population census. To ensure comparability, the estimates for 2006 –2011 have been modified by the new weighting scheme.
Data on ‘employed’ includes conscripts and those working while receiving pension or child support. The data on students for 1995–97 are estimates.
’Other inactive’ is a residual category calculated by deducting the sum of the figures in the indicated categories from the mid-year population, so it includes the institutional popula- tion not observed by MEF. The population weights have been corrected using the 2011 Cen- sus data.
Source: Pensioners: 1980–91: NYUFIG, 1992–: KSH MEF. Child care recipients: up to the year 1997 TB and estimation, after 1997 MEF. Unemployment: 1990–91: NFSZ REG, 1992–:
KSH MEF.
Online data source in xls format: http://www.bpdata.eu/mpt/2019ent03_01
3 Economic activity Table 3.2: Labour force participation of the population over 14 years, males, in thousands
aYear
Population of males 15–59 Population of males 60 and over Employed Unem-ployed
Inactive
Total Employed Unem-ployed
Pensioner, other inactive Total Pensioner Full time student On child
care leave Other
inactive Inactive total
1980 2,750.5 0.0 173.8 196.3 0.0 99.1 469.2 3,219.7 265.3 0.0 491.8 757.1
1990 2,524.3 37.9 188.4 284.2 1.2 80.3 554.1 3,116.3 123.7 0.0 665.5 789.2
1991 2,351.6 150.3 218.7 296.5 1.5 115.0 631.7 3,133.6 90.4 0.0 700.7 791.1
1992 2,153.1 263.2 252.0 302.4 1.7 174.8 730.9 3,147.2 65.1 3.2 722.1 790.4
1993 2,029.1 311.5 263.2 346.9 2.0 203.3 815.4 3,156.0 47.9 4.5 735.7 788.1
1994 2,013.4 270.0 277.6 357.1 3.7 239.6 878.0 3,161.4 41.6 3.8 740.0 785.4
1995 2,012.5 259.3 282.2 367.4 4.9 237.8 892.3 3,164.1 37.1 2.1 742.6 781.8
1996 2,007.4 242.4 291.9 372.8 3.3 248.3 916.3 3,166.1 28.9 1.3 746.3 776.5
1997 2,018.0 212.2 306.0 377.6 1.5 251.6 936.7 3,166.9 25.5 1.9 743.5 770.9
1998 2,015.5 186.5 345.4 350.4 1.0 264.2 961.0 3,163.0 26.2 2.8 737.3 766.3
1999 2,068.4 170.3 312.7 338.8 4.2 261.5 917.2 3,155.9 34.7 0.4 727.2 762.3
2000 2,086.0 158.2 315.2 358.2 4.1 261.7 939.2 3,183.4 39.8 0.7 758.8 799.3
2001 2,087.6 141.6 311.0 353.4 4.3 283.2 951.9 3,181.1 41.1 0.9 763.0 805.0
2002 2,080.4 137.3 307.5 370.3 5.0 273.4 956.2 3,173.9 45.2 0.7 764.4 810.3
2003 2,073.5 137.6 293.6 367.9 4.3 288.1 953.9 3,165.0 53.0 0.9 762.5 816.4
2004 2,052.7 136.2 293.5 371.2 4.6 300.2 969.5 3,158.4 64.6 0.6 758.8 824.0
2005 2,050.7 158.2 278.8 375.4 5.8 288.8 948.8 3,157.7 65.4 0.9 763.9 830.2
2006 2,078.4 163.4 258.9 404.1 4.0 249.6 916.6 3,158.4 60.2 1.1 771.5 832.8
2007 2,067.4 162.5 261.8 410.2 4.1 248.8 924.9 3,154.8 61.9 1.0 777.5 840.4
2008 2,033.6 172.7 261.2 408.3 4.7 264.6 938.8 3,145.1 60.0 1.0 790.4 851.4
2009 1,961.9 230.3 240.1 409.0 4.4 288.7 942.2 3,134.4 63.1 1.6 798.9 863.6
2010 1,929.5 259.5 228.7 410.3 4.6 287.1 930.7 3,119.7 63.0 2.2 812.9 878.1
2011 1,950.9 248.7 203.7 397.9 3.6 286.8 892.0 3,091.6 70.1 2.9 826.2 899.2
2012 1,979.2 257.9 187.7 395.6 4.2 238.8 826.3 3,063.4 69.6 4.1 846.1 919.8
2013 2,022.2 234.4 169.5 375.6 3.8 232.0 780.9 3,037.5 81.5 4.8 852.4 938.7
2014 2,120.3 173.1 151.3 352.5 3.0 200.9 707.7 3,001.1 100.1 8.6 855.6 964.3
2015 2,152.1 152.1 133.7 345.1 3.1 181.4 663.3 2,967.5 131.4 9.8 849.3 990.5
2016 2,192.4 119.0 119.6 332.3 3.8 173.6 629.3 2,940.7 170.1 8.5 832.5 1,011.1
2017 2,228.9 89.8 107.3 322.9 1.9 169.2 601.2 2,920.0 188.4 6.0 828.8 1,023.2
2018 2,245.4 83.9 94.2 315.9 1.3 171.0 582.4 2,911.7 200.8 4.1 824.4 1,029.3
a Annual average figures.
Note: Up to the year 1999, weighting is based on the 1990 population census. From 2000 to 2011, weighting is based on the 2001 population census. From 2012 onwards population weights are based on the 2011 population census. To ensure comparability, the estimates for 2006 –2011 have been modified by the new weighting scheme.
Data on ‘employed’ includes conscripts and those working while receiving pension or child support. The data on students for 1995–97 are estimates.
’Other inactive’ is a residual category calculated by deducting the sum of the figures in the indicated categories from the mid-year population, so it includes the institutional popula- tion not observed by MEF. The population weights have been corrected using the 2011 Cen- sus data.
Source: Pensioners: 1980–91: NYUFIG, 1992–: KSH MEF. Child care recipients: up to the year 1997 TB and estimation, after 1997 MEF. Unemployment: 1990–91: NFSZ REG, 1992–:
KSH MEF.
Online data source in xls format: http://www.bpdata.eu/mpt/2019ent03_02
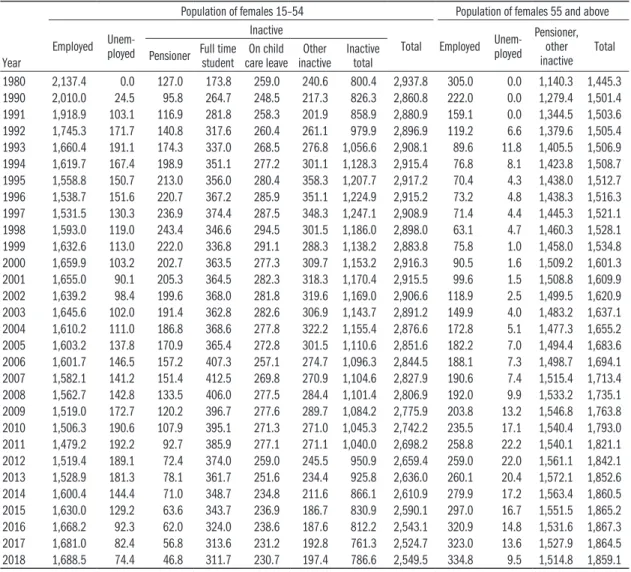
Table 3.3: Labour force participation of the population over 14 years, females, in thousands
aYear
Population of females 15–54 Population of females 55 and above Employed Unem-ployed
Inactive
Total Employed Unem-ployed
Pensioner, other inactive Total Pensioner Full time student On child
care leave Other
inactive Inactive total
1980 2,137.4 0.0 127.0 173.8 259.0 240.6 800.4 2,937.8 305.0 0.0 1,140.3 1,445.3 1990 2,010.0 24.5 95.8 264.7 248.5 217.3 826.3 2,860.8 222.0 0.0 1,279.4 1,501.4 1991 1,918.9 103.1 116.9 281.8 258.3 201.9 858.9 2,880.9 159.1 0.0 1,344.5 1,503.6 1992 1,745.3 171.7 140.8 317.6 260.4 261.1 979.9 2,896.9 119.2 6.6 1,379.6 1,505.4 1993 1,660.4 191.1 174.3 337.0 268.5 276.8 1,056.6 2,908.1 89.6 11.8 1,405.5 1,506.9 1994 1,619.7 167.4 198.9 351.1 277.2 301.1 1,128.3 2,915.4 76.8 8.1 1,423.8 1,508.7 1995 1,558.8 150.7 213.0 356.0 280.4 358.3 1,207.7 2,917.2 70.4 4.3 1,438.0 1,512.7 1996 1,538.7 151.6 220.7 367.2 285.9 351.1 1,224.9 2,915.2 73.2 4.8 1,438.3 1,516.3 1997 1,531.5 130.3 236.9 374.4 287.5 348.3 1,247.1 2,908.9 71.4 4.4 1,445.3 1,521.1 1998 1,593.0 119.0 243.4 346.6 294.5 301.5 1,186.0 2,898.0 63.1 4.7 1,460.3 1,528.1 1999 1,632.6 113.0 222.0 336.8 291.1 288.3 1,138.2 2,883.8 75.8 1.0 1,458.0 1,534.8 2000 1,659.9 103.2 202.7 363.5 277.3 309.7 1,153.2 2,916.3 90.5 1.6 1,509.2 1,601.3 2001 1,655.0 90.1 205.3 364.5 282.3 318.3 1,170.4 2,915.5 99.6 1.5 1,508.8 1,609.9 2002 1,639.2 98.4 199.6 368.0 281.8 319.6 1,169.0 2,906.6 118.9 2.5 1,499.5 1,620.9 2003 1,645.6 102.0 191.4 362.8 282.6 306.9 1,143.7 2,891.2 149.9 4.0 1,483.2 1,637.1 2004 1,610.2 111.0 186.8 368.6 277.8 322.2 1,155.4 2,876.6 172.8 5.1 1,477.3 1,655.2 2005 1,603.2 137.8 170.9 365.4 272.8 301.5 1,110.6 2,851.6 182.2 7.0 1,494.4 1,683.6 2006 1,601.7 146.5 157.2 407.3 257.1 274.7 1,096.3 2,844.5 188.1 7.3 1,498.7 1,694.1 2007 1,582.1 141.2 151.4 412.5 269.8 270.9 1,104.6 2,827.9 190.6 7.4 1,515.4 1,713.4 2008 1,562.7 142.8 133.5 406.0 277.5 284.4 1,101.4 2,806.9 192.0 9.9 1,533.2 1,735.1 2009 1,519.0 172.7 120.2 396.7 277.6 289.7 1,084.2 2,775.9 203.8 13.2 1,546.8 1,763.8 2010 1,506.3 190.6 107.9 395.1 271.3 271.0 1,045.3 2,742.2 235.5 17.1 1,540.4 1,793.0 2011 1,479.2 192.2 92.7 385.9 277.1 271.1 1,040.0 2,698.2 258.8 22.2 1,540.1 1,821.1 2012 1,519.4 189.1 72.4 374.0 259.0 245.5 950.9 2,659.4 259.0 22.0 1,561.1 1,842.1 2013 1,528.9 181.3 78.1 361.7 251.6 234.4 925.8 2,636.0 260.1 20.4 1,572.1 1,852.6 2014 1,600.4 144.4 71.0 348.7 234.8 211.6 866.1 2,610.9 279.9 17.2 1,563.4 1,860.5 2015 1,630.0 129.2 63.6 343.7 236.9 186.7 830.9 2,590.1 297.0 16.7 1,551.5 1,865.2 2016 1,668.2 92.3 62.0 324.0 238.6 187.6 812.2 2,543.1 320.9 14.8 1,531.6 1,867.3 2017 1,681.0 82.4 56.8 313.6 231.2 192.8 761.3 2,524.7 323.0 13.6 1,527.9 1,864.5 2018 1,688.5 74.4 46.8 311.7 230.7 197.4 786.6 2,549.5 334.8 9.5 1,514.8 1,859.1
a Annual average figures.
Note: Up to the year 1999, weighting is based on the 1990 population census. From 2000 to 2011, weighting is based on the 2001 population census. From 2012 onwards population weights are based on the 2011 population census. To ensure comparability, the estimates for 2006 –2011 have been modified by the new weighting scheme.
Data on ‘employed’ includes conscripts and those working while receiving pension or child support. The data on students for 1995–97 are estimates.
’Other inactive’ is a residual category calculated by deducting the sum of the figures in the indicated categories from the mid-year population, so it includes the institutional popula- tion not observed by MEF. The population weights have been corrected using the 2011 Cen- sus data.
Source: Pensioners: 1980–91: NYUFIG, 1992–: KSH MEF. Child care recipients: up to the year 1997 TB and estimation, after 1997 MEF. Unemployment: 1990–91: NFSZ REG, 1992–:
KSH MEF.
Online data source in xls format: http://www.bpdata.eu/mpt/2019ent03_03
3 Economic activity Table 3.4: Labour force participation of the population over 14 years, per cent
Year
Population of males 15–59
and females 15–54 Population of males over 59
and female over 54 Employed Unem-ployed
Inactive
Total Employed Unem-ployed
Pensioner, other inactive Total Pensioner Full time student On child
care leave Other
inactive Inactive total
1980 79.4 0.0 4.9 6.0 4.2 5.5 20.6 100.0 25.9 0.0 74.1 100.0
1990 75.9 1.0 4.8 9.2 4.2 5.0 23.1 100.0 15.1 0.0 84.9 100.0
1995 58.7 6.7 8.1 11.9 4.7 9.8 34.5 100.0 4.7 0.3 95.0 100.0
2000 61.4 4.3 8.5 11.8 4.6 9.4 34.3 100.0 5.4 0.1 94.5 100.0
2001 61.4 3.8 8.5 11.8 4.7 9.9 34.8 100.0 5.8 0.1 94.1 100.0
2002 61.2 3.9 8.3 12.1 4.7 9.8 35.0 100.0 6.7 0.1 93.1 100.0
2003 61.4 4.0 8.0 12.1 4.7 9.8 34.6 100.0 8.3 0.2 91.5 100.0
2004 60.7 4.1 8.0 12.3 4.7 10.3 35.2 100.0 9.6 0.2 90.2 100.0
2005 60.8 4.9 7.5 12.3 4.6 9.8 34.3 100.0 9.8 0.3 89.8 100.0
2006 61.3 5.2 6.9 13.5 4.3 8.7 33.5 100.0 9.8 0.3 89.8 100.0
2007 61.0 5.1 6.9 13.8 4.6 8.7 33.9 100.0 9.9 0.3 89.8 100.0
2008 60.4 5.3 6.6 13.7 4.7 9.2 34.3 100.0 9.7 0.4 89.8 100.0
2009 58.9 6.8 6.1 13.6 4.8 9.8 34.3 100.0 10.2 0.6 89.3 100.0
2010 58.6 7.7 5.7 13.7 4.7 9.5 33.7 100.0 11.2 0.7 88.1 100.0
2011 59.2 7.6 5.1 13.5 4.8 9.6 33.1 100.0 12.1 0.9 87.0 100.0
2012 61.1 7.8 4.5 13.4 4.6 8.5 31.1 100.0 11.9 0.9 87.2 100.0
2013 62.6 7.3 4.4 13.0 4.5 8.2 30.1 100.0 12.2 0.9 86.9 100.0
2014 66.3 5.7 4.0 12.5 4.2 7.3 28.0 100.0 13.5 0.9 85.6 100.0
2015 68.1 5.1 3.6 12.4 4.3 6.6 26.9 100.0 15.0 0.9 84.1 100.0
2016 70.4 3.9 3.3 12.0 4.4 6.6 26.3 100.0 17.1 0.8 82.1 100.0
2017 71.8 3.2 3.0 11.7 4.3 6.6 25.0 100.0 17.7 0.7 81.6 100.0
2018 72.0 2.9 2.6 11.5 4.2 6.7 25.1 100.0 18.5 0.5 81.0 100.0
Figure 3.1: Labour force participation of population for males 15–59 and females 15–54, total
Source: Pensioners: 1990–91: NYUFIG, 1992–: KSH MEF. Child care recipients: up to the year 1997 TB and estimation, after 1997 MEF. Unemployment: 1990 –91: NFSZ REG, 1992–: KSH MEF.
Online data source in xls format: http://www.bpdata.eu/mpt/2019ena03_01
Source: Pensioners: 1980–90: NYUFIG, 1995–: KSH MEF. Child care recipients: up to the year 1995 TB and estimation, after 1995 MEF. Unemployment: 1990: NFSZ REG, 1995–:
KSH MEF.
Online data source in xls format: http://www.bpdata.eu/mpt/2019ent03_04
0 20 40 60 80 100
0 20 40 60 80 100
2018 2016 2014 2012 2010 2008 2006 2004 2002 2000 1998 1996 1994 1992 1990
Other inactive On child care leave Student Pensioner Unemployed Employed
Per cent
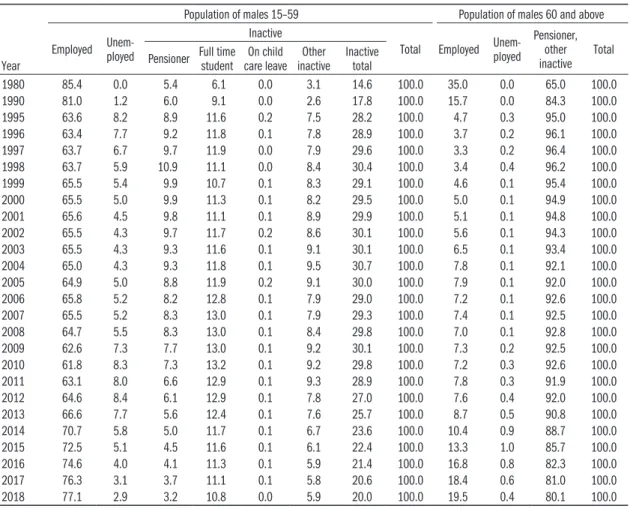
Table 3.5: Labour force participation of the population over 14 years, males, per cent
Year
Population of males 15–59 Population of males 60 and above Employed Unem-ployed
Inactive
Total Employed Unem-ployed
Pensioner, other inactive Total Pensioner Full time student On child
care leave Other
inactive Inactive total
1980 85.4 0.0 5.4 6.1 0.0 3.1 14.6 100.0 35.0 0.0 65.0 100.0
1990 81.0 1.2 6.0 9.1 0.0 2.6 17.8 100.0 15.7 0.0 84.3 100.0
1995 63.6 8.2 8.9 11.6 0.2 7.5 28.2 100.0 4.7 0.3 95.0 100.0
1996 63.4 7.7 9.2 11.8 0.1 7.8 28.9 100.0 3.7 0.2 96.1 100.0
1997 63.7 6.7 9.7 11.9 0.0 7.9 29.6 100.0 3.3 0.2 96.4 100.0
1998 63.7 5.9 10.9 11.1 0.0 8.4 30.4 100.0 3.4 0.4 96.2 100.0
1999 65.5 5.4 9.9 10.7 0.1 8.3 29.1 100.0 4.6 0.1 95.4 100.0
2000 65.5 5.0 9.9 11.3 0.1 8.2 29.5 100.0 5.0 0.1 94.9 100.0
2001 65.6 4.5 9.8 11.1 0.1 8.9 29.9 100.0 5.1 0.1 94.8 100.0
2002 65.5 4.3 9.7 11.7 0.2 8.6 30.1 100.0 5.6 0.1 94.3 100.0
2003 65.5 4.3 9.3 11.6 0.1 9.1 30.1 100.0 6.5 0.1 93.4 100.0
2004 65.0 4.3 9.3 11.8 0.1 9.5 30.7 100.0 7.8 0.1 92.1 100.0
2005 64.9 5.0 8.8 11.9 0.2 9.1 30.0 100.0 7.9 0.1 92.0 100.0
2006 65.8 5.2 8.2 12.8 0.1 7.9 29.0 100.0 7.2 0.1 92.6 100.0
2007 65.5 5.2 8.3 13.0 0.1 7.9 29.3 100.0 7.4 0.1 92.5 100.0
2008 64.7 5.5 8.3 13.0 0.1 8.4 29.8 100.0 7.0 0.1 92.8 100.0
2009 62.6 7.3 7.7 13.0 0.1 9.2 30.1 100.0 7.3 0.2 92.5 100.0
2010 61.8 8.3 7.3 13.2 0.1 9.2 29.8 100.0 7.2 0.3 92.6 100.0
2011 63.1 8.0 6.6 12.9 0.1 9.3 28.9 100.0 7.8 0.3 91.9 100.0
2012 64.6 8.4 6.1 12.9 0.1 7.8 27.0 100.0 7.6 0.4 92.0 100.0
2013 66.6 7.7 5.6 12.4 0.1 7.6 25.7 100.0 8.7 0.5 90.8 100.0
2014 70.7 5.8 5.0 11.7 0.1 6.7 23.6 100.0 10.4 0.9 88.7 100.0
2015 72.5 5.1 4.5 11.6 0.1 6.1 22.4 100.0 13.3 1.0 85.7 100.0
2016 74.6 4.0 4.1 11.3 0.1 5.9 21.4 100.0 16.8 0.8 82.3 100.0
2017 76.3 3.1 3.7 11.1 0.1 5.8 20.6 100.0 18.4 0.6 81.0 100.0
2018 77.1 2.9 3.2 10.8 0.0 5.9 20.0 100.0 19.5 0.4 80.1 100.0
Source: Pensioners: 1980–90: NYUFIG, 1995–: KSH MEF. Child care recipients: up to the year 1997 TB and estimation, after 1997 MEF. Unemployment: 1990: NFSZ REG, 1995–:
KSH MEF.
Online data source in xls format: http://www.bpdata.eu/mpt/2019ent03_05
Figure 3.2: Labour force participation of population for males 15–59
Source: Pensioners: 1990–91: NYUFIG, 1992–: KSH MEF. Child care recipients: up to the year 1997 TB and estimation, after 1997 MEF. Unemployment: 1990 –91: NFSZ REG, 1992–: KSH MEF.
Online data source in xls format: http://www.bpdata.eu/mpt/2019ena03_02 0
20 40 60 80 100
0 20 40 60 80 100
2018 2016 2014 2012 2010 2008 2006 2004 2002 2000 1998 1996 1994 1992 1990
Other inactive On child care leave Student Pensioner Unemployed Employed
Per cent
3 Economic activity Table 3.6: Labour force participation of the population over 14 years, females, per cent
Year
Population of females 15–54 Population of females 55 and above Employed Unem-ployed
Inactive
Total Employed Unem-ployed
Pensioner, other inactive Total Pensioner Full time student On child
care leave Other
inactive Inactive total
1980 72.8 0.0 4.3 5.9 8.8 8.2 27.2 100.0 21.1 0.0 78.9 100.0
1990 70.3 0.9 3.3 9.3 8.7 7.6 28.9 100.0 14.8 0.0 85.2 100.0
1995 53.4 5.2 7.3 12.2 9.6 12.3 41.4 100.0 4.7 0.3 95.1 100.0
1996 52.8 5.2 7.6 12.6 9.8 12.0 42.0 100.0 4.8 0.3 94.9 100.0
1997 52.6 4.5 8.1 12.9 9.9 12.0 42.9 100.0 4.7 0.3 95.0 100.0
1998 55.0 4.1 8.4 12.0 10.2 10.4 40.9 100.0 4.1 0.3 95.6 100.0
1999 56.6 3.9 7.7 11.7 10.1 10.0 39.5 100.0 4.9 0.1 95.0 100.0
2000 56.9 3.5 7.0 12.5 9.5 10.6 39.5 100.0 5.7 0.1 94.2 100.0
2001 56.8 3.1 7.0 12.5 9.7 10.9 40.1 100.0 6.2 0.1 93.7 100.0
2002 56.4 3.4 6.9 12.7 9.7 11.0 40.2 100.0 7.3 0.2 92.5 100.0
2003 56.9 3.5 6.6 12.5 9.8 10.6 39.6 100.0 9.2 0.2 90.6 100.0
2004 56.0 3.9 6.5 12.8 9.7 11.2 40.2 100.0 10.4 0.3 89.3 100.0
2005 56.2 4.8 6.0 12.8 9.6 10.6 38.9 100.0 10.8 0.4 88.8 100.0
2006 56.3 5.2 5.5 14.3 9.0 9.7 38.5 100.0 11.1 0.4 88.5 100.0
2007 55.9 5.0 5.4 14.6 9.5 9.6 39.1 100.0 11.1 0.4 88.4 100.0
2008 55.7 5.1 4.8 14.5 9.9 10.1 39.2 100.0 11.1 0.6 88.4 100.0
2009 54.7 6.2 4.3 14.3 10.0 10.4 39.1 100.0 11.6 0.7 87.7 100.0
2010 54.9 7.0 3.9 14.4 9.9 9.9 38.1 100.0 13.1 1.0 85.9 100.0
2011 54.8 7.1 3.4 14.3 10.3 10.0 38.1 100.0 14.2 1.2 84.6 100.0
2012 57.1 7.1 2.7 14.1 9.7 9.2 36.0 100.0 14.1 1.2 84.7 100.0
2013 58.0 6.9 3.0 13.7 9.5 8.8 35.1 100.0 14.0 1.1 84.9 100.0
2014 61.3 5.5 2.8 13.4 9.0 8.1 33.2 100.0 15.0 0.9 84.0 100.0
2015 62.9 5.0 2.5 13.3 9.1 7.2 32.1 100.0 15.9 0.9 83.2 100.0
2016 65.6 3.6 2.4 12.7 9.4 7.4 31.9 100.0 17.2 0.8 82.0 100.0
2017 66.6 3.3 2.3 12.4 9.2 7.6 30.2 100.0 17.3 0.7 81.9 100.0
2018 66.2 2.9 1.8 12.2 9.1 7.7 30.9 100.0 18.0 0.5 81.5 100.0
Source: Pensioners: 1980–90: NYUFIG, 1995–: KSH MEF. Child care recipients: up to the year 1997 TB and estimation, after 1997 MEF. Unemployment: 1990: NFSZ REG, 1995–:
KSH MEF.
Online data source in xls format: http://www.bpdata.eu/mpt/2019ent03_06
Figure 3.3: Labour force participation of population for females 15–54
Source: Pensioners: 1990–91: NYUFIG, 1992–: KSH MEF. Child care recipients: up to the year 1997 TB and estimation, after 1997 MEF. Unemployment: 1990 –91: NFSZ REG, 1992–: KSH MEF.
0 20 40 60 80 100
0 20 40 60 80 100
2018 2016 2014 2012 2010 2008 2006 2004 2002 2000 1998 1996 1994 1992 1990
Other inactive On child care leave Student Pensioner Unemployed Employed
Per cent
Table 3.7: Population aged 15–64 by labour market status (self-categorised), in thousands
2006 2007 2008 2009 2010 2011 2012 2013 2014 2015 2016 2017 2018
Together
In work 3,862.5 3,831.6 3,769.3 3,681.5 3,660.3 3,690.1 3,748.4 3,824.5 4,039.5 4,159.5 4,298.5 4,366.9 4,401.6 Unemployed 470.4 450.2 476.7 591.3 670.7 675.8 700.4 666.5 538.8 454.6 366.3 314.0 284.1 Students, pupils 846.3 861.1 863.7 854.8 854.6 842.2 811.2 772.5 733.5 710.3 675.6 650.4 644.2 Pensioner 622.9 592.2 635.6 627.6 599.3 582.0 630.3 613.6 557.5 477.5 420.1 392.6 364.9 Disabled 506.8 554.4 525.8 498.9 488.4 455.1 356.7 335.7 317.7 318.0 303.1 285.7 253.4 On child care
leave 275.5 286.2 295.0 293.0 289.3 290.2 265.0 259.1 237.0 236.9 236.4 227.5 228.6 Dependent 115.2 111.9 104.0 101.9 95.3 104.3 93.1 96.9 85.3 91.7 93.7 93.2 106.2 Out of work for
other reasons 107.7 101.8 101.7 104.9 78.2 78.9 89.1 78.0 78.4 81.9 84.1 84.9 86.4 Total 6,807.3 6,789.4 6,771.6 6,753.8 6,736.0 6,718.5 6,694.1 6,646.8 6,587.7 6,530.4 6,477.9 6,415.2 6,369.5 Males
In work 2,106.3 2,095.3 2,056.8 1,993.3 1,958.0 1,985.4 2,009.3 2,065.1 2,186.4 2,256.0 2,331.6 2,384.2 2,407.8 Unemployed 251.6 242.0 255.8 333.6 375.6 372.2 382.9 364.4 283.7 241.4 198.9 159.4 146.9 Students, pupils 418.3 428.4 431.7 430.6 432.7 427.2 416.1 393.4 366.9 354.3 338.2 329.1 322.6 Pensioner 234.9 217.4 243.4 246.2 245.6 243.7 254.9 236.7 209.7 167.1 133.1 118.3 109.4 Disabled 243.0 269.4 257.9 238.2 234.6 215.7 177.1 161.6 152.5 152.0 149.4 137.8 123.1 On child care
leave 5.6 4.3 5.6 5.7 6.7 4.5 4.1 4.1 3.1 2.9 3.8 1.9 1.4
Dependent 5.4 6.3 6.8 6.8 9.6 10.0 7.0 9.8 8.3 9.4 8.9 7.8 9.9
Out of work for
other reasons 55.1 51.8 51.6 49.8 36.1 35.8 40.8 37.1 36.0 39.8 39.2 38.4 40.1
Total 3,320.2 3,314.9 3,309.6 3,304.2 3,298.9 3,294.4 3,292.2 3,272.1 3,246.7 3,222.9 3,203.1 3,176.9 3,161.2 Females
In work 1,756.3 1,736.3 1,712.4 1,688.2 1,702.2 1,704.7 1,739.1 1,759.4 1,853.1 1,903.6 1,967.0 1,982.7 1,993.9 Unemployed 218.8 208.3 220.9 257.6 295.1 303.6 317.5 302.1 255.0 213.2 167.4 154.5 137.2 Students, pupils 428.0 432.7 432.0 424.2 421.9 415.0 395.1 379.0 366.6 356.0 337.4 321.3 321.6 Pensioner 388.0 374.8 392.2 381.4 353.7 338.2 375.4 376.9 347.8 310.3 287.0 274.3 255.5 Disabled 263.9 285.0 267.9 260.7 253.8 239.5 179.6 174.1 165.2 166.0 153.7 147.9 130.3 On child care
leave 269.9 281.9 289.4 287.3 282.6 285.7 260.9 255.0 233.8 233.9 232.6 225.6 227.2
Dependent 109.7 105.6 97.2 95.1 85.7 94.3 86.1 87.2 77.0 82.3 84.7 85.4 96.3
Out of work for
other reasons 52.6 50.0 50.1 55.1 42.1 43.1 48.3 40.9 42.4 42.2 44.9 46.5 46.3
Total 3,487.1 3,474.5 3,462.1 3,449.6 3,437.1 3,424.1 3,401.9 3,374.7 3,341.1 3,307.5 3,274.8 3,238.2 3,208.3 Source: KSH MEF.
Online data source in xls format: http://www.bpdata.eu/mpt/2019ent03_07
3 Economic activity Table 3.8: Population aged 15–64 by labour market status (self-categorised), per cent
2005 2006 2007 2008 2009 2010 2011 2012 2013 2014 2015 2016 2017 2018 Together
In work 56.5 56.7 56.4 55.7 54.5 54.3 54.9 56.0 57.5 61.3 63.7 66.4 68.1 69.1
Unemployed 7.2 6.9 6.6 7.0 8.8 10.0 10.1 10.5 10.0 8.2 7.0 5.7 4.9 4.5
Students, pupils 11.6 12.4 12.7 12.8 12.7 12.7 12.5 12.1 11.6 11.1 10.9 10.4 10.1 10.1
Pensioner 11.1 9.2 8.7 9.4 9.3 8.9 8.7 9.4 9.2 8.5 7.3 6.5 6.1 5.7
Disabled 5.3 7.4 8.2 7.8 7.4 7.3 6.8 5.3 5.1 4.8 4.9 4.7 4.5 4.0
On child care leave 4.0 4.0 4.2 4.4 4.3 4.3 4.3 4.0 3.9 3.6 3.6 3.6 3.5 3.6
Dependent 2.0 1.7 1.6 1.5 1.5 1.4 1.6 1.4 1.5 1.3 1.4 1.4 1.5 1.7
Out of work for other
reasons 2.3 1.6 1.5 1.5 1.6 1.2 1.2 1.3 1.2 1.2 1.3 1.3 1.3 1.4
Total 100.0 100.0 100.0 100.0 100.0 100.0 100.0 100.0 100.0 100.0 100.0 100.0 100.0 100.0 Males
In work 62.7 63.4 63.2 62.1 60.3 59.4 60.3 61.0 63.1 67.3 70.0 72.8 75.0 76.2
Unemployed 8.0 7.6 7.3 7.7 10.1 11.4 11.3 11.6 11.1 8.7 7.5 6.2 5.0 4.6
Students, pupils 12.0 12.6 12.9 13.0 13.0 13.1 13.0 12.6 12.0 11.3 11.0 10.6 10.4 10.2
Pensioner 9.1 7.1 6.6 7.4 7.4 7.4 7.4 7.7 7.2 6.5 5.2 4.2 3.7 3.5
Disabled 5.4 7.3 8.1 7.8 7.2 7.1 6.5 5.4 4.9 4.7 4.7 4.7 4.3 3.9
On child care leave 0.2 0.2 0.1 0.2 0.2 0.2 0.1 0.1 0.1 0.1 0.1 0.1 0.1 0.0
Dependent 0.2 0.2 0.2 0.2 0.2 0.3 0.3 0.2 0.3 0.3 0.3 0.3 0.2 0.3
Out of work for other
reasons 2.4 1.7 1.6 1.6 1.5 1.1 1.1 1.2 1.1 1.1 1.2 1.2 1.2 1.3
Total 100.0 100.0 100.0 100.0 100.0 100.0 100.0 100.0 100.0 100.0 100.0 100.0 100.0 100.0 Females
In work 50.6 50.4 50.0 49.5 48.9 49.5 49.8 51.1 52.1 55.5 57.6 60.1 61.2 62.1
Unemployed 6.4 6.3 6.0 6.4 7.5 8.6 8.9 9.3 9.0 7.6 6.4 5.1 4.8 4.3
Students, pupils 11.3 12.3 12.5 12.5 12.3 12.3 12.1 11.6 11.2 11.0 10.8 10.3 9.9 10.0
Pensioner 12.9 11.1 10.8 11.3 11.1 10.3 9.9 11.0 11.2 10.4 9.4 8.8 8.5 8.0
Disabled 5.2 7.6 8.2 7.7 7.6 7.4 7.0 5.3 5.2 4.9 5.0 4.7 4.6 4.1
On child care leave 7.6 7.7 8.1 8.4 8.3 8.2 8.3 7.7 7.6 7.0 7.1 7.1 7.0 7.1
Dependent 3.7 3.1 3.0 2.8 2.8 2.5 2.8 2.5 2.6 2.3 2.5 2.6 2.6 3.0
Out of work for other
reasons 2.3 1.5 1.4 1.4 1.6 1.2 1.3 1.4 1.2 1.3 1.3 1.4 1.4 1.4
Total 100.0 100.0 100.0 100.0 100.0 100.0 100.0 100.0 100.0 100.0 100.0 100.0 100.0 100.0 Source: KSH MEF.
Online data source in xls format: http://www.bpdata.eu/mpt/2019ent03_08
Table 4.1: Employment
Year In thousands 1992 = 100 Annual changes Employment ratioa
1990 4,880.0 119.5 .. 59.0
1991 4,520.0 110.7 –7.4 54.4
1992 4,082.7 100.0 –9.7 49.0
1993 3,827.0 93.7 –6.2 45.8
1994 3,751.5 91.9 –2.0 44.8
1995 3,678.8 90.1 –1.9 43.9
1996 3,648.2 89.4 –0.9 43.6
1997 3,646.4 89.3 0.0 43.6
1998 3,697.8 90.6 1.4 44.3
1999 3,811.4 93.4 3.2 45.7
2000 3,849.1 94.3 1.0 46.2
2001 3,883.3 95.1 0.3 45.6
2002 3,883.7 95.1 0.0 45.6
2003 3,921.9 96.1 1.2 46.2
2004 3,900.4 95.5 –0.5 45.8
2005 3,901.5 95.6 0.0 45.7
2006 3,928.4 96.2 0.7 46.0
2007 3,902.0 95.6 –0.7 45.7
2008 3,848.3 94.3 –1.4 45.0
2009 3,747.8 91.8 –2.6 43.9
2010 3,732.4 91.4 –0.4 43.7
2011 3,759.0 92.1 0.7 44.2
2012 3,827.2 93.7 1.8 45.1
2013 3,892.8 95.3 1.7 46.0
2014 4,100.9 100.4 5.3 48.6
2015 4,210.5 103.1 2.7 50.0
2016 4,351.7 106.7 3.4 51.9
2017 4,421.4 108.3 1.6 52.9
2018 4,469.5 109.4 1.1 53.6
a Per cent of the population over 14 years of age.
Source: 1990–91: KSH MEM, 1992–: KSH MEF.
Online data source in xls format: http://www.bpdata.eu/mpt/2019ent04_01
Figure 4.1: Employed
Source: 1990 –91: KSH MEM, 1992–: KSH MEF.
Online data source in xls format: http://www.bpdata.eu/mpt/2019ena04_01 3,000
3,500 4,000 4,500 5,000
2018 2016 2014 2012 2010 2008 2006 2004 2002 2000 1998 1996 1994 1992 1990
Employed Employment ratio
40 45 50 55 60
In thousands Per cent
4 EmploymEnt Table 4.2: Employment by gender
Year
Males Females Share of females
In thousands 1992 = 100 In thousands 1992 = 100 (%)
1990 2,648.0 119.4 2,232.0 119.7 45.7
1991 2,442.0 110.1 2,078.0 111.5 46.0
1992 2,218.2 100.0 1,864.5 100.0 45.7
1993 2,077.0 93.6 1,750.0 93.9 45.7
1994 2,055.0 92.6 1,696.5 91.0 45.2
1995 2,049.6 92.4 1,629.2 87.4 44.3
1996 2,036.3 91.8 1,611.9 86.5 44.2
1997 2,043.5 92.1 1,602.9 86.0 44.0
1998 2,041.7 92.0 1,656.1 88.8 44.8
1999 2,103.1 94.8 1,708.4 91.6 44.8
2000 2,122.4 95.7 1,726.7 92.6 44.9
2001 2,128.7 96.0 1,754.6 94.1 45.2
2002 2,125.6 95.8 1,758.1 94.3 45.3
2003 2,126.5 95.6 1,795.4 96.2 45.8
2004 2,117.3 95.5 1,783.1 95.6 45.7
2005 2,116.1 95.4 1,785.4 95.8 45.8
2006 2,138.6 96.4 1,789.8 96.0 45.6
2007 2,129.3 96.0 1,772.7 95.1 45.4
2008 2,093.6 94.4 1,754.7 94.1 45.6
2009 2,025.1 91.3 1,722.8 92.4 46.0
2010 1,992.5 89.8 1,739.8 93.3 46.6
2011 2,021.0 91.1 1,738.0 93.2 46.2
2012 2,048.8 92.4 1,778.4 95.4 46.5
2013 2,103.7 94.8 1,789.0 96.0 46.0
2014 2,220.5 100.1 1,880.4 100.9 45.9
2015 2,283.5 103.0 1,927.0 103.4 45.8
2016 2,362.5 106.5 1,989.1 106.7 45.7
2017 2,417.3 109.0 2,004.1 107.5 45.3
2018 2,446.2 110.3 2,023.3 108.5 45.3
Source: 1990–91: KSH MEM, 1992–: KSH MEF.
Online data source in xls format: http://www.bpdata.eu/mpt/2019ent04_02
Figure 4.2: Employment by gender
Source: 1990–91: KSH MEM, 1992–: KSH MEF.
Online data source in xls format: http://www.bpdata.eu/mpt/2019ena04_02 0
500 1,000 1,500 2,000 2,500 3,000
2018 2016 2014 2012 2010 2008 2006 2004 2002 2000 1998 1996 1994 1992 1990
Females Males
In thousands
Table 4.3: Composition of the employed by age groups, males, per cent
Year15–19 20–24 25–49 50–54 55–59 60+
Total years old
2000 1.5 12.4 67.3 10.6 6.4 1.8 100.0
2001 1.2 10.4 68.6 11.1 6.7 2.0 100.0
2002 0.9 9.4 69.4 11.3 6.9 2.1 100.0
2003 0.7 8.6 69.1 11.8 7.3 2.5 100.0
2004 0.7 7.4 69.5 12.0 7.3 3.0 100.0
2005 0.6 6.8 68.9 12.7 7.9 3.1 100.0
2006 0.6 6.7 71.1 10.3 8.5 2.8 100.0
2007 0.5 6.7 71.3 10.2 8.4 2.9 100.0
2008 0.5 6.4 71.2 10.6 8.5 2.8 100.0
2009 0.4 5.7 70.6 10.9 9.3 3.1 100.0
2010 0.3 5.8 70.5 10.8 9.8 2.8 100.0
2011 0.3 5.5 69.8 10.9 10.0 3.5 100.0
2012 0.3 5.5 69.4 10.7 10.7 3.4 100.0
2013 0.4 6.1 68.6 10.3 10.7 3.9 100.0
2014 0.5 6.4 68.2 9.9 10.5 4.5 100.0
2015 0.7 6.3 67.3 10.0 10.1 5.8 100.0
2016 0.7 6.7 66.1 9.9 9.5 7.2 100.0
2017 0.6 6.6 65.6 10.4 9.0 7.8 100.0
2018 0.7 6.5 64.9 10.7 9.0 8.2 100.0
Source: KSH MEF.
Online data source in xls format: http://www.bpdata.eu/mpt/2019ent04_03
Table 4.4: Composition of the employed by age groups, females, per cent
Year15–19 20–24 25–49 50–54 55+
Total years old
2000 1.4 11.1 69.6 12.7 5.2 100.0
2001 1.1 9.6 70.5 13.1 5.7 100.0
2002 0.8 9.2 69.4 13.8 6.8 100.0
2003 0.5 8.2 68.8 14.0 8.5 100.0
2004 0.5 7.1 68.2 14.6 9.7 100.0
2005 0.4 6.3 67.7 15.4 10.2 100.0
2006 0.4 6.0 70.1 12.9 10.6 100.0
2007 0.3 5.8 70.0 13.1 10.8 100.0
2008 0.3 5.6 69.8 13.4 10.9 100.0
2009 0.2 5.4 69.1 13.5 11.8 100.0
2010 0.3 5.3 67.4 13.6 13.4 100.0
2011 0.2 5.1 66.4 13.4 14.9 100.0
2012 0.2 5.2 66.6 13.4 14.6 100.0
2013 0.3 5.1 67.1 13.1 14.4 100.0
2014 0.4 5.6 66.4 12.7 14.9 100.0
2015 0.4 6.1 65.6 12.5 15.4 100.0
2016 0.5 6.0 65.2 12.2 16.1 100.0
2017 0.5 5.8 65.4 12.2 16.1 100.0
2018 0.5 5.5 64.4 13.0 16.6 100.0
Source: KSH MEF.
Online data source in xls format: http://www.bpdata.eu/mpt/2019ent04_04
4 EmploymEnt Table 4.5: Composition of the employed by level of education, males, per cent
Year 8 grades of primary
school or less Vocational
school Secondary
school College,
university Total
2001 15.6 42.8 26.0 15.6 100.0
2002 14.6 43.2 26.4 15.8 100.0
2003 14.0 41.3 27.7 17.0 100.0
2004 13.0 40.4 28.0 18.6 100.0
2005 13.0 40.8 27.7 18.5 100.0
2006 12.3 41.0 28.2 18.5 100.0
2007 11.7 40.7 28.8 18.8 100.0
2008 11.7 39.4 29.1 19.8 100.0
2009 10.9 38.7 30.1 20.3 100.0
2010 10.6 38.3 30.6 20.5 100.0
2011 10.7 37.2 30.2 21.9 100.0
2012 10.6 36.8 30.1 22.5 100.0
2013 10.2 37.1 30.1 22.6 100.0
2014 11.1 35.8 30.6 22.5 100.0
2015 11.8 34.5 31.0 22.7 100.0
2016 11.9 34.6 31.6 21.9 100.0
2017 11.5 35.4 31.0 22.1 100.0
2018 11.4 35.6 30.4 22.6 100.0
Source: KSH MEF.
Online data source in xls format: http://www.bpdata.eu/mpt/2019ent04_05
Table 4.6: Composition of the employed by level of education, females, per cent
Year 8 grades of primaryschool or less Vocational
school Secondary
school College,
university Total
2001 19.1 21.3 40.3 19.3 100.0
2002 18.5 21.5 40.2 19.8 100.0
2003 16.4 21.5 40.9 21.2 100.0
2004 15.9 20.5 40.2 23.4 100.0
2005 15.4 20.2 40.0 24.4 100.0
2006 14.2 20.7 40.0 25.1 100.0
2007 13.5 21.2 40.0 25.3 100.0
2008 13.3 20.3 39.2 27.2 100.0
2009 12.5 19.8 39.3 28.4 100.0
2010 12.3 20.3 38.8 28.6 100.0
2011 11.7 20.1 38.0 30.2 100.0
2012 11.0 19.5 38.4 31.1 100.0
2013 10.9 19.6 38.1 31.4 100.0
2014 11.4 19.4 37.8 31.5 100.0
2015 11.5 19.1 37.4 32.0 100.0
2016 12.0 18.4 38.3 31.3 100.0
2017 12.4 18.6 38.4 30.6 100.0
2018 11.5 19.0 37.5 32.0 100.0
Source: KSH MEF.
Online data source in xls format: http://www.bpdata.eu/mpt/2019ent04_06
Table 4.7: Employed by employment status, in thousands
Year Employees Member of
cooperatives Member of other partnerships
Self-employed and assisting
family members Total
2004 3,347.8 8.1 136.6 407.8 3,900.3
2005 3,367.3 5.8 146.7 381.7 3,901.5
2006 3,428.9 4.8 128.0 366.7 3,928.4
2007 3,415.5 4.7 123.9 357.9 3,902.0
2008 3,378.4 2.6 120.9 346.4 3,848.3
2009 3,274.9 2.5 131.7 338.7 3,747.8
2010 3,272.7 2.9 137.6 319.3 3,732.5
2011 3,302.5 2.0 133.3 321.2 3,759.0
2012 3,378.1 2.3 144.3 302.5 3,827.2
2013 3,453.9 3.3 156.6 279.0 3,892.8
2014 3,652.0 3.6 157.3 288.0 4,100.9
2015 3,753.8 1.7 150.3 304.7 4,210.5
2016 3,884.4 0.9 147.1 319.2 4,351.6
2017 3,964.4 0.4 156.4 300.2 4,421.4
2018 4,003.9 0.4 148.7 316.5 4,469.5
Note: Conscripts are excluded. The participants of winter-time training programs within the Public Works Program are accounted as employees (contrary to the practice of STADAT).
There are differences in data for 2014 –2016.
Source: KSH MEF.
Online data source in xls format: http://www.bpdata.eu/mpt/2019ent04_07
Table 4.8: Composition of the employed persons by employment status, per cent
Year Employees Member of
cooperatives Member of other partnerships
Self-employed and assisting
family members Total
2004 85.8 0.2 3.5 10.5 100.0
2005 86.3 0.1 3.8 9.8 100.0
2006 87.3 0.1 3.2 9.4 100.0
2007 87.6 0.1 3.1 9.2 100.0
2008 87.7 0.1 3.2 9.0 100.0
2009 87.5 0.1 3.6 8.8 100.0
2010 87.7 0.1 3.7 8.5 100.0
2011 87.9 0.0 3.5 8.5 100.0
2012 88.3 0.1 3.8 7.9 100.0
2013 88.9 0.1 4.0 7.0 100.0
2014 89.1 0.1 4.0 6.8 100.0
2015 89.1 0.0 3.6 7.3 100.0
2016 89.3 0.0 3.4 7.3 100.0
2017 89.7 0.0 3.5 6.8 100.0
2018 89.6 0.0 3.3 7.1 100.0
Note: Conscripts are excluded. The participants of winter-time training programs within the Public Works Program are accounted as employees (contrary to the practice of STADAT).
There are differences in data for 2014 –2016.
Source: KSH MEF.
Online data source in xls format: http://www.bpdata.eu/mpt/2019ent04_08
4 EmploymEnt Table 4.9: Composition of employed persons by sector, by gender, per cent
2014 2015 2016 2017 2018
Males Fe-males Males Males Males To-
gether Males Fe- males To-
gether Males Fe- males To-
gether Males Fe- males To-
gether Agriculture, forestry and
fishing 5.0 1.7 3.5 5.3 1.9 3.7 5.4 1.9 3.8 5.5 1.8 3.8 5.1 2.0 3.7
Mining and quarrying 0.4 0.1 0.3 0.4 0.1 0.2 0.3 0.1 0.2 0.4 0.0 0.2 0.4 0.1 0.3 Manufacturing 28.1 18.0 23.3 27.4 18.0 23.0 27.5 18.1 23.1 28.4 18.6 23.8 28.0 18.4 23.6 Electricity, gas, steam and air
conditioning supply 1.4 0.6 1.0 1.3 0.4 0.9 1.2 0.5 0.9 1.2 0.5 0.9 1.4 0.5 1.0 Water supply; sewerage,
waste management and
remediation activities 2.2 0.7 1.5 2.1 0.7 1.5 2.3 0.7 1.5 2.1 0.6 1.4 2.1 0.6 1.4
Construction 10.0 1.0 5.7 10.2 0.9 5.8 10.1 0.9 5.8 10.5 1.1 6.2 11.7 1.3 7.0
Wholesale and retail trade;
repair of motor vehicles and
motorcycles 10.2 15.5 12.7 9.6 15.2 12.3 9.7 14.6 12.0 9.9 14.5 12.0 9.9 14.9 12.1 Transportation and storage 9.1 3.8 6.6 9.0 3.7 6.5 9.4 3.5 6.6 9.6 3.7 6.9 9.2 3.7 6.6 Accommodation and food
service activities 3.0 5.2 4.1 3.5 5.3 4.4 3.8 5.1 4.4 3.4 5.3 4.2 3.4 4.9 4.1 Information and communica-
tion 3.0 1.8 2.4 3.1 1.5 2.4 3.3 1.7 2.6 3.3 1.5 2.4 3.6 1.4 2.6
Financial and insurance
activities 1.6 3.0 2.3 1.3 3.0 2.1 1.5 3.0 2.2 1.7 2.6 2.1 1.4 2.8 2.0
Real estate activities 0.4 0.4 0.4 0.5 0.4 0.4 0.4 0.5 0.5 0.4 0.6 0.5 0.5 0.7 0.6 Professional, scientific and
technical activities 2.0 3.5 2.7 1.9 3.5 2.7 1.8 3.3 2.5 1.8 3.5 2.6 2.2 3.8 3.0 Administrative and support
service activities 4.1 3.0 3.6 4.3 2.9 3.6 4.2 3.2 3.7 3.7 3.1 3.5 3.6 3.1 3.4 Public administration and
defence; compulsory social
security 10.5 11.6 11.0 10.9 13.0 11.9 10.9 13.5 12.1 10.3 13.1 11.6 8.9 11.8 10.1
Education 3.8 14.1 8.7 3.6 13.6 8.3 3.2 13.7 8.1 3.5 13.4 8.0 3.5 13.5 8.1
Human health and social
work activities 2.5 11.9 7.0 2.5 11.6 6.8 2.4 11.7 6.8 2.2 12.1 6.8 2.7 12.3 7.1 Arts, entertainment and
recreation 1.5 1.6 1.5 1.7 2.0 1.8 1.4 2.1 1.7 1.4 1.8 1.6 1.4 2.0 1.7
Other services 1.2 2.4 1.8 1.2 2.3 1.7 1.2 2.1 1.6 1.1 2.1 1.5 1.1 2.2 1.6
Total 100.0 100.0 100.0 100.0 100.0 100.0 100.0 100.0 100.0 100.0 100.0 100.0 100.0 100.0 100.0 Source: KSH MEF.
Online data source in xls format: http://www.bpdata.eu/mpt/2019ent04_09
Table 4.10: Employed in their present job for 0–6 months, per cent
2000 2001 2002 2003 2004 2005 2006 2007 2008 2009 2010 2011 2012 2013 2014 2015 2016 2017 2018 Hungary 7.2 6.3 6.6 7.2 6.8 7.0 6.8 7.5 7.6 7.4 7.9 7.3 8.4 9.1 8.9 8.4 7.5 7.7 8.1 Source: MEF, IV. quarterly waves.
Online data source in xls format: http://www.bpdata.eu/mpt/2019ent04_10
Table 4.11: Distribution of employees in the competitive sector
aby firm size, per cent
YearLess than 20 20 –49 50–249 250–999 1000 and more
employees
2002 21.6 14.0 21.5 20.1 22.9
2003 23.0 15.3 20.5 19.3 21.8
2004 23.6 14.8 21.3 18.3 22.0
2005 27.0 15.0 20.5 17.5 20.0
2006 15.7 10.7 25.7 24.3 23.6
2007 25.2 14.2 20.0 18.4 22.2
2008 26.0 15.7 20.7 18.9 18.6
2009 23.4 15.7 19.7 18.4 22.8
2010 23.5 15.7 18.6 18.0 24.2
2011 24.9 15.6 18.5 17.7 23.4
2012 24.2 14.7 18.3 18.6 24.1
2013 23.2 14.5 18.1 19.0 25.2
2014 23.8 15.0 18.4 19.2 23.5
2015 24.0 15.4 18.5 17.9 24.2
2016 24.9 15.9 18.0 16.9 24.3
2017 24.4 16.1 17.4 16.6 25.5
2018 24.9 16.6 15.4 16.4 26.7
a Firms employing 5 or more workers.
Source: NFSZ BT.
Online data source in xls format: http://www.bpdata.eu/mpt/2019ent04_11
Table 4.12: Employees of the competitive sector
aby the share of foreign ownership, per cent
Share of foreignownership 2002 2003 2004 2005 2006 2007 2008 2009 2010 2011 2012 2013 2014 2015 2016 2017 2018 100% 17.7 16.5 17.7 18.6 19.0 19.4 20.4 17.5 19.2 20.2 21.1 21.8 22.9 20.6 20.8 20.8 20.6
Majority 9.2 8.8 7.8 8.5 7.5 7.4 6.4 6.3 5.4 5.7 6.5 7.8 5.1 5.6 4.7 3.8 3.3
Minority 3.6 3.9 3.8 3.1 2.2 2.9 2.2 1.7 1.9 1.6 1.5 2.9 2.2 1.9 1.8 1.7 1.6
0% 69.5 70.8 70.7 69.8 71.3 70.3 71.0 74.6 73.5 72.4 70.9 67.5 69.9 71.9 72.6 73.8 74.5
a Firms employing 5 or more workers.
Source: NFSZ BT.
Online data source in xls format: http://www.bpdata.eu/mpt/2019ent04_12
Figure 4.3: Employees of the corporate sector by firm size and by the share of foreign ownership
Source: NFSZ BT.
Online data source in xls format: http://www.bpdata.eu/mpt/2019ena04_03 0
20 40 60 80 100
1000–
250–999 50–249 –49
2018 2016 2014 2012 2010 2008 2006 2004
2002 0
20 40 60 80 100
100%
0%
2018 2016 2014 2012 2010 2008 2006 2004 2002
Minority Majority
Per cent Per cent
Share of foreign ownership Firm size
4 EmploymEnt Table 4.13: Employment rate of population aged 15–74 by age group, males, per cent
Year 15–19 20–24 25–49 50–54 55–59 60–64 65–74 Total
1999 10.6 60.3 80.5 69.0 44.0 10.4 3.8 56.2
2000 8.4 58.9 80.9 69.6 49.6 11.8 3.8 56.8
2001 7.9 56.7 81.6 68.2 51.3 13.1 3.1 57.1
2002 5.6 53.1 81.9 68.6 52.8 14.4 3.4 57.1
2003 4.8 51.8 82.2 69.7 55.2 16.8 3.8 57.6
2004 4.5 46.5 82.7 69.7 54.0 20.1 4.3 57.5
2005 4.0 43.6 82.5 70.1 56.6 20.9 4.2 57.4
2006 4.1 44.0 83.1 70.7 58.5 18.9 4.2 58.0
2007 3.7 44.0 83.4 71.0 57.3 18.0 4.7 57.8
2008 3.5 42.0 82.9 71.6 54.5 16.5 4.8 56.9
2009 2.4 36.7 80.5 70.5 56.1 16.7 5.0 55.1
2010 2.2 36.7 79.6 69.0 56.3 16.5 4.7 54.2
2011 2.4 36.1 81.0 71.2 56.9 17.4 4.4 55.0
2012 2.2 35.9 81.5 73.1 61.2 17.0 5.2 55.7
2013 2.8 40.8 82.6 74.2 64.9 21.1 4.9 57.4
2014 3.8 45.6 86.6 76.9 70.6 26.9 4.4 60.8
2015 5.9 46.6 87.9 80.5 73.9 35.3 4.6 62.7
2016 6.2 52.7 89.0 83.0 76.2 44.7 5.9 65.0
2017 6.4 55.6 90.7 86.6 77.5 49.6 6.3 66.9
2018 6.9 56.6 91.0 87.1 80.6 52.5 7.8 67.9
Source: KSH MEF.
Online data source in xls format: http://www.bpdata.eu/mpt/2019ent04_13
Table 4.14: Employment rate of population aged 15–74 by age group, females, per cent
Year 15–19 20–24 25–49 50–54 55–59 60–64 65–74 Total
1999 8.7 48.1 67.3 59.4 16.2 5.5 1.6 42.3
2000 8.0 45.9 67.8 62.5 20.0 5.1 1.8 43.0
2001 6.3 44.2 68.0 62.1 23.2 5.5 1.3 43.1
2002 4.3 44.2 67.0 64.0 28.3 6.0 1.5 43.3
2003 3.1 41.9 67.8 65.8 35.1 7.3 2.0 44.3
2004 2.7 37.4 67.2 66.0 39.8 9.0 1.9 44.1
2005 2.6 34.7 67.4 66.6 41.7 9.6 1.5 44.2
2006 2.5 33.6 67.8 67.5 42.4 8.5 1.6 44.4
2007 2.0 32.4 67.8 68.1 40.0 9.4 2.2 44.1
2008 1.8 31.3 67.8 68.7 38.7 9.8 2.3 43.8
2009 1.5 30.0 66.7 68.3 40.7 9.7 2.2 43.1
2010 1.9 30.3 66.6 69.4 46.6 9.5 2.4 43.6
2011 1.5 30.0 66.2 68.8 49.9 11.0 2.6 43.7
2012 1.4 31.3 68.3 72.7 49.7 11.2 2.6 44.9
2013 1.7 30.5 69.3 74.0 51.4 11.1 2.4 45.4
2014 3.0 35.2 72.3 77.9 56.8 13.4 2.3 48.0
2015 2.9 39.9 73.4 80.3 60.0 17.3 2.6 49.5
2016 3.9 41.8 75.3 81.6 64.7 21.9 2.9 51.3
2017 4.3 42.2 76.5 81.1 66.1 23.3 3.3 52.1
2018 4.6 41.4 76.5 84.0 68.2 26.4 3.9 52.9
Source: KSH MEF.
Online data source in xls format: http://www.bpdata.eu/mpt/2019ent04_14
Table 4.15: Employment rate of population aged 15–64 by level of education, males, per cent
Year 8 grades of primary
school or less Vocational
school Secondary
school College,
university Total
1998 35.0 75.3 67.0 84.9 60.4
1999 33.6 76.8 68.3 86.8 62.4
2000 33.6 77.4 67.9 87.1 63.1
2001 33.0 77.6 67.3 87.4 62.9
2002 32.0 77.6 67.1 85.8 62.9
2003 32.4 76.5 67.8 86.4 63.4
2004 31.0 75.7 67.3 87.1 63.1
2005 31.6 74.7 66.9 86.9 63.1
2006 31.4 75.6 67.7 86.0 63.9
2007 31.0 74.4 67.3 85.6 63.7
2008 31.1 72.4 66.1 84.3 62.7
2009 28.8 69.5 64.6 82.8 60.7
2010 28.1 67.7 64.2 81.8 59.9
2011 29.0 68.0 64.5 83.7 60.7
2012 30.0 68.7 64.6 84.4 61.6
2013 30.8 70.9 67.1 85.3 63.7
2014 36.3 74.8 71.2 87.1 67.8
2015 39.9 77.1 73.2 88.6 70.3
2016 42.5 80.1 76.1 90.5 73.0
2017 44.2 82.6 77.8 91.6 75.2
2018 45.8 83.9 77.9 91.9 76.3
Source: KSH MEF.
Online data source in xls format: http://www.bpdata.eu/mpt/2019ent04_15
Figure 4.4: Activity rate by age groups, males aged 15 –64, quarterly
Source: KSH MEF.
Online data source in xls format: http://www.bpdata.eu/mpt/2019ena04_04 0
20 40 60 80 100
2018 2017 2016 2015 2014 2013 2012 2011 2010 2009 2008 2007 2006 2005 2004 2003 2002 2001 2000 1999 1998 1997 1996 1995 1994 1993
60–64 55–59
50–54 25–49
20–24 15–19
Per cent
Quarterly
4 EmploymEnt Table 4.16: Employment rate of population aged 15–64
by level of education, females, per cent
Year 8 grades of primaryschool or less Vocational
school Secondary
school College,
university Total
1998 26.6 60.5 58.1 76.9 47.3
1999 26.1 61.4 59.0 77.5 49.0
2000 26.0 61.0 59.3 77.8 49.7
2001 26.1 60.8 59.2 77.8 49.8
2002 26.0 60.4 58.6 77.9 49.8
2003 25.3 59.7 59.5 78.3 50.9
2004 25.0 58.8 58.1 78.1 50.7
2005 25.1 57.6 57.9 78.9 51.0
2006 24.3 57.8 57.5 78.0 51.1
2007 23.6 57.2 57.2 75.5 50.7
2008 23.7 55.2 56.1 75.3 50.3
2009 22.7 54.0 54.6 74.2 49.6
2010 23.3 56.2 54.0 74.3 50.2
2011 22.5 56.1 53.9 74.6 50.3
2012 22.6 56.8 56.3 74.3 51.9
2013 23.7 57.1 56.6 74.2 52.6
2014 27.3 60.4 59.1 76.1 55.9
2015 28.7 62.3 61.3 77.3 57.8
2016 31.5 63.4 64.1 80.0 60.2
2017 33.7 64.6 65.2 78.9 61.3
2018 33.7 66.7 64.8 80.0 62.3
Source: KSH MEF.
Online data source in xls format: http://www.bpdata.eu/mpt/2019ent04_16
Figure 4.5: Activity rate by age groups, females aged 15 –64, quarterly
Source: KSH MEF.
Online data source in xls format: http://www.bpdata.eu/mpt/2019ena04_05 0
20 40 60 80 100
2018 2017 2016 2015 2014 2013 2012 2011 2010 2009 2008 2007 2006 2005 2004 2003 2002 2001 2000 1999 1998 1997 1996 1995 1994 1993
60–64 55–59
50–54 25–49
20–24 15–19
Per cent
Quarterly
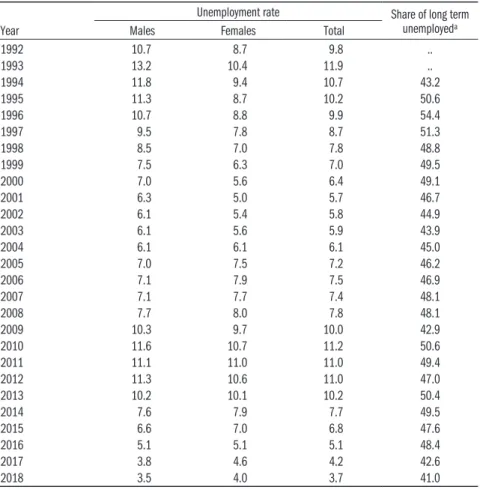
Table 5.1: Unemployment rate by gender and share of long term unemployed, per cent
YearUnemployment rate Share of long term unemployeda
Males Females Total
1992 10.7 8.7 9.8 ..
1993 13.2 10.4 11.9 ..
1994 11.8 9.4 10.7 43.2
1995 11.3 8.7 10.2 50.6
1996 10.7 8.8 9.9 54.4
1997 9.5 7.8 8.7 51.3
1998 8.5 7.0 7.8 48.8
1999 7.5 6.3 7.0 49.5
2000 7.0 5.6 6.4 49.1
2001 6.3 5.0 5.7 46.7
2002 6.1 5.4 5.8 44.9
2003 6.1 5.6 5.9 43.9
2004 6.1 6.1 6.1 45.0
2005 7.0 7.5 7.2 46.2
2006 7.1 7.9 7.5 46.9
2007 7.1 7.7 7.4 48.1
2008 7.7 8.0 7.8 48.1
2009 10.3 9.7 10.0 42.9
2010 11.6 10.7 11.2 50.6
2011 11.1 11.0 11.0 49.4
2012 11.3 10.6 11.0 47.0
2013 10.2 10.1 10.2 50.4
2014 7.6 7.9 7.7 49.5
2015 6.6 7.0 6.8 47.6
2016 5.1 5.1 5.1 48.4
2017 3.8 4.6 4.2 42.6
2018 3.5 4.0 3.7 41.0
a Long term unemployed are those who have been without work for 12 months or more, ex- cluding those who start a new job within 90 days.
Note: Conscripted soldiers are included in the denominator.
Source: KSH MEF.
Online data source in xls format: http://www.bpdata.eu/mpt/2019ent05_01
Figure 5.1: Unemployment rates by gender
Source: KSH MEF.
Online data source in xls format: http://www.bpdata.eu/mpt/2019ena05_01 3
6 9 12 15
2018 2016 2014 2012 2010 2008 2006 2004 2002 2000 1998 1996 1994 1992
Females Males
Per cent
5 Unemployment Table 5.2: Unemployment rate by level of education, males, per cent
Year 8 grades of primary
school or less Vocational
school Secondary
school College,
university Total
2000 13.4 7.7 4.8 1.6 7.0
2001 13.6 6.4 4.3 1.2 6.3
2002 14.1 6.2 4.0 1.4 6.1
2003 13.6 6.6 3.9 1.6 6.1
2004 14.3 6.4 4.1 1.7 6.1
2005 15.6 7.4 4.9 2.3 7.0
2006 17.3 7.0 5.1 2.6 7.1
2007 18.7 6.8 5.1 2.4 7.1
2008 20.2 7.7 5.2 2.3 7.7
2009 24.6 10.7 7.6 3.6 10.3
2010 27.2 12.2 8.3 4.9 11.6
2011 25.5 12.1 8.3 4.1 11.1
2012 25.3 12.0 9.6 4.2 11.3
2013 24.5 10.8 8.4 3.4 10.2
2014 18.4 7.8 6.2 2.8 7.6
2015 16.7 6.7 5.3 2.2 6.6
2016 13.7 4.9 4.0 1.8 5.1
2017 11.0 3.6 2.8 1.4 3.8
2018 10.3 3.2 2.9 1.5 3.5
Source: KSH MEF.
Online data source in xls format: http://www.bpdata.eu/mpt/2019ent05_02
Table 5.3: Composition of the unemployed by level of education, males, per cent
Year 8 grades of primaryschool or less Vocational
school Secondary
school College,
university Total
2000 32.9 45.8 17.9 3.4 100.0
2001 36.5 43.2 17.5 2.8 100.0
2002 36.7 43.3 16.7 3.3 100.0
2003 34.0 44.7 17.2 4.1 100.0
2004 33.9 42.6 18.6 4.9 100.0
2005 32.1 43.1 19.0 5.8 100.0
2006 33.4 40.3 19.9 6.4 100.0
2007 35.1 38.6 20.4 5.9 100.0
2008 35.9 39.4 19.2 5.5 100.0
2009 31.2 40.5 21.7 6.6 100.0
2010 30.3 40.5 21.1 8.1 100.0
2011 29.4 41.1 21.9 7.6 100.0
2012 28.1 39.3 24.9 7.6 100.0
2013 29.2 39.3 24.4 7.1 100.0
2014 30.6 37.0 24.5 7.9 100.0
2015 33.4 34.9 24.5 7.2 100.0
2016 34.9 33.2 24.6 7.3 100.0
2017 35.7 33.7 22.5 8.1 100.0
2018 35.6 32.8 24.2 7.4 100.0
Source: KSH MEF.
Online data source in xls format: http://www.bpdata.eu/mpt/2019ent05_03
Table 5.4: Unemployment rate by level of education, females, per cent
Year 8 grades of primaryschool or less Vocational
school Secondary
school College,
university Total
2000 9.1 7.4 4.9 1.5 5.6
2001 8.4 6.4 4.0 1.6 5.0
2002 9.3 6.5 4.4 2.4 5.4
2003 10.5 7.2 4.4 1.9 5.6
2004 10.3 8.0 5.3 2.9 6.1
2005 13.0 9.8 6.7 3.1 7.5
2006 16.2 10.4 6.5 2.7 7.9
2007 16.3 9.7 6.2 3.2 7.7
2008 17.4 9.6 6.8 3.1 8.0
2009 21.6 12.6 7.8 4.1 9.7
2010 22.8 12.6 9.6 4.3 10.7
2011 24.5 12.9 9.9 4.4 11.0
2012 24.4 12.7 9.4 4.7 10.6
2013 22.7 12.8 9.0 4.3 10.1
2014 18.7 9.3 7.1 3.4 7.9
2015 18.1 8.7 5.9 2.6 7.0
2016 12.7 6.8 4.3 1.8 5.1
2017 11.3 5.4 4.0 1.8 4.6
2018 11.7 4.3 3.6 1.8 4.0
Source: KSH MEF.
Online data source in xls format: http://www.bpdata.eu/mpt/2019ent05_04
Table 5.5: Composition of the unemployed by level of education, females, per cent
Year 8 grades of primaryschool or less Vocational
school Secondary
school College,
university Total
2000 31.8 28.2 35.0 5.0 100.0
2001 33.7 28.0 32.2 6.1 100.0
2002 33.2 26.0 32.2 8.5 100.0
2003 32.7 28.3 32.0 7.0 100.0
2004 27.8 27.4 34.2 10.6 100.0
2005 28.2 27.1 35.2 9.5 100.0
2006 31.8 27.9 32.3 8.0 100.0
2007 31.3 27.2 31.6 9.9 100.0
2008 32.3 24.7 33.0 10.0 100.0
2009 31.8 26.4 30.6 11.2 100.0
2010 30.5 24.4 34.3 10.7 100.0
2011 30.8 24.1 33.9 11.2 100.0
2012 29.8 23.8 33.5 12.9 100.0
2013 28.5 25.6 33.4 12.5 100.0
2014 30.5 23.1 33.4 13.0 100.0
2015 33.5 24.1 31.2 11.3 100.0
2016 32.4 24.9 31.8 10.9 100.0
2017 33.0 22.2 33.1 11.7 100.0
2018 32.8 20.8 33.0 13.4 100.0
Source: KSH MEF.
Online data source in xls format: http://www.bpdata.eu/mpt/2019ent05_05
5 Unemployment Figure 5.2: Intensity of quarterly flows between labour market status, population between 15–64 years
Employment Unemployment Inactivity
Note: The calculations were carried out for the age group between 15 –64 based on KSH la- bour force survey microdata. The probability of transition is given by the number of people who transitioned from one status to the other in the quarter, divided by the initial size of the group in the previous quarter, which were then corrected to preserve the consistency of stock flows. The red curves show the trend smoothed using a 4th degree polynomial.
Source: KSH MEF.
Online data source in xls format: http://www.bpdata.eu/mpt/2019ena05_02 Employment
Unemployment
Inactivity
60 70 80 90 100
60 70 80 90 100
2018 2016 2014 2012 2010 2008 2006 2004 2002 2000 1998
1996 0
1 2 3 4 5
0 1 2 3 4 5
2018 2016 2014 2012 2010 2008 2006 2004 2002 2000 1998
1996 0
1 2 3 4 5
0 1 2 3 4 5
2018 2016 2014 2012 2010 2008 2006 2004 2002 2000 1998 1996
0 5 10 15 20 25
0 5 10 15 20 25
2018 2016 2014 2012 2010 2008 2006 2004 2002 2000 1998
1996 60
70 80 90 100
60 70 80 90 100
2018 2016 2014 2012 2010 2008 2006 2004 2002 2000 1998
1996 0
5 10 15 20 25
0 5 10 15 20 25
2018 2016 2014 2012 2010 2008 2006 2004 2002 2000 1998 1996
0 1 2 3 4 5
0 1 2 3 4 5
2018 2016 2014 2012 2010 2008 2006 2004 2002 2000 1998
1996 0
1 2 3 4 5
0 1 2 3 4 5
2018 2016 2014 2012 2010 2008 2006 2004 2002 2000 1998
1996 60
70 80 90 100
60 70 80 90 100
2018 2016 2014 2012 2010 2008 2006 2004 2002 2000 1998 1996
Table 5.6: The number of unemployed
aby duration of job search, in thousands
YearLength of job search, weeks [month]
Total 1–4
[<1] 5–14
[1–3] 15–26 [4–6] 27–51
[7–11] 52
[12] 53–78 [13–18] 79–104
[19–24] 105–
[>24]
1992 43.9 90.9 96.4 110.7 10.6 41.7 38.4 n.a. 432.6
1993 36.2 74.8 87.9 120.5 14.7 75.1 83.7 n.a. 492.9
1994 30.5 56.5 65.0 91.9 8.4 63.0 73.8 40.4 429.5
1995 23.0 51.0 56.5 69.4 20.2 57.2 34.3 93.2 404.8
1996 19.9 46.4 49.3 61.5 18.2 56.1 37.1 100.2 388.7
1997 16.1 43.7 45.9 54.4 15.7 44.5 31.1 77.3 328.7
1998 12.9 44.2 44.5 45.7 16.0 39.0 27.6 63.5 293.4
1999 15.4 44.1 38.8 46.0 13.2 38.1 26.8 62.3 284.7
2000 16.7 38.5 35.1 42.8 12.7 36.9 23.6 55.4 261.3
2001 14.9 37.0 33.2 38.6 11.5 31.6 20.9 44.2 231.9
2002 15.5 39.4 34.8 40.7 11.6 32.7 19.8 42.5 237.0
2003 15.9 42.1 38.9 42.0 14.5 27.6 17.6 43.0 241.6
2004 13.0 42.0 39.9 41.8 13.5 33.4 19.6 47.2 250.4
2005 14.8 48.9 44.1 51.3 14.1 41.0 27.4 54.3 295.9
2006 13.2 51.1 48.5 52.0 17.9 41.1 26.6 59.7 310.0
2007 13.9 49.5 44.2 50.5 12.8 42.8 26.2 65.1 304.9
2008 13.5 50.3 47.9 53.4 13.5 39.1 26.3 74.0 317.9
2009 18.7 71.4 66.6 77.5 18.4 51.3 27.1 79.0 410.0
2010 16.9 65.4 62.5 83.5 23.2 74.7 42.6 93.7 462.5
2011 28.9 70.7 62.8 70.0 18.0 64.7 40.1 103.7 458.9
2012 39.2 64.0 63.1 80.5 22.2 59.5 36.6 100.9 466.0
2013 48.2 49.4 53.7 62.1 25.3 49.8 45.0 97.1 430.7
2014 36.5 41.5 44.9 46.3 19.0 35.1 29.2 82.7 335.3
2015 30.9 43.0 38.6 44.0 18.2 30.0 23.7 69.6 298.0
2016 28.9 29.8 29.3 29.4 12.2 24.1 20.4 52.8 226.9
2017 24.2 29.9 26.0 25.2 9.2 19.0 14.0 35.8 183.3
2018 22.5 26.7 24.7 21.6 9.5 14.7 11.7 30.7 162.1
a Not including those unemployed who will find a new job within 30 days; since 2003: within 90 days.
Source: KSH MEF.
Online data source in xls format: http://www.bpdata.eu/mpt/2019ent05_06
5 Unemployment Figure 5.3: Unemployment rate by age groups, males aged 15 –59, quarterly
Source: KSH MEF.
Online data source in xls format: http://www.bpdata.eu/mpt/2019ena05_03
Figure 5.4: Unemployment rate by age groups, females aged 15 –59, quarterly
Source: KSH MEF.
Online data source in xls format: http://www.bpdata.eu/mpt/2019ena05_04 0
1 2 3 4 5
2018 2016 2014 2012 2010 2008 2006 2004 2002 2000 1998 1996 1994
55–59 50–54
25–49 20–24
15–19
Log of the unemployment rate
Quarterly
0 1 2 3 4 5
2018 2016 2014 2012 2010 2008 2006 2004 2002 2000 1998 1996 1994
55–59 50–54
25–49 20–24
15–19
Log of the unemployment rate
Quarterly