I
Dániel Molnár – Diána Horváth – Gábor Regős
W-shaped Recovery in the Two Waves
of the Coronavirus Pandemic
Summary: Our study aims to examine what course the coronavirus crisis took in certain areas, using macroeconomic data and a household and business survey. Our results suggest that the virus has affected different sectors to varying degrees: while some sectors have experienced rapid recovery, others have been characterised by a protracted crisis. The second wave of the coronavirus in the autumn also resulted in a decline in economic data, but to a lesser extent than the first wave in the spring.
Overall, the course of the crisis can be considered W-shaped, although some aspects and sectors show a different picture.
However, as the viral situation improves, it will be an important task of economic policy to ensure that the last stem of the W is steep, i.e. that the Hungarian economy can return to its previous growth trajectory. To this end, it is essential to lift restrictions, so that household consumption can once again become the engine of growth, and to increase the willingness of companies to invest.
KeywordS: coronavirus, economic crisis, economic outlook, crisis waves.
JeL codeS: E60, E61, H12, I15
doI: https://doi.org/10.35551/PFQ_2021_1_4
in the wake of the coronavirus pandemic, that spread in china in late 2019 at first, and then all around the world in early 2020, the economic crisis long expected by economists finally arrived, putting an end to a prosperity of unprecedented length. However, the crisis was not a product of the economy; it was triggered by an external factor, the covid-19 virus and the government measures taken to control it. At the beginning, some experts predicted a rapid recovery as soon as the pandemic
is fought off, saying that as the decline in output was not triggered by an economic problem, output would soon return to its pre- crisis level. However, today it is obvious that these thoughts were far too optimistic. With the outbreaks of newer and newer waves of the virus, the economy has not been able to steadily recover, and at the beginning of 2021, we cannot yet see when the restrictions can be finally lifted as a result of the vaccination that has just started.
in Hungary, the coronavirus appeared in two waves until January 2021: in the spring and in the autumn of 2020. Both periods were accompanied by significant government E-mail address: molnar.daniel@szazadveg.hu
horvath.dia@szazadveg.hu regos@szazadveg.hu
measures, but the reactions of economic operators were fairly different in these two periods. in this article, we present the results of our surveys conducted among households and businesses with monthly frequency from April 2020 to January 2021, specifically concentrating on the impacts of the pandemic, describing the differences between the two waves and drawing some conclusions about the expected economic course.
The next part of the study presents the literature related to the development of crises and the recovery from them. Afterwards, we describe the two waves of the crisis, first in light of macroeconomic data, and then in light of household and business-related surveys. Finally, we summarise the key results of the study.
REcOvERy mETHOds and EcOnOmIc REacTIOns
At the time of the outbreak of the crisis, the economics profession was under the spell of letters, as everybody attempted to determine what recovery courses the economies might take after the pandemic. For better illustration, these courses were marked with the letters of the alphabet (Z, V, W, u, l) by the experts (sheiner, Yilla, 2020). Based on the most optimistic scenario – excluding the Z-shape that existed in the dreams of economists only –, the pandemic will be overcome quickly, and the decline in economic performance will be followed by an equivalent upturn (V-shape).
in case the upturn does not come immediately, and the nadir takes longer, but the economy ultimately returns to the performance it had before the crisis, a course in the shape of a u emerges. The W-shaped course means a scenario that is more pessimistic than the previous ones. in this case, upturns and downturns follow each other as a result of the new waves of the pandemic. The most pessimistic case is
represented by an l-shaped course, where the level of economic activity after the regression is unable to return to the level it had before the crisis, and it is stabilised at a lower level.
At the beginning (MnB, 2020; oxford economics, 2020), some experts expected a rapid recovery (V-shape) because of the exogenous nature of the crisis, supposing that the unprecedented efforts would facilitate a quick recovery in economic growth.
Today, however, it is already clear that these views were much too optimistic, and it was impossible to permanently control the spread of the virus, even with the measures taken by the government. so the virus returned again and again, making rapid recovery impossible.
Based on the data that has been collected since the outbreak of the pandemic, the majority of economists expects a lengthy economic recovery. According to the international Monetary Fund (iMF) forecast of January 2021 (iMF, 2021), the output of the world economy may reach its pre-crisis level already in 2021, mainly because of the faster recovery in emerging economies. However, in developed economies, particularly in the eurozone, this may only happen in 2022. At the same time, in spite of the vaccines that are now available more and more widely, the new waves of the pandemic and the emerging variants of the virus still present significant risks to growth. The December 2020 forecast of the european central Bank (ecB, 2020) also suggests that the economic performance of the eurozone could only reach its pre-crisis level by the middle of 2022, following a recovery that started in Q3 2020 and was blocked by the second wave at the end of the year, so the second upswing will only come in 2021.
This would mean a classic W-shaped recovery chart. on the other hand, the commencement of the third wave and the restrictive measures triggered by may block the improving trends both in Hungary and several other countries.
The W-shaped recovery is true for the economy as a whole only, as individual sectors may expect different 'recovery'. For instance, in november 2020, industrial production in the whole eurozone was only 0.6 percent less year on year, while some service sectors – such as tourism – are still in a hopeless situation. A recovery course that splits into two directions within the structure of the economy can be basically compared to the letter K.
it must be understood, however, that recovery is determined by multiple factors.
Czeczeli et al. (2020) say that in the present crisis, because of its exogenous nature, the initial state plays a much smaller role in its depth than in the case of a classic endogenous crisis, such as the financial crisis of 2008.
in the present crisis, the extent of decline is determined by the pandemic control measures and not by economic factors, so the recovery is primarily determined by the rate and the extent of governments lifting the restrictions (Posgay et al., 2020).
However, lifting the restrictions does not in itself mean that the economy returns to its previous growth course. An economic growth that lags behind the pre-crisis trend is called hysteresis in academic literature. Posgay et al.
(2019) point out that reduced spending in the wake of excessive indebtedness, the early controlling of fiscal expansion, the inappropriate coordination of monetary and fiscal policy and the lack of international coordination lead to hysteresis. As a result of the uncertain economic environment, the willingness to invest declines and cautiousness strengthens. investments dropped in 2020, too, but it would be too early to draw any conclusions about the emergence of hysteresis, as we do not know how much of the investments will be postponed by only a few months or a year, and how much of them will be cancelled.
From the aspect of recovery, consumer and corporate trust will play vital roles. Trust
plays a key role in making economic decisions.
According to Akerlof and Shiller (2009), the investment decisions of economic decisions- makers are greatly influenced by the extent of trust. Trust, however, is not rational; it constantly changes, sometimes with reason, and sometimes without reason. The authors worked out the concept of confidence multiplier pursuant to Hicks. it shows how incomes change when trust changes. The value of the confidence multiplier is not constant, though, it is much higher in times of crises than in times of recovery. low confidence on the whole entails less spending, which is critical for the recovery. in the present situation, this means that from the aspect of both businesses and households, recovery is possible when these operators believe that after the restrictions have been lifted, they will not be introduced again later. The confidence multiplier effect is especially interesting in the present situation: although reduced spending and increased savings can be observed in the data, this is partly due to the unavailability of certain services.
in foreign literature, we can find the results of multiple surveys conducted among households and businesses, and they all attempted to map the responses given to the pandemic situation and the expectations of economic operators.
Hanspal, Weber and Wohlfart (2020) conducted a representative survey in early April 2020 with the involvement of more than 8 thousand households in the united states. The research found that the income shock hit poorer and younger households harder, while the financial assets shock (as a result of the stock market crash in February/March) affected households with savings, although they found it easier to handle the emerging difficulties. The expected expenses of households were affected by the income shock only, while the shock affecting the financial assets had no significant impact. in addition, the authors found that
information related to the recovery of share markets after previous crises also influenced the expectations of respondents about the present recovery. The expectations about the present recovery of the share market show a relation to the view held by households about their own economic outlooks.
in another attempt, Buchheim et al. (2020) conducted a representative survey among almost 6 thousand German companies in April 2020 about the outlook of companies in relation to the crisis and company strategies to counter economic recession. The authors found that companies that had a worse economic situation before the outbreak of the crisis suffered a bigger setback because of the coronavirus outbreak, and their expectations were more negative, too. in addition, the expectations about the length of the lockdown did not explain the rate of the initial decline, but there seemed to be a positive relation between the length of the lockdown and the expected drop in incomes. expectations about the length of the lockdown also influenced the applied company strategies. companies that expect a longer lockdown tend to apply stronger measures (dismissal of staff, stopping investments), and these have higher fixed costs. on the other hand, the relatively cheaper solutions – such as the introduction of home office or the application of part-time employment – do not depend on the expected length of the lockdown. similarly, a more unfavourable pre-crisis business situation forces companies to take strong measures, because of their worse liquidity position.
cRIsIs In THE sHadOW OF THE cOROnavIRus
The two waves of the pandemic experienced until January 2021 had different impacts on the operation of the economy. in this
chapter, we use the statistical data available in a monthly breakdown to present the different impacts of the two waves of the pandemic on the economy.
Although the coronavirus pandemic started only in March 2020 in Hungary, and the wide- ranging restrictions were only introduced in the middle of the month, the performance of the industry – as a result of the pandemic unfolding in the rest of the world and the cumbersome or broken supply chains – had to face the difficulties earlier. Based on Figure 1, we can see that a year-on-year reduction happened only in March (−5.6 percent) in Hungary. Afterwards, sectoral production reached its lowest point in April, when, as a result of the lockdown, production was almost 40 percent less than in the same month of the previous year. Following the restart of the economy, the industry started to gradually work off the setback, and in september 2020, its production exceeded the base period by 2.3 percent. The arrival of the second wave in the autumn – based on the data published until the time of writing this study (February 2021) – did not cause any decline in the industry: in December 2020, production was 5.8 percent higher than in December 2019.
looking at the subsectors of the industry, the greatest setback was suffered by the significant processing industry, where year-on- year production dropped by 38.4 percent in April 2020. This was primarily caused by the 79.7 percent decline in vehicle production.
The drop in the production of textiles, clothes, leather and leather products, coke production, crude oil processing (−43.7 percent and −40.7 percent respectively) was also significant, however, their importance is low within the processing industry. The only sector that was able to grow at the start of the first wave in Hungary was pharmaceutical production, where production exceeded the level achieved in the same period of the previous year by
21.7 percent. in the case of the second wave, we can see a different picture: the performance of certain sectors exceeded the previous year, even in spite of the new wave of the pandemic, while the situation deteriorated further in other sectors. in november, on the top of the second wave, vehicle production was already 7.4 percent over the relevant level of 2019, but the sector of electric equipment production also reached a significant growth of 27.2 percent. on the other hand, in the case of the production of textiles, clothes, leather and leather products, as well as coke production and crude oil processing, drops of 8.8 and 8.4 percent, respectively, were detected. The production in the processing industry was 3.6 percent higher in november 2020 than in november 2019. in the last month of last year, recovery continued in most sectors
of the processing industry, but the volume of production dropped, for example, in the production of textiles, clothes, leather and leather products, computers, electronic and optical products. Although the reason for the increasing production might as well be stock- piling only, this is not what the data shows, as the volume of industrial sales increased at the end of the year. it is obvious that different courses can be detected in the industrial sectors: there are sectors in which recovery (V-shape) started, and there are sectors where production did not reach the previous year’s level (l-shape or u-shape). Based on that, for the whole industry, a K-shaped recovery course emerged.
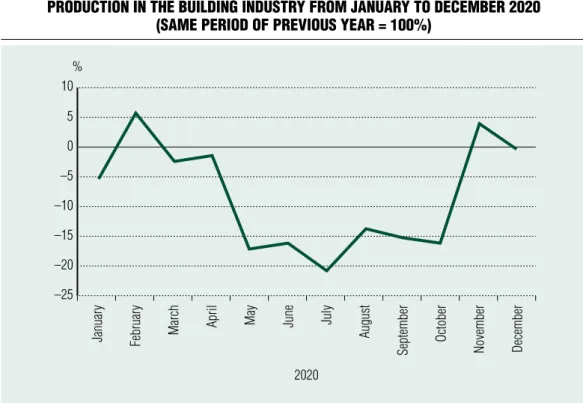
in the case of the building industry, the coronavirus outbreak made its effects felt first in May 2020, as indicated in Figure 2.
IndustrIal productIon from January to december 2020 (same perIod of prevIous year = 100%)
% 10
5 0 –5 –10 –15 –20 –25 –30 –35 –40
January February march april may June July august september October november december
2020
Source:: HcsO sTadaT 4.2.2.1. table
in April, production was only 1.2 percent less than it was in the same period of the previous year, but in May, the setback was already 17.4 percent. The performance of the building industry reached its lowest point in July, when it was 21.0 percent lower than in the same month of 2019. Afterwards, recovery started, however, compared to the base period, the performance of the sector was still 16.3 percent less in october. on the other hand, by november 2020, the performance of the building industry already exceeded the same period of the previous year by 4.0 percent, then, by the last month of the year, it fell again to 0.3 percent. What we can see is that the completion of works in progress allowed the impact of the crisis to appear with a certain delay, but this made the recovery longer, too.
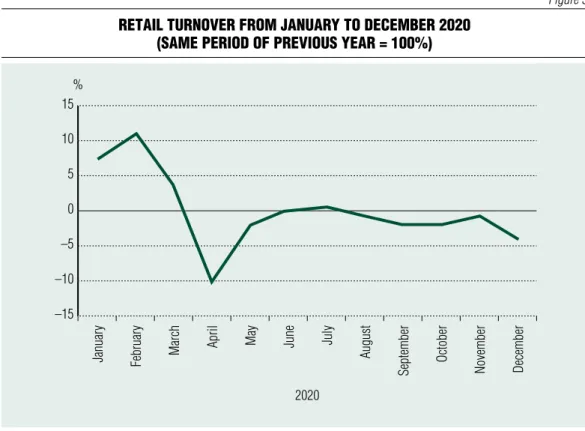
in the case of retail turnover, significant growth can be observed in February 2020, owing to the shopping spree: based on the data cleared of the calendar effect, the volume was 11.2 percent higher compared to the same period of the previous year (Figure 3).
subsequently, with the introduction of the pandemic emergency situation and the related restrictions, turnover went down and reached its lowest in April, when it was 10.2 percent below the level of the previous year.
subsequently, turnover recovered, and in July 2020, it was already 0.4 percent higher than in the same month of 2019. However, at the end of the summer and at the beginning of the autumn, retail turnover dropped again, and in october, it was already 2.0 below the value of the base period. By november, it was possible to work off this decline to some
Figure 2 productIon In the buIldIng Industry from January to december 2020
(same perIod of prevIous year = 100%)
% 10
5 0 –5 –10 –15 –20 –25
January February march april may June July august september October november december
2020
Source: HcsO sTadaT 4.3.1. table
extent: at that time, turnover was only 0.7 percent lower compared to the previous year.
in December, turnover dropped again, and it was 4.0 percent lower than in the same period of the previous year. in other words, while the first wave was followed by a shopping spree and a collapse, the sector had a more stable performance in the second wave, although the restrictions had some, although minor, effects here, too. The processes were different in each type of store. The turnover in grocery stores and mixed but mainly grocery-type stores did not really decrease in the first wave, and showed an increase in the second half of the year. As opposed to that, trade in textiles, clothes and footwear, furniture, technical articles, as well as books, newspapers and stationery suffered significant setbacks of 89.8, 23.8 and 67.4 percent, respectively, in the first
wave (April). These types of shops were unable to reach the previous year’s performance in the second wave, either; they remained 20 percent below that. similar processes can be seen in the turnover of shops selling iT and other industrial products, while the sale of pharmaceutical products and therapeutic articles had its lowest in May (−14.1 percent), and then increased in the second half of the year. similarly to industrial production, the trends in retail during the crisis were characterised by a K-shaped recovery in the two waves.
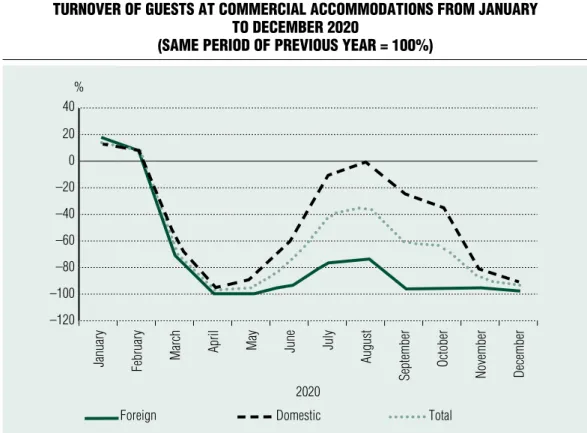
The sector hit hardest by the virus was tourism, which lost almost all of its turnover because of the closed borders and lockdowns.
As to the number of guests at commercial accommodations (Figure 4) dropped by 97.8 percent in April: foreign guests almost retaIl turnover from January to december 2020
(same perIod of prevIous year = 100%)
% 15 10 5 0 –5 –10 –15
January February march april may June July august september October november december
2020
Source:: HcsO sTadaT 4.4.11. table
completely disappeared (−99.4 percent), but domestic guests did not really come, either (−96.3 percent). some improvement was detected in the summer months, particularly in the number of domestic guests, which was only 1.4 percent below the previous year’s level in August 2020, while the number of foreign guests dropped by 73.2 percent. The second wave of the virus made turnover collapse again. in December 2020, the number of guests at commercial accommodations was 94.7 percent less than a year before. This means that a classic W-shaped crisis can be seen in tourism in the wake of the coronavirus pandemic. The second upward leg of the W will be significantly influenced by the pace of lifting the restrictions and the trends in travelling mood.
From the aspect of the population’s income, it is essential to see how employment developed in the two waves of the pandemic. Figure 5 shows the monthly data of the Hungarian central statistical office (Hcso),1 based on which employment dropped already at the beginning of 2020, primarily due to the global recession. in this case, the lowest point was reached in April, too, when the number of people employed dropped to 4,368,000, which was 3.0 percent below the data of the previous year. Although the number of people employed increased to some extent in May, the rate of annual decline was not smaller. By the end of the summer, the number of people employed was close to the level of the previous year, but there was a drop again in early autumn.
The restrictions introduced in november had Figure 4 turnover of guests at commercIal accommodatIons from January
to december 2020
(same perIod of prevIous year = 100%)
% 40 20 0 –20 –40 –60 –80 –100 –120
January February march april may June July august september October november december
2020
Foreign domestic Total
Source: HcsO sTadaT 4.5.15. table
no major impact on employment; the rate of the annual decrease was only 0.6 percent.
in the area of employment, we can mainly see a V-shaped crisis. However, if we look at the number of hours worked by an employee on average, it is rather a W-shaped crisis – meaning that a lot of companies retained their employees, but some of them were not able to do full-time work. While in February 2020, the weekly average working hours of employees were only 0.1 hour less than a year before, this value increased to 1.1 by March, and to 4.3 hours by April. The signs of consolidation also appeared here in May, when the difference was only 2.2 hours, which was reduced to 0.4 hours by June. in the second wave, the weekly average working hours in october were 1.6 hours higher than a year before, however, in november, this value was
0.8, and in December, 4.7 hour less than in 2019.
HOusEHOlds’s and cOmPanIEs’
REacTIOns TO THE cOROnavIRus Research methodology
From April 2020 to January 2021, we conducted surveys among households and businesses with monthly frequency, interviewing 1000 households and 1000 company managers. in these surveys, we asked questions specifically about the coronavirus, and used the cATi (computer Assisted Telephone interview) method. The composition of the household sample corresponds to the composition of the adult Hungarian population according to number of people employed
thousand people 4550 4500 4450 4400 4350 4300 4250
January February march april may June July august september October november december January February march april may June July august september October november december
2019 2020
Source:: HcsO Heti monitor
sex, age, education and type of community.
The business survey primarily focuses on sMes. in the sample, the breakdown by industry corresponds to the ratio within the gross added value. When we recorded the data, 85 percent of the businesses were micro companies, 8 percent were small companies, 6 percent were medium-size companies and 1 percent were large companies. 4.2 percent of the businesses involved in the survey belonged to the agricultural sector, 7.2 percent to the industrial sector, 9.3 percent to the building industry, 17.6 percent to the commercial sector and 61.6 percent to the service sector.
Because of the sampling, the data provided in the study may divert from the result that would have been achieved by asking all the adult population and all the companies in the country, and the rate of the difference is plus-minus 3.1 percentage points in the case of households, and maximum 2.2 percentage points in the case of businesses. The questions were formulated in a way that an accurate picture could be obtained about attitudes and expectations related to the virus.
in addition to presenting the percentages, the data was transposed for each question to a scale from −100 to +100, creating an index value. For each question, the neutral answer had a value of 0 point, the very positive answer earned +100 points, the very negative answer earned −100 points, the slightly positive answer earned +50 points, and the slightly negative answer earned −50 points.
Households’ reactions
in the case of households’ reactions, it is worth examining personal experiences regarding the virus before looking at the economic impacts, as the nature of the present crisis is such that recovery is strongly influenced by the assessment of the pandemic situation, too.
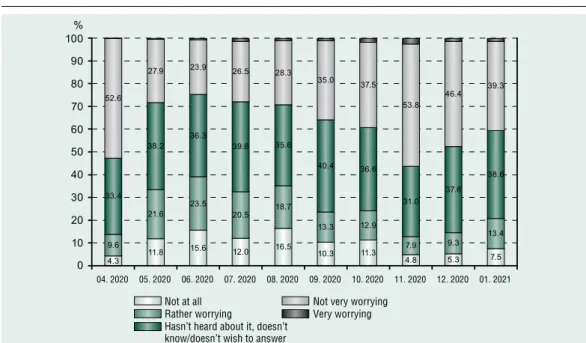
As to the number of cases, households are able to identify the danger of the spread of the coronavirus fairly accurately. it can be seen (Figure 6) that after the end of the first wave, fear subsided from May (the value of the index dropped from −60.3 in April to −24.5 points), which was followed by stagnation as a whole in the summer months. The fear of the spread of the virus started to increase in september, when the second wave started, and reached its top in november, in parallel with the number of cases, at −62.0 points, only to start decreasing again at the end of the year and in early 2021 to −45.0 points until January.
Thus, households’ reactions to the pandemic situation accurately reflect the spread of the virus: reactions are stronger at the peaks of the two waves, and rapidly go down after that. At the same time, regarding the lowest points, no difference can be seen between the two waves, but recovery is slower after the second wave, which can be explained with the slower termination of the second wave and the sustainment of restrictions.
From a demographic point of view, we can see that in April, mostly women, people with low qualifications, elderly people, people living in Budapest and people living in villages had a negative assessment of the spread of the coronavirus. The results of the survey conducted in november were different in respect of education only, as the most negative answers were given by people with college or university degrees.
The increase in the number of cases can be clearly detected from the answers given to another question, too. We also asked respondents if there were any people infected with the coronavirus among their friends. in April, only 3-7 percent of respondents said yes to this question; this ratio fluctuated between 3 and 6 percent until the end of the summer.
Afterwards, the ratio of positive answers increased rapidly, in December, already 43.2
In your opInIon, how worryIng the problem of the spread of the coronavIrus pandemIc Is?
Source: own survey
Figure 7 how lIkely do you thInk It Is that the coronavIrus pandemIc wIll cause an
economIc crIsIs In hungary?
Source: own survey
04. 2020 05. 2020 06. 2020 07. 2020 08. 2020 09. 2020 10. 2020 11. 2020 12. 2020 01. 2021
Not at all Not very worrying
Rather worrying Very worrying
Hasn’t heard about it, doesn’t know/doesn’t wish to answer
Not at all Very likely
Not really likely Doesn’t know/doesn’t wish to answer More likely
04. 2020 05. 2020 06. 2020 07. 2020 08. 2020 09. 2020 10. 2020 11. 2020 12. 2020 01. 2021
percent of people gave a positive answer, while in January, as a result of less cases, only 35.4 percent.
We used several questions to examine the general impact of the virus on the economy.
The first question focused on the issue whether the person found it likely that the coronavirus pandemic would cause an economic crisis in Hungary. Figure 7 illustrates the breakdown of answers given to this question. it is not only the perception of the population that makes the analysis of this issue important: if the majority of households expects a crisis, that may impact economic processes as a self- fulfilling prophecy
in April, 91.9 percent of respondents found it likely or rather likely that the coronavirus would cause an economic crisis (index value of −71.7). in other words, the emergence of the first wave was assessed negatively by the majority of respondents, but the population’s perception improved by october. The index value increased to −41.9 points, then dropped to −51.2 in november, because of the new restrictions. The data of november, which is more favourable than the data of April, can be explained, on one hand, with the fact that the economy was restricted much less during the second wave then in the first wave, and, on the other hand, most sectors of the economy were able to restart after the first wave. The situation further improved until January, and the index value increased to −32.8 points. Thus, the W-shape can be detected here, although not in a symmetric way, as the population thought the situation was more serious in the first wave.
As we have already mentioned, the negative expectations of the population may trigger a crisis as a self-fulfilling prophecy. For instance, if the vast majority of households expect a decline in their income in the near future, and start saving money, aggregate demand will drop, together with incomes. in relation to that, it is worth examining what households
thought of their own incomes in the two waves of the coronavirus pandemic. We asked two questions about it: what will be the impact of the pandemic on their financial situation (Figure 8), and on their employment (Figure 9).
in April, a slight majority people expected deterioration in their financial standing after the pandemic (52.8 percent), but their ratio started to go down already in May, and it did not increase to more than 50 percent, even in the second wave (47.5 percent).
it is also favourable that the ratio of people giving negative answers declined quickly after november, so in January, only 34.1 expected deterioration in their household’s situation because of the pandemic. This is a positive outlook from the aspect of recovery, as it shows that spending by households is not constrained by people’s fears about their financial standing, but by the restrictions introduced to control the pandemic. As soon as the restrictions are lifted, consumption may become the engine of growth again. At the same time, from the aspect of demand after the restart, it presents some risks that more than 30 percent of people expect deterioration in their financial standing, which may increase cautiousness in the area of spending. This is where the issue of the confidence multiplier appears, and the situation is similar to the previous questions:
we can detect a W-shaped crisis, in which the first nadir is lower than the second.
The assessment of the employment position is closely related to the assessment of the income position. in April, 36.5 percent of the people asked were afraid to some extent that they or one of their family members might lose their jobs, but the majority of people (49.7 percent) did not worry about this. in other words, the majority felt their jobs were fairly stable in the first wave of the pandemic. This perception further strengthened in the following months:
in June, already 62.0 percent had this opinion.
However, the ratio of people giving positive
how lIkely do you thInk It Is that the coronavIrus pandemIc wIll cause deterIoratIon In the sItuatIon of your household?
Source: own survey
Figure 9 are you afraId that you or somebody from your famIly may lose hIs/her Job
In the next 6 months because of the coronavIrus pandemIc?
Source: own survey
04. 2020 05. 2020 06. 2020 07. 2020 08. 2020 09. 2020 10. 2020 11. 2020 12. 2020 01. 2021
04. 2020 05. 2020 06. 2020 07. 2020 08. 2020 09. 2020 10. 2020 11. 2020 12. 2020 01. 2021
Not at all Very likely
Not really likely Doesn’t know/doesn’t wish to answer More likely
Not afraid at all Already lost his/her job
Not really afraid Not affected/doesn’t work
A little afraid Doesn’t know/doesn’t wish to answer
Very afraid
answers started to decline until november, while the ratio of people giving negative answers increased, therefore, on the top of the second wave, respondents had similar opinions about the security of their jobs than in April.
We can also observe an improving trend here from December, which is also favourable for the recovery. Thus, in respect of the assessment of the employment situation, a symmetric W-shaped crisis can be detected.
in relation to this question, it is worth looking at the ratio of people giving the answer 'already lost my job'. in April, 10.0 percent selected this answer, and this ratio increased to 11.4 in May, then, in the rest of the year, it was around 6.4 percent. it basically shows that the coronavirus pandemic affected a wide range of jobs, however – as indicated by statistical data, too –, the outbreak of the pandemic did not go hand in hand with a dramatic
rise in unemployment. This can primarily be explained with the economic situation we had before the pandemic, when there were a lot of vacant jobs due to the shortage of labour, and people who lost their jobs were able to take these jobs even in the deteriorating economic situation, so unemployment was only a temporary problem in the economy.
Another aspect worth paying attention to is the development of inflation expectations.
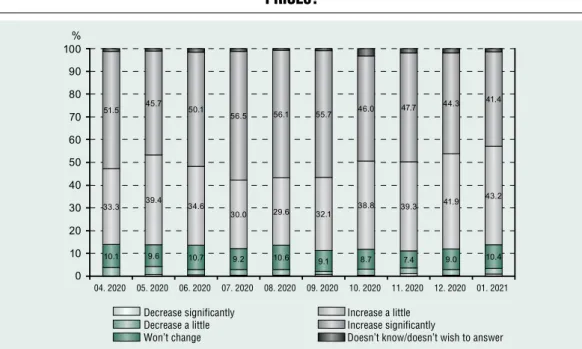
if inflation expectations remain permanently high because of the pandemic, the room for manoeuvre for the monetary policy may be restricted, as the central bank, considering the inflation target, cannot maintain loose conditions for a long time. According to the results of the surveys, the vast majority of people asked thought the coronavirus pandemic would have a price-increasing effect, which 86 percent of respondents expected every month
Figure 10 what Impacts do you thInk the coronavIrus pandemIc wIll have on consumer
prIces?
Source: own survey
04. 2020 05. 2020 06. 2020 07. 2020 08. 2020 09. 2020 10. 2020 11. 2020 12. 2020 01. 2021
Decrease significantly Increase a little
Decrease a little Increase significantly
Won’t change Doesn’t know/doesn’t wish to answer
(Figure 10). in this case, the development of the pandemic situation did not really influence the answers. At the same time, regarding the extent of price increases, it can be seen that the ratio of people expecting a significant increase in the second wave slightly reduced, while the ratio of people expecting a slight increase went up. in other words, although the inflation expectations of households are still strong, they were somewhat mitigated in the second wave. one of the reasons may be the fact that the rate of inflation was slightly reduced at the end of the year.
The households’ answers by and large indicate that the development of the pandemic situation strongly influenced people’s views on the economy. As to the two waves of the pandemic, however, the households’ perceptions were different, as they found the spring wave worse from the aspect of their financial situation,
while the two waves were assessed in almost the same way from the aspect of the employment situation. in other words, while we were able to observe a 'regular W' in the latter case, the second leg of the W shows a smaller decline in the first case. With the improvement of the pandemic situation, household operators’
perceptions quickly improved, which leads us to believe that from the aspect of recovery, the growth in household consumption could only be blocked by another wave of the pandemic.
Company reactions
in the case of the business survey, we first present the answers given to questions about the emerged economic situation, then we present the answers indicating company reactions about the near future.
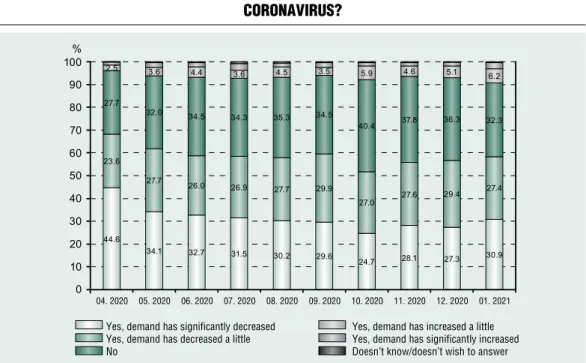
Figure 11 has the demand for the products of your company been Influenced by the
coronavIrus?
Source: own survey
04. 2020 05. 2020 06. 2020 07. 2020 08. 2020 09. 2020 10. 2020 11. 2020 12. 2020 01. 2021 Yes, demand has significantly decreased Yes, demand has increased a little Yes, demand has decreased a little Yes, demand has significantly increased
No Doesn’t know/doesn’t wish to answer
in the wake of the coronavirus pandemic, the vast majority of the businesses reported a decline in the demand for their products, as indicated in Figure 11. in April, 44.6 percent of them announced a strong decline, while 23.6 percent reported a small decline, and only 3.9 percent experienced growth (mainly in commerce and in industry). Thus, the value of the index was −53.8 points. As of May, with the restrictions lifted, the ratio of companies experiencing a drop in demand slightly decreased, but they were still in majority. At the same time, the restrictions introduced in november did not have a significant impact on the assessment of demand, the index value increased from −33.9 points in october to only −38.4 points. This is primarily due to the fact that the restrictions imposed during the second wave had an adverse impact on sectors that already experienced a decline in the first wave (tourism, hospitality). Meaning that the crisis had a V-shape for the majority of sectors, while a smaller ratio may have experienced a W-shaped crisis.
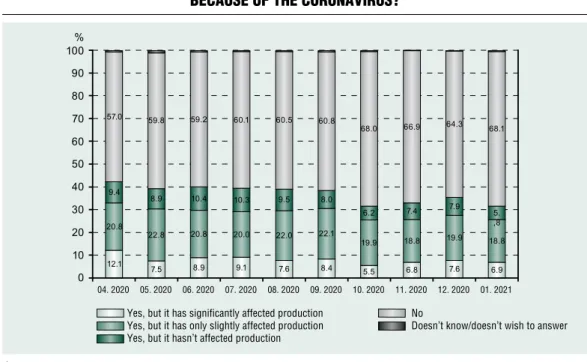
Apart from the development of demand, the present crisis may also generate problems in the case of suppliers due to, for instance, the closing of the borders, which hinders production through the shortage of materials.
Figure 12 illustrates the breakdown of the answers given to this question. on the basis of the survey conducted in April, 42.3 percent of the businesses had to face difficulties in purchasing materials and parts because of the coronavirus, and only 9.4 of them said that this did not influence their production. This ratio did not really change until october, when a significant decline was observed in the ratio of companies facing difficulties. The restrictions imposed in november had a small impact on the answers in this case, too, but in volume, every third business faced difficulties regarding purchases at the end of the previous year and at the beginning of the current year. it is obvious
that the present crisis had a negative impact on the operation of companies concerning both demand and supply, and the companies were only partially able to remedy the difficulties with time. it is also clear that the two waves of the crisis were not of identical depth, as the problem was smaller in the second wave.
The situation of businesses is indicated by the changes in hours worked by employees during the pandemic situation (Figure 13). in April, more than half of the companies (57.1 percent) reported a drop in the number of hours worked, which can be explained with the spread of part-time employment. The ratio of shorter working time gradually decreased until october. The ratio of less working hours started to increase again in november, but the ratio of these companies did not reach the level experienced in the first wave. in other words, while a higher ratio of companies used part-time employment in the first wave, this was less common in the second wave – so the two legs of the W were not symmetric in this respect, either.
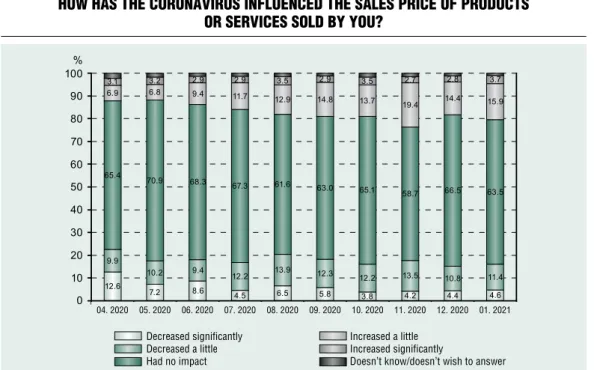
companies may attempt to compensate declining demand with lower prices, improving their position through price competition. in response to the pandemic situation and suppliers’ difficulties, as well as increased costs of protection due to protective measures, companies may increase their sales prices if the demand allows for that. The assessment of the strategy applied during the coronavirus pandemic was given by our relevant question, indicated in Figure 14.
According to the results of the survey, two thirds of the companies in Hungary did not modify their selling prices because of the coronavirus pandemic. The ones that did modify their prices did not follow a uniform strategy. in April, the number of companies that reduced their prices due to the coronavirus was more than double of those that reacted to the pandemic situation with a price increase.
have you recently faced any dIffIcultIes In purchasIng materIals or parts because of the coronavIrus?
Source: own survey
Figure 13 how has the coronavIrus Influenced the number of hours worked by the
employees of your company?
Source: own survey
04. 2020 05. 2020 06. 2020 07. 2020 08. 2020 09. 2020 10. 2020 11. 2020 12. 2020 01. 2021
04. 2020 05. 2020 06. 2020 07. 2020 08. 2020 09. 2020 10. 2020 11. 2020 12. 2020 01. 2021 Yes, but it has significantly affected production No
Yes, but it has only slightly affected production Doesn’t know/doesn’t wish to answer Yes, but it hasn’t affected production
Decreased significantly Increased a little
Decreased a little Increased significantly
Had no impact Doesn’t know/doesn’t wish to answer
As months went by, the ratio of companies reducing their prices dropped, while the ratio of companies increasing their prices went up:
by the autumn, the two groups had almost identical shares, and at the end of the year, the latter was in majority. At the same time, the indicated price reduction is not reflected in inflation data, which could be explained with the fact that it was concealed by the effects of other factors independent of the pandemic, such as the need to increase the prices because of the increased wages, or the weakening of the Forint against the euro.
Apart from assessing the current economic situation, it is necessary to find out the expectations of companies, too, as that may determine the shape of the recovery course.
Before presenting the expectations, it is important to point out one more issue. We asked the companies each month whether they could avoid going bankrupt if the
present situation remained for 3 months. This question is extremely important, as now, at the time of writing this study, it is not clear when the restrictions will be lifted. At the same time, the more companies go bankrupt during the crisis, the longer the recovery period will be. The risk of bankruptcy was the highest in April (Figure 15), when 13.5 percent of the companies said that they could not avoid bankruptcy if the current situation remained permanently. As of May, the risk of bankruptcy gradually decreased as restrictions were lifted and the economy was restarted. The ratio of companies exposed to the risk of bankruptcy reached its lowest point in october (4.7 percent). The restrictions introduced in november also increased the number of companies exposed to the risk of bankruptcy, but their ratio did not reach the spring level, so – similarly to the previous case – the first part of the W is more pronounced.
Figure 14 how has the coronavIrus Influenced the sales prIce of products
or servIces sold by you?
Source: own survey
04. 2020 05. 2020 06. 2020 07. 2020 08. 2020 09. 2020 10. 2020 11. 2020 12. 2020 01. 2021
Decreased significantly Increased a little
Decreased a little Increased significantly
Had no impact Doesn’t know/doesn’t wish to answer
Is your busIness able to avoId bankruptcy If the present sItuatIon persIsts for 3 months?
Source: own survey
Figure 16 are you plannIng to modIfy the number of your employees In the near future
due to the coronavIrus?
Source: own survey
04. 2020 05. 2020 06. 2020 07. 2020 08. 2020 09. 2020 10. 2020 11. 2020 12. 2020 01. 2021
04. 2020 05. 2020 06. 2020 07. 2020 08. 2020 09. 2020 10. 2020 11. 2020 12. 2020 01. 2021
Yes No Doesn’t know/doesn’t wish to answer
Yes, I’ll reduce it significantly Yes, I’ll increase it a little Yes, I’ll reduce it a little Yes, I’ll increase it significantly
No Doesn’t know/doesn’t wish to answer
We also inquired about the future employment plans of businesses. The breakdown of the relevant answers can be seen in Figure 16. in April, as a result of the uncertain economic environment, most of the businesses were planning staff reductions (13.5 percent), and only a few were planning extensions (3.4 percent). The situation turned around already in May, as more businesses were planning extensions in the summer months, which promised a favourable recovery course. Then the outbreak of the second wave changed the plans, and in the autumn months, the number of businesses planning reductions was higher again. However, prospects were still better than in the first wave: in november, 5.7 percent of respondents were planning reductions, and 4.0 percent were planning extensions. it seems favourable that in January, only 3.7 percent of the businesses were planning to reduce the
number of employees due to the coronavirus pandemic, while the number of companies planning extensions was 7.9 percent, and this volume corresponds to the expectations seen in July. Thus, businesses see the near future positively, even in spite of the permanent restrictions. nevertheless, as most businesses (86.1 percent) are not planning to modify their staff numbers, a slower recovery may be expected. This also suggests that the second lowest point of the W is not so significant, and reflects the government’s intention, namely that the primary objective of the measures taken was to protect existing jobs and create new jobs.
As to future expectations, the development of investment plans is a very useful indicator. Businesses only decide in favour of investments if they find the economic environment satisfactory. Government
Figure 17 how lIkely do you deem your company to be able to make Investments
In the next year?
Source: own survey
04. 2020 05. 2020 06. 2020 07. 2020 08. 2020 09. 2020 10. 2020 11. 2020 12. 2020 01. 2021
Not likely at all Probably likely
Probably not likely Absolutely likely
Not really likely Doesn’t know/doesn’t wish to answer
More likely
programmes are only able to influence this to a limited extent. Figure 17 shows that 76.9 percent of respondents said in April that they were not planning any new investments in the following year. The ratio of people answering with a definite no was especially high (53.6 percent). As opposed to that, only 21.7 percent declared that they would make investments in spite of the pandemic situation. We put this question with monthly frequency on other questionnaires, too, to businesses, so we have a longer timeline for comparison than in the case of other questions. By way of comparison, 39.5 percent of businesses were planning to make investments in the autumn of 2019, and 59.1 were not. Accordingly, the role played by the above-mentioned confidence multiplier also increased for the corporate segment: the decline in the willingness to invest shows the reduced expenses of businesses and thus a decline in the performance of the economy.
With the end of the first wave, the willingness to invest started to slowly increase, but it was hindered by the occurrence of the second wave in the autumn months. only 27.5 percent of the businesses stated in october that they were planning some investments, however, it is a higher ratio than the one in April. The surveys made in December and January show a progress in this respect, too, although the willingness to invest is still lower than it was before the crisis. This projects a lengthy recovery and the occurrence of the phenomenon of hysteresis, unless we manage to improve businesses’ willingness to invest.
overall, the results of the business survey reflect the same trends that we identified in the household survey. The two waves of the pandemic occurring until early 2021 had negative impacts on businesses’ vision on the economy, but in this respect, the spring wave proved to be more serious, meaning that although we can see different versions of the
W regarding the various questions, the rate of the second decline on the whole was less than that of the first one. it is also clear that the improvement of the pandemic situation brought a fast increase in the expectations of businesses, too, however, the willingness to invest and the trends expected in employment suggest a slower recovery in the economy.
cOnclusIOns
The results of the household and business surveys supported the fact that a W-shaped crisis unfolded in Hungary during the two waves of the pandemic, though the second lowest point seemed to be less serious. in addition, the results of the surveys show that after the lowest point, economic perceptions started to quickly improve among both households and businesses.
Future, that is the last upward leg of the W, is also worth mentioning, as it determines the long-term growth of the economy. The steepness of the last leg, i.e. the rate of recovery and growth will be influenced by multiple factors. The first of them is the damage suffered during the pandemic situation: to what extent businesses had to cut back their investments, and how many of them will be unable to re- open once restrictions are lifted. The level of investments may be positively influenced by the fact that the government attempted to support corporate investments during the crisis situation, so there is a chance that the level of investments may become high again after the virus situation. This may be facilitated by the abundance of funds, too: the new 7-year budget cycle of the european union will start in 2021, as well as the joint borrowing, which will also allow for significant developments.
The long-term effects of developments will be determined by the efficiency of the use of funds, which is extremely important because
domestic funds are finite: the increased deficit generated in 2020 by the anti-cyclical economic policy will sooner or later have to be reduced. in the use of funds, the aspects of long-term growth should be given priority.
in the use of funds obtained from joint borrowing, another important aspect is the fact that the european union specified that some of these funds must be spent on digital and green developments. Apart from that,
the development of all levels of education is especially important in Hungary.
There is definitely a lot to be done before the growth can return to its pre-crisis level. on the basis of the household survey, the increase in consumption is limited by the restrictions in force only, however, the willingness of the corporate sector to invest needs to be encouraged. if this does not happen, recovery may also take a longer time.
Akerlof, G. A., shiller, R. J. (2010). Animal Spirits: How Human Psychology Drives the Economy, and Why it Matters for Global Capitalism. Princeton university Press
Buchheim, l., Dovern, J., Krolage, c., link, s. (2020). Firm-level expectations and Behavior in Response to the coViD-19 crisis. CESifo Working Paper, no. 8304, ssRn: https://ssrn.com/
abstract=3603773
czeczeli V., Kolozsi, P., Kutasi, G. Marton, Á. (2020). economic exposure and crisis Resilience in exogenous shock. Public Finance Quarterly, Vol.
65(3), pp. 321-347
https://doi.org/10.35551/PFQ_2020_3_1
Hanspal, T., Weber, A., Wohlfart, J. (2020).
income and Wealth shocks and expectations During the coViD-19 Pandemic. CEBI Working Paper Series, no. 13/20,
https://dx.doi.org/10.2139/ssrn.3578472
Posgay i., Regős G., Horváth D., Molnár, D. (2019). chapters from economic Theories on Hysteresis. Public Finance Quarterly, Vol. 64(3), pp.
414-432,
https://doi.org/10.35551/PFQ_2019_3_6
Posgay i., Regős G., Horváth D., Molnár D.
(2020). on the economic impacts of the corona Virus. Polgári Szemle, [Civic Review],Vol. 16(4-6), pp. 31-50,
https://doi.org/10.24307/psz.2020.1004
sheiner, l., Yilla, K. (2020). The ABcs of the Post-coViD economic Recovery. Access: https://
www.brookings.edu/blog/up-front/2020/05/04/
the-abcs-of-the-post-covid-economic-recovery/
(15/01/2021)
european central Bank (2020) eurosystem staff macroeconomic projections for the euro area.
european central Bank, December 2020, elérés:
https://www.ecb.europa.eu/pub/pdf/other/ecb.
note
1 The employment data of monthly frequency published by the Hungarian central statistical office (Hcso) are less accurate than quarterly data, but offer a better representation of the impacts of the pandemic waves.
References
projections202012_eurosystemstaff~bf8254a10a.
en.pdf (23/01/2021)
iMF (2021). World economic outlook update (January 2021) Policy support and Vaccines expected to lift Activity. Access: https://www.imf.org/en/
Publications/Weo/issues/2021/01/26/2021- world-economic-outlook-update (09/02/2020)
Magyar nemzeti Bank (central Bank of Hungary) (2020). inflációs jelentés 2020. június,
[inflation Report, June 2020], Access: https://
www.mnb.hu/letoltes/hun-ir-digitalis-2.pdf (12/02/2021)
oxford economics (2020). coronavirus: short- term Pain but strong Rebound likely. Access:
https://resources.oxfordeconomics.com/hubfs/
news%20release%20180320/coronavirus%20 -%20short-term%20pain%20but%20strong%20 rebound%20likely%20.pdf (12/02/2021)