Frank P. Buff
University of Rochester, Rochester, New York
and
R. A. Lovett*
Bell Telephone Laboratories, Inc., Murray Hill, New Jersey
1. Introduction 17 2. Thermodynamics 17 3. Optical Measurements of the Structure of the Interface 19
4. Some Empirical Formulas and the Critical Point 19
5. Theoretical Description 22 6. Experimental Method 24
7. Data 25 References 28
1» Introduction
This chapter outlines the basic thermodynamic and statistical mechanical ideas which have been applied to the liquid-vapor interface and summarizes the available surface tension data of simple fluids.
2* Thermodynamics
Gibbsian thermodynamics [1] approaches surface phenomena through an iterative subtractive procedure. This device systematically yields the leading terms in the asymptotic expansion of the free energy with respect to the geometrical parameters characterizing the system [2]. In its simplest form, a mathematical surface, the Gibbs dividing surface, is located in the transition zone separating the bulk phases. The real two phase system is then contrasted with a hypothetical reference system in
* Supported by a grant from the Office of Saline Water, Department of the Interior.
+ Present address: Department of Chemistry, Washington University, St. Louis, Missouri.
17
which the respective bulk properties are constant up to the dividing surface. The excess of the real system over this reference state provides a precise meaning for the various thermodynamic properties of the interface. For a planar interface, the thermodynamic properties of interest are the surface tension y and U8 , Ss , and Γ, the surface excess per unit area of energy, entropy and matter, respectively. Among these properties only y is independent of the location of the dividing surface.
A one-component, two phase system has one degree of freedom. The thermodynamic relations applicable to a system with planar interface are the free energy relation
U8=y+ TSS + Γμ (2.1)
and the Gibbs adsorption equation
0 = Ss dT + Γάμ + dy (2.2)
where T is the temperature and μ is the chemical potential. An important particular location of the dividing surface is that for which Γ is zero.
When this dividing surface is adopted, Eqs. (2.1) and (2.2) yield
S
s(r = 0) = -^P (2.3) ϋ,(Γ = 0)=γ(Τ)-Τ&Ρ- (2.4)
and the excess Helmholz free energy per unit area and the surface tension are identical.
For curved interfaces the surface tension y departs from the planar value yoo3. The asymptotic correction is
y~yao + ( - ^ ) (*i + *a) + - (2.5)
\ A / oo
where cx + c2 is the mean curvature and (C/s)^ is an additional thermo- dynamic parameter. This elaboration of the conventional theory has found these applications: (1) (0/s)^ is related to the asymmetry of the interfacial density profile (see Section 5), (2) Eq. (2.5) provides a quan- titative criterion [3] for the breakdown of macroscopic concepts in the treatment of critical droplets in nucleation theory, and (3) it has found use in connection with the Reiss-Frisch-Lebowitz equation of state of hard sphere fluids [4].
Particularly for the planar interface, an alternative thermodynamic description is available which utilizes a separate surface phase of small (but unspecified) thickness. The relevant thermodynamic expressions have been carefully reviewed by Guggenheim [5].
3* Optical Measurements of the Structure of the Interface
The molecular description of the interfacial region begins with the density profile: the point function density pa)(z) as it varies across the transition zone. Two types of optical reflection experiments have been devised to give information about this variation, but it is important to realize that optical measurements only provide an assessment of the
"dielectric profile.,, Near the critical point this may be reasonably interpreted as being proportional to the density; at lower temperatures a more subtle interpretation is required. In the first method it is recognized that in the Fresnel limit corresponding to an infinitely sharp break in density, light incident at the Brewster angle and plane polarized at 45°
to the plane of incidence possesses no H wave in the reflected beam [6].
Thus the measurements of the actual ellipticity of the reflected light [7]
provide some information about the continuous dielectric profile. The results are usually interpreted in terms of the "minimum optical thick- ness" of the transition zone by an analysis due to Drude [8]. As yet the measurements have only been carried out well below the critical point.
It is important to realize that the traditional optical treatment incorrectly assumes that the dielectric tensor is isotropic throughout the transition zone. When properly reformulated, a modified form of Drude's result is obtained which is valid at low temperatures [9]. Furthermore, the low temperature result cannot be used in the critical region as has been occasionally assumed [10].
In the second technique the reflection coefficient for normally incident light is measured [11]. This method is only useful in the immediate vicinity of the critical point where the measured reflection coefficient differs appreciably from the discontinuous Fresnel limit. The experi- mental results may be interpreted in terms of a characteristic length for the density profile, and a theory which appears to be in quantitative agreement with these experiments has been presented [12]. Unfortu- nately, neither technique has been applied to a simple fluid.
4* S o m e Empirical Formulas and the Critical Point Van der Waals [13]* recognized that according to the principle of corresponding states
Y<<T)=v:il*Tj(-?-) (4.1)
* The pioneering work of van der Waals and his school is also available in the definitive monograph by Bakker [13a].
where Vc is the critical volume, Tc the critical temperature, and/(T/rc) a universal function [14]. To test this relation and to illustrate the limited range over which most of the data have been accumulated, γ(Τ) V^^T^1 is plotted versus T\TC in Fig. 1. Table I gives the reduced surface tension
0.8 T / TC
FIG. 1. γ(Τ) V\,ZT~X plotted versus T/Tc: (O) neon, (Δ) argon (X), krypton, (D) xenon, ( · ) nitrogen, ( o ) oxygen, (<Z>) carbon monoxide, and ( + ) methane.
TABLE I
VALUES OF yR = V^T'^T) AT T = 0.56 Te
Substance γ (dyne cm- 1) γκ (erg/°K mole"2/3) VR/YR (Ar)
Ne CH4
Kr Ar Xe
o
2 N2CO
5.55 13.790 16.081 13.28 18.98 14.04 10.42 11.05
1.500 1.548 1.568 1.570 1.583 1.605 1.662 1.704
0.955 0.986 1.000 1.000 1.008 1.022 1.059 1.085
at a fixed reduced temperature to illustrate the specific deviations from exact correspondence. With the obvious exception of the strong quantum effect for neon, the variations in Table I may be ascribed to experimental error and the recognition that the surface properties are more sensitive to the intermolecular force law than bulk properties. It will be recalled that surface tension behavior is one of the oldest delicate tests for deviation from correspondence [15]. Some attempts at quantum corrections have been made both experimentally [16] and theoretically [17], [17a],* but it is difficult to draw any conclusions from the present experimental data and published molecular parameters.
The empirical equation
AT) = y0[l - (TITe)y+r (4.2) also suggested by van der Waals, describes simple fluids remarkably
well. γ(Τ) has been measured over a very large range (see Table X) for argon [18], nitrogen [18] and xenon [18a]. These data fit Eq. (4.2) to within 1.6% with r values in the range 0.25-0.29. The only measure- ments testing this equation closer to the critical point are those on the occasionally difficult binary system cyclohexaneaniline [19]. Upon making the requisite gravitational field corrections on the original data, it is found that for this binary system over the measured range of temperatures y does not follow Eq. (4.2). However, for 0.995 < T/Tc
< 0.999, r = 0.29 — 0.31.f Consequently, for the substances here con- sidered,
r = 0.27 ± 0.02,
a value which may be explained by a theoretical model (see Section 5).
The value r = \ originally predicted by van der Waals [13], and since obtained repeatedly by later investigators, is thus entirely too high and the value r = % suggested by Guggenheim [14] is somewhat too low.
Since over an extended range, the bulk density difference Ap, fits the relation
Apec [l- (TjTc)f (4.3)
the validity of Eq. (4.2) leads to MacLeod's equation [20]
γ(Δρ)~8 = constant (4.4)
For argon and nitrogen, for which β is approximately one-third, s = 3.8-3.9, which is again somewhat higher than Guggenheim's
* The overall quantum correction to γ, as well as the deviation from isotropy of the momentum contribution to the stress tensor, lead to simple formulas [17].
+ A. Wims [19a] has recently made measurements on another binary mixture and has found a higher value r = 0.33 with a standard deviation 0.02.
s = 3f and less than the "parachor" value of s = 4. It has long been recognized that s = 3.8 provides a good fit for many substances, a result which is, of course, inconsistent with van der Waals' prediction that s = 3.
We conclude by observing that an interfacial width criterion [21]
rigorously defined by Gibbsian thermodynamics indicates that for pure substances in the critical region r < ß. It is found [21a] that the relevant ratio of surface to bulk properties yields distances from the Γ = 0 dividing surface to the respective auxiliary surfaces with vanishing excess surface energy or entropy. With ideal gas as reference state, these surfaces lie on the liquid side and, for example, the characteristic energy distance increases linearly over a broad temperature range until it reaches the critical region where its increase is dramatic.
5* Theoretical Description
This section summarizes the theoretical results which have been given for the thermodynamic and structural properties of the liquid-vapor interface.
A general expression for the surface tension may be obtained by hydrostatic arguments [22] (mechanical definition) or differentiation of the partition function [23] (free energy definition). For a planar interface
/.OO
y = άζ[στ(ζ) -σΝ] (5.1)
J —00
where στ and σΝ are the tangential and normal components of the stress tensor. For spherically symmetric pair-wise additive potentials V(R) this expression reduces to
γ= \ Γ. dz S dvi2 **'*„*" v ' {Riî) pi2){z ' Ria) ( 5 · 2 )
where p{2)(z, R12) is the pair number density for the inhomogeneous system. The corresponding expression for the superficial excess of energy is
Us(r = 0) = \ f J dv12 V(R12)\ß^(z, R12) - P'«(R^]
where the origin of the coordinate system is chosen such that
r=f [>«)(») _ ,u>] dz + Γ \pi»(z) - p?*] dz = 0 (5.4)
J - 0 0 J 0
and pi2)(/o{,2)) and />(Ι1)(/ο^1)) are the bulk pair and singlet number densities of the liquid (vapor).
By estimating the pair distribution function in terms of an abrupt interface, Eq. (5.2) leads to Fowlers formula [24] for the surface tension y* associated with this model. Stansfield [18] has compared various theoretical formulas with experiment in the case of argon. Harasima's [25]
critique of this Laplace-Fowler approximation is incorrect since he has overdetermined the molecular distribution functions.
The theoretical expression for ( C / Î ^ is similar to Eq. (5.1) [3].
For more-detailed calculations of surface phenomena, other approaches are more useful. We mention the method of coupling parameters [26, 27] and, particularly, the theory of fluids in an external field [26]. The latter approach leads to consideration of the direct correlation function for inhomogeneous fluids, X(l, 2) [28, 29]. With its use the surface tension may be expressed as a functional integral [30].
y = k
BT J"
edz
xj dv
n,
uj^ da W±A È&A
Z(lj 2; a) (5.
5) The integral over oc is an integral over a succession of different density configurations: With each oc is associated a definite density function p(l ; oc). As oc varies from zero to one, p(l ; oc) varies from zero to the final density p(l). This is achieved (hypothetically) by varying the external field. An expression similar to Eq. (5.5) is found for the invariant work of formation of a new phase (bubble or droplet) from its environment.Equation (5.5) is the rigorous formulation of an approach initiated by Maxwell [31] and van der Waals [13]. In their theory, the free energy density was augmented by a term arising from the inhomogeneity of the system and corresponds to making simplifying assumptions for the direct correlation function. A variational criterion then led to van der Waals' integral equation [13] for the density profile, subsequently solved numerically by Hill [32]. Further approximations led van der Waals to his famous density gradient theory, whose original phenomenological parameter was first expressed in molecular terms by Ornstein and Zernike [33]. Modifications of these general ideas have recently been proposed to remove the dependence upon the original continuity of states hypothesis [34, 35]. The resulting predictions are that in the critical region r = 0.29 and that the "thickness" diverges as (1 — Γ/Γ0)-°·62. An independent analysis of the profile has also been given in terms of the intuitive model of capillary waves as suitable collective coordinates, an approach which may also be derived from a detailed analysis in the grand ensemble.*
* A preliminary report of this theory has been given by Buff et al. [12]. Further details are given by Lovett [36].
Defining P(z) by
Y* = £ <br **/>(*) = -Μ^- ln[l + K U (5-7)
and km t» π2Ι4(3ζ2)ν2
y*-r = *Têr>° <
5·
8>
with Ap = />liquid — />vapor and α^ = 2y*/mg Ap, where m is the molecular mass. These results are in good agreement with the optical measurements [11] in the critical region. Using this approach the discontinuous pair number density may be improved sufficiently so that the expression for y is greatly improved over the γ^ estimate and it follows that Us > Us (step model). The result γ* > γ may be obtained intuitively from the observation that the real density profile has a lower free energy than the model step density profile.
The third moment, expressible in terms of the parameter (C/s)^
predicts a sharper rise of the profile on the vapor side.
The more restricted formulation of surface phenomena based upon the cell model is carefully reviewed by Ono and Kondo [37]; the formulation based upon the significant structure theory is reviewed by Eyring et al. [38]. The scaled particle theory of Reiss et al. [39] leads to an expression for the cavity tension. When this quantity is compared with the measured interfacial tension, it is found to require a temperature dependent empirical parameter in order to avoid the prediction of a negative surface entropy.
6. Experimental Method
The surface tension data tabulated below have been obtained by the capillary rise method. This is an absolute method in the sense that calibration is not necessary if all the geometrical parameters are known.
Since the quantity actually deduced from the capillary rise measure- ment is a2 — 2y\mg Ap, where mg is the force due to gravity, Ap, the number density difference between the liquid and vapor phases also has to be determined ; a may be determined from the rise h and the capillary radius r either by the approximate Poisson-Rayleigh formula [40]
a- = rh j l + i j -0.1288 J + 0.1312 £ + - j r <\ (6.1) or by using tables based upon numerical integration of the Laplace equation [41].
It is of interest to observe that the Padé approximant arising from the leading correction term in Eq. (6.1)
~tf = 1 + (r2/3a2) ( 6 , 2 )
corresponds physically to a meniscus of variationally determined elliptical cross section. Particularly in differential capillary rise measure- ments, Eq. (6.2) frequently rivals the numerical tables.
As a final observation it should be stressed that, as indicated in Table I, most of the surface tension measurements have been made around the normal boiling points of the simple fluids. It is desirable to have more data closer to the critical point so that the parameter r of Eq. (4.2) can be fixed with some certainty.
Likewise, more accurate optical measurements over a greater tem- perature and frequency range are needed to really test the structural ideas which are developing. Also, the technique could perhaps be extended to the study of the reflected line shape and hence gain informa- tion about dissipative processes in the surface.
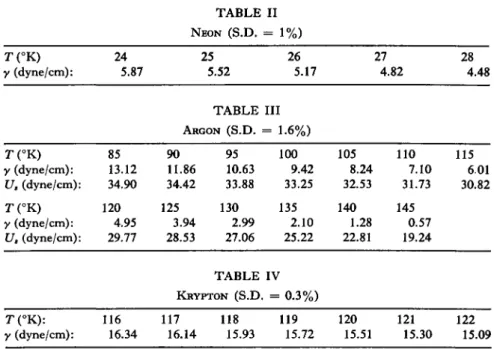
7* Data
The surface tension of Ne, Ar, Kr, Xe, N2 , 02 , CO, and CH4 are given in Tables II to IX, and the surface energy U8 (Γ = 0) is given
TABLE II
NEON (S.D. = 1%)
T(°K) 24 25 26 27 28 y (dyne/cm): 5.87 5.52 5.17 4.82 4.48
TABLE III
ARGON (S.D. = 1.6%)
90 95 100 105 110 115 11.86 10.63 9.42 8.24 7.10 6.01 34.42 33.88 33.25 32.53 31.73 30.82 125 130 135 140 145
3.94 2.99 2.10 1.28 0.57 28.53 27.06 25.22 22.81 19.24
TABLE IV
KRYPTON (S.D. = 0.3%)
T(°K): 116 117 118 119 120 121 122 y (dyne/cm): 16.34 16.14 15.93 15.72 15.51 15.30 15.09 T (°K) 85
y (dyne/cm): 13.12 U8 (dyne/cm): 34.90 T(°K) 120 y (dyne/cm): 4.95 U, (dyne/cm): 29.77
T(°K): 160 y (dyne/cm): 19.41 U8 (dyne/cm): 50.22 T (°K): 240 y (dyne/cm): 5.65
U8 (dyne/cm): 40.75
200 220 12.08 8.73 46.73 44.19 280
0.69 26.34
T(°K): 65 y (dyne/cm): 11.77 Us (dyne/cm): 27.41
T(°K): 100 y (dyne/cm): 4.06 Us (dyne/cm): 23.54
T(°K): 70 y (dyne/cm): 18.35
T(°K): 84 y (dyne/cm): 14.72
T (°K) 70 y (dyne/cm): 12.11
T(°K): 84 y (dyne/cm): 8.96
TABLE V
XENON (S.D. = 0.2%)
180 15.65 48.69
TABLE VI
NITROGEN (S.D. = 1.6%)
70 75 80 10.58 9.41 8.28 27.08 26.68 26.24
110 115 2.22 1.39 21.21 19.48
TABLE VII
OXYGEN (S.D. = 1%)
72 74 76 17.82 17.29 16.76 86 88 90 14.22 13.72 13.23
72 74 76 11.64 11.18 10.73 86 88 90 8.53 8.10 7.69
TABLE IX
METHANE (S.D. = 0.2%)
85 90 95 7.16 6.10 5.06 25.71 25.10 24.39 120
0.65 16.89
78 80 82 16.25 15.73 15.23
78 80 82 10.28 9.83 9.39 T(°K):
y (dyne/cm):
Ua (dyne/cm):
260 2.91 35.72
105 3.11 22.50
TABLE VIII
CARBON MONOXIDE (S.D. = 1%)
T(°K): 90 95 100 105 110 115 y (dyne/cm): 17.211 16.191 15.189 14.204 13.238 12.289
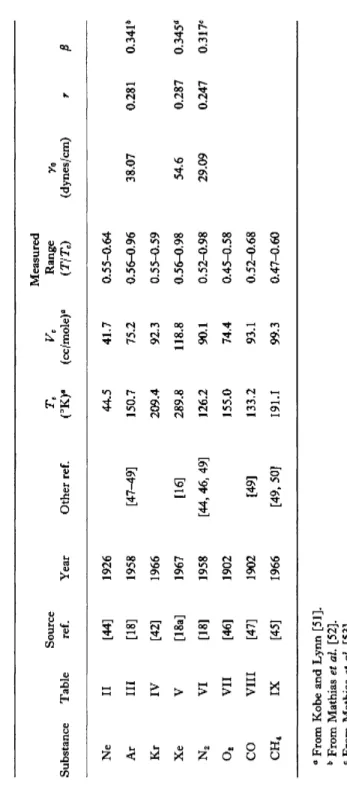
TABLE X SUMMARY OF DATA GIVEN IN TABLES II TO IX Substance Ne Ar Kr Xe N2
o
2 CO CH4Table II III IV V VI VII VIII IX
Source ref. [44] [18] [42] [18a] [18] [46] [47] [45]
Year 1926 1958 1966 1967 1958 1902 1902 1966
Other ref. [47-49] [16] [44, 46, 49] [49] [49, 50]
(°K)e 44.5 150.7 209.4 289.8 126.2 155.0 133.2 191.1
(cc/mole)a 41.7 75.2 92.3 118.8 90.1 74.4 93.1 99.3
Measured Range (T/Te) 0.55-0.64 0.56-0.96 0.55-0.59 0.56-0.98 0.52-0.98 0.45-0.58 0.52-0.68 0.47-0.60
Yo (dynes/cm) 38.07 54.6 29.09
r 0.281 0.287 0.247
ß 0.34P 0.345* 0.317c α From Kobe and Lynn [51]. b From Mathias et al. [52]. e From Mathias et al. [53]. d From Weinberger and Schneider [55].
for argon, nitrogen and xenon. Table X summarizes the sources of the data given, the year the measurements were first reported, references to other measurements when more than one has been made, the critical temperature and volume, the reduced temperature range covered by the measurements, and the parameters y0 , r, and ß when they have been determined.
It will be noticed that the only measurements above T = 0.7 Tc are those of Stansfield [18] and Smith et al. [18a], These are the only data from which a value of r can be reliably inferred over an extended temperature range. Furthermore, the value of τ = 1 + r — β, defined by a2 oc (1 — TITC)T, is almost identical for these substances (0.94 and 0.93) and that most of the difference in r is due to the difference in assumed β (see Table X). Thus although there is some evidence that r increases with increasing 71, these measurements indicate that the experimentally observed index difference β — r & 0.06 applies in the critical region.* It will be noted that this value is bounded by the prediction r — β = 1/8 for the two-dimensional lattice gas model [42], [43], and the van der Waals limit r = ß [13].
In addition to the surface tension measurements on pure simple fluids reported here, measurements have been made on the binary mixtures Kr-CH4[45], Ar-N2 [50, 54], Ar-CH4 [50, 54], N2-CH4 [50, 54], N2-CO [46], and CO-CH4 [54].
REFERENCES
1. J. W. Gibbs, "The Scientific Papers of J. Willard Gibbs," Vol. I, p. 219. Dover, New York, 1961. This work and its later extensions are summarized by F. P. Buff, in "Handbuch der Physik" (S. Flügge, ed.), Vol. X. Springer, Berlin, 1960.
2. F. P. Buff and H. Saltsburg, / . Chem. Phys. 26, 1526 (1957).
3. F. P. Buff, J. Chem. Phys. 23, 419 (1955).
4. H. Reiss, H. L. Frisch, and J. L. Lebowitz, J. Chem. Phys. 31, 369 (1959).
5. E. A. Guggenheim, "Thermodynamics," S4.69. (North-Holland Publ., Amsterdam, 1957.
6. L. D. Landau and E. M. Lifschitz, "The Electrodynamics of Continuous Media,"
p. 366. Pergamon Press, Oxford, 1960.
7. K. Kinosita and H. Yokoto, J. Phys. Soc. Japan 20, 1086 (1965); J. M. McBain, R. C. Bacon, and H. D. Bruce, J. Chem. Phys. 7, 818 (1939); C. V. Raman and L. A. Ramadas, Phil. Mag. 3, 220 (1927); Lord Rayleigh, Phil. Mag. 33, 1 (1892).
8. P. Drude, "The Theory of Optics," pp. 287-295. Dover, New York, 1959.
9. Our theory is summarized in "1966 Saline Water Conversion Report." p. 26. U.S.
Government Printing Office, Washington, D.C.
* J. Straub [41a] has just completed measurements on COa near Te which confirm the value ß — r = 0.06.
10. J. E. Cahn and J. E. Hilliard, J. Chem. Phys. 28, 258 (1958).
11. G. H. Gilmer, W. Gilmore, J. Huang, and W. W. Webb, Phys. Rev. Letters 14, 491 (1965).
12. F. P. Buff, R. A. Lovett, and F. H. Stillinger, Jr., Phys. Rev. Letters 15, 621 (1965).
13. J. D . van der Waals, J. Physik. Chem. 13, 657 (1894).
13a. G. Bakker, "Handbuch der Experimental Physik," Vol. VI. Akad. Verlagsges., Leipzig, 1928.
14. E. A. Guggenheim, J. Chem. Phys. 13, 253 (1945).
15. R. F. Curl, Jr. and K. S. Pitzer, Ind. Eng. Chem. 50, 265 (1958).
16. A. J. Leadbetter and H. E. Thomas, Trans. Faraday Soc. 61, 10 (1965).
17. F. P. Buff, Unpublished, 1953;
17a. J. M. Deutsch, J. L. Kinsey, and I. Oppenheim, J. Chem. Phys. 44, 2270 (1966).
18. D. Stansfield, Proc. Phys. Soc. (London) 72, 854 (1958).
18a. B. L. Smith, P. R. Gardner, and E. H. C. Parker, J. Chem. Phys. (in press).
19. D. Atack and O. K. Rice, Discussions Faraday Soc. 15, 210 (1953).
19a. A. Wims. To be published.
20. D. L. B. MacLeod, Trans. Faraday Soc. 19, 38 (1923).
21. F. P. Buff, R. A. Lovett, C. W. Stewart and J. Vieceli. To be published.
21a. F. P. Buff, J. Chem. Phys. 19, 1591 (1951).
22. J. G. Kirkwood and F. P. Buff, J. Chem. Phys. 17, 338 (1949).
23. F. P. Buff, Z. Elektrochem. 56, 311 (1952).
24. R. H. Fowler, Proc. Roy. Soc. A159, 229 (1937).
25. H. A. Harasima, Advan. Chem. Phys. 1, 203 (1958).
26. F. P. Buff and F. H. Stillinger, Jr., J. Chem. Phys. 25, 312 (1956).
27. T . L. Hill, J. Chem. Phys. 30, 1521 (1959).
28. F. H. Stillinger, Jr. and F. P. Buff, J. Chem. Phys. 37, 1 (1962).
29. J. L. Lebowitz and J. K. Perçus, J. Math. Phys. 4, 116 (1963).
30. R. A. Lovett and F. P. Buff, T o be published.
31. J. C. Maxwell, "Scientific Papers," Vol. II, p. 2. Cambridge Univ. Press, London and New York, 1890.
32. T . L. Hill, Jf. Chem. Phys. 20, 141 (1952).
33. L. S. Ornstein and F. Zernike, Proc. Akad. Sei. Amsterdam 17, 793 (1914).
34. F. P. Buff, R. A. Lovett, and F. H. Stillinger, Jr., Phys. Rev. Letters 15, 621 Footnote 5.
(1965).
35. B. Widom, J. Chem. Phys. 43, 3892 (1965).
36. R. A. Lovett, Thesis, Univ. of Rochester, Rochester, New York, 1965.
37. S. Ono and S. Kondo, "Handbuch der Physik" (S. Flügge, ed.), Vol. X. Springer, Berlin, 1960.
38. H. Eyring, D. Henderson, B. J. Stover, and E. M. Eyring, "Statistical Mechanics and Dynamics," Chapter 15. Wiley, New York, 1964.
39. H. Reiss, H. L. Frisch, E. Helfand, and J. L. Lebowitz,^. Chem. Phys. 32, 119 (1960).
40. Lord Rayleigh, Proc. Roy. Soc. A92, 184 (1915).
41. S. Sugden, J. Chem. Soc. 119, 1483 (1921).
41a. J. Straub. To be published.
42. L. Onsager, Phys. Rev. 65, 117 (1944).
43. C. N. Yang, Phys. Rev. 85, 808 (1952).
44. A. Th. van Urk, W. H. Keesom, and G. P. Nijhoff, Comm. Leiden 182b, 13 (1926).
45. S. Fuks and A. Bellemans, Physica 32, 594 (1966).
46. E. C. C. Baly and F. G. Donnan, J. Chem. Soc. 81, 907 (1902).
47. Data of Lord Rayleigh [39] corrected by G. Rudorf, Ann. Physik 29, 751 (1909).
48. Data of C. A. Crommelin corrected by Fowler [24], Proc. Chem. Soc. 30, 248 (1914).
49. F. B. Sprow and J. M. Prausnitz, Trans. Faraday Soc. 62, 1097 (1966).
50. Y. P. Blagoi, Ukr. Fiz. Zh. 5, 109 (1960).
51. K. A. Kobe and R. E. Lynn, Chem. Rev. 52, 117 (1953).
52. E. Mathias, H. K. Onnes, and C. A. Crommelin, Comm. Leiden 131a (1912).
53. E. Mathias, H. K. Onnes, and C. A. Crommelin, Comm. Leiden 145e (1914).
54. F. B. Sprow and J. M. Prausnitz, Trans. Faraday Soc. 62, 1105 (1966).
55. M. A. Weinberger and W. G. Schneider, Can. J. Chem. 30, 422 (1952).