Effect of Interaction between Traits of Different Genotype Maize in Six Fertilizer Level by GGE Biplot
Analysis in Hungary
SEYED MOHAMMAD NASIR MOUSAVI*, KÁROLY KITH, JÁNOS NAGY
* Corresponding author. E-mail address: nasir@agr.unideb.hu
Department of Land Use and Rural Development, Faculty of Agricultural Sciences, Centre for Agricultural Sciences, University of Debrecen, 4032 Debrecen, Böszörményi út 138, Hungary
1786-335X © 2019 The Author(s) Abstract. Hungary was one of the main countries in the world as regards the yields reached in maize production. The research was conducted to appraise the effect of NPK fertilizer on traits of different hybrid maize (Fao410, Fao340) at the University of Debre- cen and our experiment was carried out in Centre for Agricultural Sciences, Institute of Crop Sciences at Látókép in 2018. NPK fertilizer was applied in six different combinations (0-0-0 control, 30-23-27 first dose, 60-46-54 second dose, 90-69-81 third dose, 120-92-108 fourth dose and 150-115-135 fifth dose kg· ha–1). The result of compound variance showed the level of fertilizer and interaction between fertilizer and genotypes were significant in one percent. Effect of genotypes was a variable level of fertilizer and providing a different yield in the level of fertilizer. The weight of seeds in ear and weight of ear were important traits in the average yield on Fao410 hybrid. Also, the fourth of the fertilizer level was the best level of fertilizer for yield on Fao410 and Fao340. the weight of fresh plant and weight of seeds in ear were highest relation with yield in H340 hybrid. The results of this research can successfully contribute to the science of maize cultivars, the given adapted hybrid to the discovery of their traits and to an application of fertilizers.
Keywords: maize, NPK fertilizer, GGE biplot
Introduction
The amount of global annual maize production was 483 million tonnes in 1990 and increased to 705 million tonnes in 2004. The increment of 67% in the most dynamic among cereals. Its role in human nutrition and its widespread cultivation have made it the most important crop (Nagy, 2006). Earlier, Hun-
gary was one of the main countries in the world maize production, however, changes in climatic conditions have unfavourable effect on yield of maize (Nagy, 2008).
In 2050, a population of more than 9 billion will depend on the accessibil- ity of plant nutrients in proportion to the necessary increase in productivity, establishment of new crops and technologies, and the cultivation of marginal lands. During the 20th century, production of food enhanced substantially, because of the development of yield. If we take the mean of crop yields from 1900 and from 2000, it is clear that it would need nearly four times more land to catch crop at the 2000 level (Smil, 2011a). Large amounts of nutrients from plants (mainly nitrogen, phosphorus and potash) being removed from the soil at harvesting crops, fertilizers are important in refilling nutrient reserves into the soil. Many authors assert that increasing yield from 30% to 50% is due to fertilizers (Heisey and Norton, 2007).
Agriculture is more dependent on arranged utilization of plant nutrients while increasing food production. Hence, you can understand necessary nu- trients have risk in food production in the future and will be immensely im- portant in upcoming years. Food and Food Organization forecasts reveal that feeding the global population of 9.1 billion in 2050, over the years 2005/07 to 2050, requires a total incensement of food production by 70% (FAO, 2009).
New forecasts show that rising global demand for food in the year 2050 will have risen by 100 to 110 percent since 2005 (Tilman et al., 2011). From 2005 to 2050, fertilizer production should be from 50% to 100% increasing signifi- cantly because of increasing food production and crops. Crop production is cereal oriented in Hungary. So, there is planting area for cereals and small grain and maize around 70% of total agricultural land between 2.7–2.8 mil- lion hectares. The using of fertilizers, nitrogen and other macro elements, P and K, are parameters of increasing performance to crops (mainly cere- als), but using overdose fertilizer caused damage to environment and caused problems to the soil and decrease of quality water and increase of NO3-N and caused emissions of greenhouse gases in soil (Li et al., 2007; Van Groenigen et al., 2010). The over NPK fertilizer has huge program for future agriculture because of variable meteorological and soil factors (Ladha et al., 2005; Dev- kota et al., 2013).
There are increasing yields of maize due to timing, dosing, harmonizing and splitting of N-fertilization with PK fertilizer doses in Hungary (Pepó et al., 2006). However, there is not an acceptable result increasing the fertilizer caused yield of maize (Liu et al., 2003; Pepó et al., 2008) and it might even cause reduction in yield (Lü et al., 2011). Thus, the correct management of nitrogen fertilizer is important and essential in order to keep the high yield of maize and N efficiency. There are only a few articles about the nitrogen use efficiency (NUE) on the different hybrids of maize (Balko and Russell, 1980;
Muruli and Paulsen, 1981; 1982; Akintoye et al., 1999). In general, there is any
report about N uptake efficiency to be less than 40% globally (Raun et al., 2002). Denitrification, soil erosion, leaching and volatilization are correlating with the efficiency of N on low recovery (Fageria and Baligar, 2005). Effect of the nitrogen depends 24–48% on nitrogen fertilizer forms (Abbasi et al., 2013). In cereals, nitrogen use efficiency reported ranged from 28% to 41%
(Zhu and Wen, 1992). Other researchers reported that the NPK fertilizers re- sulted in more yield than other fertilizers with similar nitrogen content. This result shows that potassium is an important factor for increasing of yield (Duan et al., 2014). Phosphorus is a very important parameter for efficien- cy fertilizers and nitrogen fertilizers. Thus, phosphorus use efficiency is a big concern for farmers (Schröder et al., 2011). Results of research in China showed that phosphorus use efficiency averaged 13.01 (3.0% to 49.3%) on 165 fields of cereals (Li et al., 1998; Zhu and Wen, 1992).
The purpose of this study was to evaluate the interaction between traits of tow hybrids maize in the different levels of fertilizer in Hungary by GGE biplot.
Method and materials
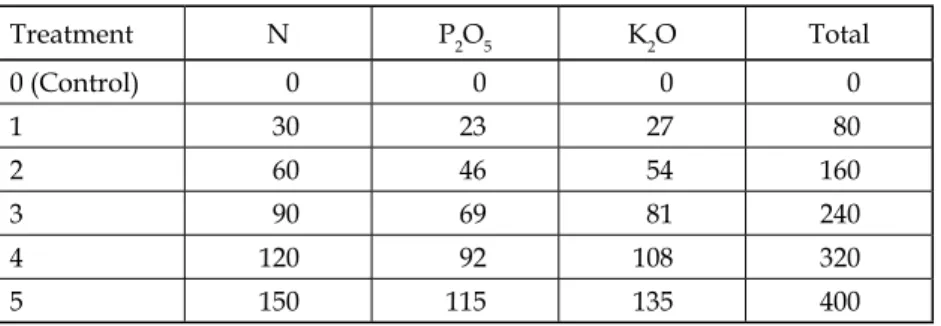
In this study, the experimental farm was located at the University of Deb- recen and our experiment was carried out in the Centre for Agricultural Sciences, Institute of Crop Sciences at Látókép. The site is located in Eastern Hungary, 15 km from Debrecen in the Hajdúság Loess region, where the soil is calcareous chernozem (N 47°33', E 21°27'). The experimental soil was well culture-state, medium-hard loam. Its humus content is medium, 2.8%, its pH value is almost neutral, pHKCl = 6.2. The soil has proper water manage- ment characteristics. The hybrids studied in the experiment were H340(FAO 340) and H410(FAO 410). The hybrids were sown with a seed number of 72,000 plants/ha. We applied six fertilization treatments (Table 1). Nitrogen was applied in the form of 34% ammonium-nitrate (50% in the spring), the nitrogen 50% and the phosphorus and potassium fertilizers were solicited in full dosage (100%) in the autumn as a 10:15:18 special complex fertilizer.
Table 1. Fertilizer used of long-term experiment (Debrecen, chernozem soil)
Treatment N P2O5 K2O Total
0 (Control) 0 0 0 0
1 30 23 27 80
2 60 46 54 160
3 90 69 81 240
4 120 92 108 320
5 150 115 135 400
The amount of rainfall was 291 mm after sowing until harvest time (Ta- ble 2).
Result
Simple and compound variance analysis
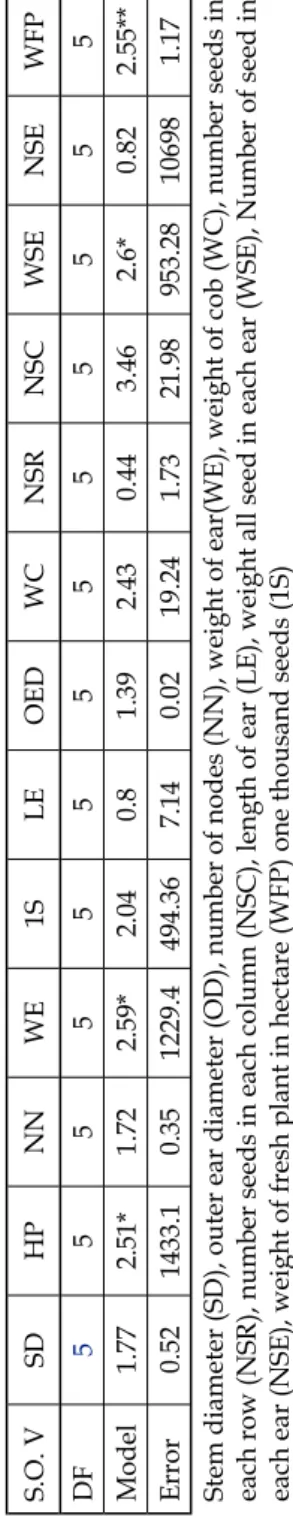
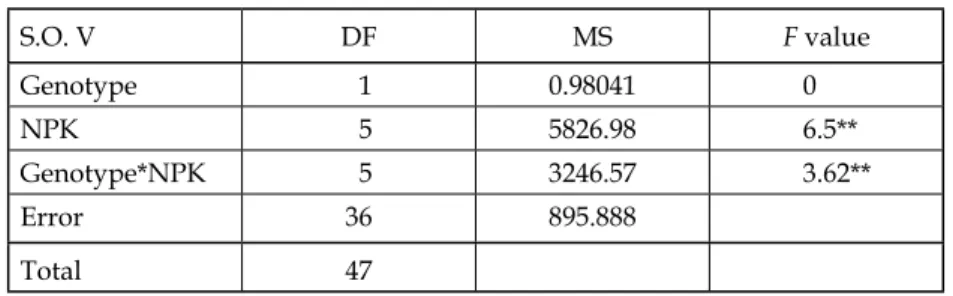
According to a simple variance, there are traits between plant height, ear weight, cob ear weight, the weight of the seeds in ear significance in 5 per- cent in H340 also, the weight of fresh plant in 1 percent. This study states that traits were variable in different level fertilizers (Table 3). Also, simple vari- ance showed that there was significance at one percent between traits weight of ear, the weight of cob ear, weight of the seeds in the ear, and weight of the fresh plant in hectare in H410. The study also revealed that traits were vari- able in different level fertilizers (Table 4). The compound variance showed a level of fertilizer and interaction between fertilizer and genotypes were sig- nificant at one percent. Effect of genotypes was a variable different level of fertilizer and we have a different yield in the level of fertilizer (Table 5).
Bencze et al. showed that, based on analysis of variance, the difference in yield of both years were formed only for N levels. The growth of P and K levels were significant only in one year and its effects have been growing trendy. The role of phosphorus and potassium in corn grains is reduced and most of them affect the physiological process of corn. Effect on yield was less because it was based on different interactions (Bencze et al., 2017).
Classification of traits by factor analysis and cluster
We obtained important factors in yield by main factor analysis. This analysis showed that 4 main factors justified approximately 72% of all data. Accord- ing to the analysis, first factor was related to traits ear, such as the weight of ear, weight of seeds in ear and number of seeds in an ear that all traits men-
Table 2. Precipitation and average weather index of this research
Month Precipitation Temperature Radiation
April (after 24th) 6.1 18.04 22.09
May 57.4 19.73 23.24
Jun 63.6 20.24 21.16
July 54.6 21.66 22.53
August 92.2 23.17 20.51
September 13.6 17.13 15.41
October (until harvest time) 2.0 12.25 10.53
Table 3. Simple variance H 340 hybrid S.O. VSDHPNNWE1SLEOEDWCNSRNSCWSENSEWFP DF5555555555555 Model1.772.51*1.722.59*2.040.81.392.430.443.462.6*0.822.55** Error0.521433.10.351229.4494.367.140.0219.241.7321.98953.28106981.17 Stem diameter (SD), outer ear diameter (OD), number of nodes (NN), weight of ear(WE), weight of cob (WC), number seeds in each row (NSR), number seeds in each column (NSC), length of ear (LE), weight all seed in each ear (WSE), Number of seed in each ear (NSE), weight of fresh plant in hectare (WFP) one thousand seeds (1S) Table 4. Simple variance H410 hybrid S.O. VSDHPNNWE1SLEOEDWCNSRNSCWSENSEWFP DF5555555555555 Model0.811.30.57.38**2.240.710.865.93**1.051.75.59**1.76.13** Error0.01479.890.56504.35621.69.580.028.182.0636.14566.1536.01201.01 Stem diameter (SD), outer ear diameter (OD), number of nodes (NN), weight of ear(WE), weight of cob (WC), number seeds in each row (NSR), number seeds in each column (NSC), length of ear (LE), weight all seed in each ear (WSE), Number of seed in each ear (NSE), weight of fresh plant in hectare (WFP) one thousand seeds (1S)
tion covered 30 percent of the total variance. The second factor covered fresh yield of a plant by 17 percent of total variance and we can make the name of the second factor to biological factor. The third factor of main factor analysis included traits related to the vegetative growth stage that was covered by 15 percent of total variance. In this study, we can coin the term, the third factor to vegetative growth factor (Table 6). Cluster figure showed us that traits for this study divided into 3 sections. The first group was traits related to vege- tative growth including stem diameter, to the weight of fresh plant and num- ber of the nodes. Second group traits were related to seeds that included the
Table 6. Factor analysis in Fao410 and Fao340 hybrids
Variable Factor1 Factor2 Factor3 Factor4
Stem diameter 0.481 –0.352 0.050 –0.346
Outer ear diameter (CM) 0.308 –0.138 0.664 0.386
Number of nodes (PCS) 0.206 0.315 0.347 –0.290
Weight of ear 0.870 0.398 –0.237 0.041
Weight of COB 0.828 0.376 –0.311 0.022
Number seeds in each row 0.228 –0.228 0.109 0.836
Number seeds in each column 0.523 –0.203 0.480 –0.299
Length of ear 0.259 –0.191 0.530 –0.388
Weight all seed in each ear 0.861 0.420 –0.223 –0.008
Number of seeds in each ear 0.632 –0.266 0.494 0.195
1000 seeds 0.555 0.084 –0.169 0.080
Weight of plant wet in hectare 0.340 –0.811 –0.424 –0.058 Weight of plant dries in hectare 0.325 –0.820 –0.403 –0.068
Variance 3.8757 2.2573 1.9047 1.3452
% var 0.298 0.174 0.147 0.103
Table 5. Compound variance H410 and H340
S.O. V DF MS F value
Genotype 1 0.98041 0
NPK 5 5826.98 6.5**
Genotype*NPK 5 3246.57 3.62**
Error 36 895.888
Total 47
weight of cob ear, the weight of seeds in an ear, the weight of one thousand seeds that we can name grain yield group. In the final analysis, third group traits were related to ear including a number of seeds in row and column, the number of seeds in the ear and length of an ear (Fig. 1).
Among the authors, Hejazi showed that traits of seed rows per ear and ear diameter and ear length explained 47.4% of the variation coefficients high positive in the first factor. Twenty-two percent of the variation explained in the second factor by grain yield and number of grains per ear. The third fac- tor (cob weight) was 14.8% of the variation of the plant height, ear height and plant height (Hejazi et al., 2013).
Effect of traits in fertilizer’s levels by GGE biplot in H410 Hybrid
Determination of the ideal traits of different levels of fertilizer using the GGE biplot graphical method
The graph result shows the ideal traits. Ideal traits have the highest recogni- tion and representation abilities between other traits. Based on this, the ear weight and grain weight per ear were recognized as an ideal trait due to its proximity to the centre of the axis. Finally, as seen in the plot, the outer diam-
Fig. 1. Cluster and classification of the traits
eter of the ear was introduced as the weakest trait due to having the greatest distance from the centre of the dual axis. It should be noted that the ideal trait is an appropriate representative for the study of the effects of fertilizer levels (although this does not reject the results of other traits). In fact, the ideal trait represents the most ideal response pattern for fertilizer levels (Fig. 2).
Determination of the ideal fertilizer level for the studied traits using the GGE biplot graphical method
One of the important applications of biplots is to identify the best fertiliz- er levels based on a various index or measured traits. The graph shows the number of fertilizer’s levels based on the ideal fertilizer level. The ideal fer- tilizer is a level of fertilizer that is oriented towards the positive end of the middle axis of the various levels of fertilizer and its perpendicular distance from this line is reached minimum. To compare the different levels of ferti- lizer with the ideal level of the central axis this level is drawn. Other levels of fertility are arranged based on similarity and proximity to the ideal level Fig. 2. Ranking of fertilizer levels with traits in H410 hybrid (stem diameter (SD), outer ear diameter (OD), number of nodes (NN), weight of ear(WE), weight of cob (WC), number seeds in each row (NSR), number seeds in each column (NSC), length of ear (LE), weight all seed in each ear (WSE), Number of seed in each ear (NSE), weight of fresh plant in
hectare (WFP) one thousand seeds (1S).0-5 level of the NPK)
and it is easy to know the level of fertilizer or levels. On this basis, the ideal levels are level fourth and the desired levels are then fifth, second, first, third and zeroth. Levels fourth and fifth are the most desirable levels for the fresh weight of the plant (Fig. 3).
Effect of traits in fertilizer’s levels by GGE biplot in H340 Hybrid
Determination of the ideal traits of different levels of fertilizer using the GGE biplot graphical method
The graph shows the ideal traits. Ideal traits actually have the highest rec- ognition and representation abilities between other traits. Based on this, the weight of ear and the weight grain per ear were recognized as an ideal trait due to its proximity to the centre of the axis. Ultimately, as seen in this plot, Fig. 3. Ranking of fertilizer levels with traits in H410 hybrid (stem diameter (SD), outer ear diameter (OD), number of nodes (NN), weight of ear(WE), weight of cob (WC), number seeds in each row (NSR), number seeds in each column (NSC), length of ear (LE), weight all seed in each ear (WSE), Number of seed in each ear (NSE), weight of fresh plant in
hectare (WFP) one thousand seeds (1S).0-5 level of the NPK)
ear altitude was introduced as the weakest attribute due to having the great- est distance from the centre of the axis. It should be noted that the ideal trait is an appropriate representative for the study of the effects of fertilizer levels (although this does not reject the results of other traits). In fact, the ideal trait represents the most ideal response pattern for fertilizer levels (Fig. 4).
Determination of the ideal fertilizer level for the studied traits using the GGE biplot graphical method
One of the important applications of biplots is to identify the best fertiliz- er levels based on a various index or measured traits. The graph shows the number of fertilizer levels based on the ideal fertilizer level. The ideal fertiliz- er is a level of fertilizer that is oriented towards the positive end of the middle axis of the various levels of fertilizer and its perpendicular distance from this line is minimal. To compare the different levels of fertilizer with an ideal lev- el, the centre line of the coils is drawn to the centre of this level of fertilizer.
Other levels of fertility are arranged based on similarity and proximity to the Fig. 4. Ranking of fertilizer levels with traits in 340 hybrid (stem diameter (SD), outer ear diameter (OD), number of nodes (NN), weight of ear(WE), weight of cob (WC), number seeds in each row (NSR), number seeds in each column (NSC), length of ear (LE), weight all seed in each ear (WSE), Number of seed in each ear (NSE), weight of fresh plant in
hectare (WFP) one thousand seeds (1S).0-5 level of the NPK)
ideal level and it is easy to know the level of fertilizer or levels of fertilizer.
Based on this, the ideal level is the fourth level and the desired levels are then third, second, first, fifth and zeroth levels. Fourth and third levels are the most desirable levels of fertilizer in terms of yield traits (Fig. 5).
Conclusion
A few ecological and biological factors influence the number of nutrients used in fertilizers (Fageria and Baligar, 2005; Cui et al., 2006). The researchers’ re- sults about the different nutritious utilization and fertilizers of maize hybrids show that yield in the nitrogen opt + phosphorus and potassium treatment have highest yield in this treatment. There are four different classifications about valuable hybrids that these were increasing yield more than the control treatment. (Pepo, 2006). In this study, the weight of seeds in ear and weight of ear were important traits for yield in H410 hybrid. Also, the fourth of the fertilizer level was the best level of fertilizer for yield in this hybrid. There is the highest relation in yield between the fourth level of fertilizer with weight Fig. 5. Ranking of fertilizer levels with traits in 340 hybrid (stem diameter (SD), outer ear diameter (OD), number of nodes (NN), weight of ear(WE), weight of cob (WC), number seeds in each row (NSR), number seeds in each column (NSC), length of ear (LE), weight all seed in each ear (WSE), Number of seed in each ear (NSE), weight of fresh plant in
hectare (WFP) one thousand seeds (1S).0-5 level of the NPK)
of fresh plant, fifth level of fertilizer with weight of the one thousand seeds and first and second level of fertilizer with length of the ear in H410. Weight of fresh plant and weight of seeds in ear had been highest in relation with yield in H340 hybrid. Fourth of fertilizer level had more relation with stem diameter for yield, third of fertilizer level with the weight of cob and first and second and fifth of fertilizer level with outer diameter too. Our study showed fourth of fertilizer level was the best level of fertilizer on H410 and H340 hybrid in Debrecen region. Research results in this paper can successfully contribute to the science of maize genotypes, to the exploration of their traits and to an application of fertilizers adapted to the given hybrid.
Acknowledgements
The research was financed by the Higher Education Institutional Excellence Programme of the Ministry of Human Capacities in Hungary, within the framework of the 4. thematic programme of the University of Deb recen, and the projects “GINOP-2.2.1-15-2016-00001 – Developing a scale-in- dependent complex precision consultancy system” and “EFOP-3.6.3- VEKOP-16-2017-00008”.
References
Akintoye, H. A., Kling, J. G., Lucas, E. O. (1999) N-use efficiency of single, double and synthetic maize lines grown at four N levels in three ecological zones of West Africa.
Field Crops Res. 60: 189–199.
Balko, L. G., Russell, W. A. (1980) Effects of rates of nitrogen fertilizer on maize inbred lines and hybrid progeny. I: Prediction of yield responses. Maydica 25: 65–79.
Bencze, G., Futó, Z. (2017) Effect of nutriment elements (NPK) to the crop of maize (Zea mays L.) in the year of 2016–2017. Research Journal of Agricultural Science 49(4): 46–53.
Cui, Z. L., Chen, X. P., Li, J. L., Xu, J. F., Shi, L. W., Zhang, F. S. (2006) Effect of N fertiliza- tion on grain yield of winter wheat and apparent N losses. Pedosphere 16: 806–812.
Devkota, M., Martius, C., Lamers, J. P. A., Sayre, K. D., Devkota, K. P., Gupta, R. K., Egam- berdiev, O., Vlek, P. L. G. (2013) Combining permanent beds and residue retention with nitrogen fertilization improves crop yields and water productivity in irrigated arid lands under cotton, wheat and maize. Field Crop Res. 149: 105–114.
Duan, Y., Xu, M., Gao, S., Yang, X., Huang, S., Liu, H., Wang, B. (2014) Nitrogen use efficiency in a wheat-corn cropping system from 15 years of manure and fertilizer applications. Field Crops Res. 157: 47–56.
FAO (2009). How to Feed the World in 2050. Executive Summary, Food and Agriculture Organization of the United Nations.
Fageria, N. K., Baligar, V. C. (2005) Enhancing nitrogen use efficiency in crop plants. Ad- vances in Agron. 88: 97–185.
Heisey, P., Norton, G. W. (2007) Fertilizer and other chemicals. In: Evenson, R. and Pinga- li, P. (eds). Handbook of Agricultural Economics, Vol. 3, p. 2747–2783. Elsevier BV, Amsterdam
Hejazi, P., Mousavi, S. M. N., Mostafavi, K., Ghomshei, M. S., Hejazi, S., Navid Mousavi, S. M. (2013) Study on hybrids maize response for drought tolerance index. Advances in Environmental Biology 7(2): 333–338.
Li, Q. K., Zhu, Z. L., Yu, T. R. (1998) Fertilizer Questions in Sustainable Development of Agriculture in China. Jiangxi Science and Technology Press, Jiangxi, China, pp. 3–5.
Li, X. X., Hu, C. S., Delgado, J. A., Zhang, Y. M., Ouyang, Z. Y. (2007) Increased nitrogen use efficiencies as a key mitigation alternative to reduce nitrate leaching in North China Plain. Agric. Water Manage. 89: 137–147.
Ladha, J. K., Pathak, H., Krupnik, T. J., Six, J., van Kessel, C. (2005) Efficiency of fertilizer nitrogen in cereal production: retrospects and prospects. Adv. Agron. 87: 85–156.
Liu, X. J., Ju, X. T., Zhang, F. S., Pan, J. R., Christie, P. (2003) Nitrogen dynamics and bud- gets in a winter wheat–maize cropping system in the North China Plain. Field Crops Res. 83: 111–124.
Lü, P., Zhang, J. W., Liu, W., Yang, J. S., Su, K., Liu, P., Dong, S. T., Li, D. H. (2011) Effects of nitrogen application on yield and nitrogen use efficiency of summer maize under super-high yield conditions. Plant Nutr. Fertil. Sci. 17: 852–860.
Muruli, B. I., Paulsen, G. M. (1981) Improvement of nitrogen-use efficiency and its rela- tionship to other traits in maize. Maydica 26: 63–73.
Nagy, J. (2006) Maize Production. Akadémiai Kiadó, Budapest
Pepó, P., Vad, A., Berényi, S. (2006) Effect of some agrotechnical elements on the yield of maize on chernozem soil. Cereal Res. Commun. 34: 621–624.
Pepó, P., Vad, A., Berényi, S. (2008) Effects of irrigation on yields of maize (Zea mays L.) in different crop rotation. Cereal Res. Commun. 36: 735–738.
Pepó, P., Karancsi, L.G. (2014) New results of nutrient utilization and response of maize (Zea mays L.) hybrids.journal of agricultural and environmental sciences vol. 1, no. 2.
Raun, W. R., Solie, J. B., Johnson, G. V., Stone, M. L., Mullen, R. W., Freeman, K. W., Thomason, W. E., Lukina, V. (2002) Improving nitrogen use efficiency in cereal grain production with optical sensing and variable rate application. Agron. J. 94: 815–820.
Schröder, J. J., Smith, A. L., Cordell, D., Rosemarin, A. (2011) Improved phosphorus use efficiency in agriculture, a key requirement for its sustainable use. Chemosphere 84:
822–831.
Smil, V. (2011a) Harvesting the Biosphere: How Much We Have Taken from Nature. Cam- bridge, MA, The MIT Press. In press.
Tilman, D., Balzer, C., Hill, J., Befort, B. L. (2011) Global food demand and the sustainable intensification of agriculture. PNAS Early Edition. Available online: www.pnas.org/
cgi/doi/10.1073/pnas.1116437108.
Van Groenigen, J. W., Velthof, G. L., Oenema, O., Van Groenigen, K. J., Van Kessel, C.
(2010) Towards an agronomic assessment of N2O emissions: a case study for arable crops. Eur. J. Soil Sci. 61: 903–913.
Zhu, Z. L., Wen, Q. X. (1992) Soil Nitrogen in China. Jiangsu Science and Technology Press. Jiangsu, China. pp. 228–231.
Open Access statement. This is an open-access article distributed under the terms of the Creative Commons Attribution 4.0 International License (https://creativecommons.org/
licenses/by/4.0/), which permits unrestricted use, distribution, and reproduction in any medium, provided the original author and source are credited, a link to the CC License is provided, and changes – if any – are indicated. (SID_1)