USING e-ANNOTATION TOOLS FOR ELECTRONIC PROOF CORRECTION TION
Once you have Acrobat Reader open on your computer, click on the Comment tab at the right of the toolbar:
This will open up a panel down the right side of the document. The majority of tools you will use for annotating your proof will be in the Annotations section, pictured opposite. We’ve picked out some of these tools below:
1. Replace (Ins) Tool – for replacing text.
Strikes a line through text and opens up a text box where replacement text can be entered.
How to use it
• Highlight a word or sentence.
• Click on the Replace (Ins) icon in the Annotations section.
• Type the replacement text into the blue box that appears.
2. Strikethrough (Del) Tool – for deleting text.
Strikes a red line through text that is to be deleted.
How to use it
• Highlight a word or sentence.
• Click on the Strikethrough (Del) icon in the Annotations section.
3. Add note to text Tool – for highlighting a section to be changed to bold or italic.
Highlights text in yellow and opens up a text box where comments can be entered.
How to use it
• Highlight the relevant section of text.
• Click on the Add note to text icon in the Annotations section.
• Type instruction on what should be changed regarding the text into the yellow box that appears.
4. Add sticky note Tool – for making notes at specific points in the text.
Marks a point in the proof where a comment needs to be highlighted.
How to use it
• Click on the Add sticky note icon in the Annotations section.
• Click at the point in the proof where the comment should be inserted.
• Type the comment into the yellow box that appears.
USING e-ANNOTATION TOOLS FOR ELECTRONIC PROOF CORRECTION TION
5. Attach File Tool – for inserting large amounts of text or replacement figures.
Inserts an icon linking to the attached file in the appropriate place in the text.
How to use it
• Click on the Attach File icon in the Annotations section.
• Click on the proof to where you’d like the attached file to be linked.
• Select the file to be attached from your computer or network.
• Select the colour and type of icon that will appear in the proof. Click OK.
6. Drawing Markups Tools – for drawing shapes, lines and freeform annotations on proofs and commenting on these marks.
Allows shapes, lines and freeform annotations to be drawn on proofs and for comment to be made on these marks.
How to use it
• Click on one of the shapes in the Drawing Markups section.
• Click on the proof at the relevant point and draw the selected shape with the cursor.
• To add a comment to the drawn shape, move the cursor over the shape until an arrowhead appears.
• Double click on the shape and type any text in the red box that appears.
ORIGINAL RESEARCH
Simultaneous measurement of mitochondrial respiration and ATP production in tissue homogenates and calculation of effective P/O ratios
KarineSalin1, Eugenia M.Villasevil1,Sonya K.Auer1,Graeme J.Anderson1,ColinSelman1, Neil B.Metcalfe1 &ChristosChinopoulos2,3
1
1 Institute of Biodiversity, Animal Health and Comparative Medicine, University of Glasgow, Glasgow, UK 2 Department of Medical Biochemistry, Semmelweis University, Budapest, Hungary
3 MTA-SE Lend€ulet Neurobiochemistry Research Group, Budapest, Hungary
Keywords
ATPase, fluorescence, magnesium green, oxidative phosphorylation, oxygraph.
Correspondence
Karine Salin, Institute of Biodiversity, Animal Health and Comparative Medicine, University of Glasgow, Graham Kerr Building, Glasgow G12 8QQ, UK.
Tel: 0044-141-330-3534 2
Fax: ????
E-mail: salin.karine@gmail.com Funding Information
We acknowledge financial support from a European Research Council Advanced Grant (number 322784 to NBM).
Received: 22 September 2016; Accepted: 23 September 2016
doi: 10.14814/phy2.13007 Physiol Rep, 4 (18), 2016, e13007, doi: 10.14814/phy2.13007
Abstract
The use of tissue homogenate has greatly aided the study of the functioning of mitochondria. However, the amount of ATP produced per oxygen molecule consumed, that is, the effective P/O ratio, has never been measured directly in tissue homogenate. Here we combine and refine existing methods previously used in permeabilized cells and isolated mitochondria to simultaneously mea- sure mitochondrial ATP production (JATP) and oxygen consumption (JO2) in tissue homogenate. A major improvement over existing methods is in the control of ATPases that otherwise interfere with the ATP assay: our modified technique facilitates simultaneous measurement of the rates of “uncorrected”
ATP synthesis and of ATP hydrolysis, thus minimizing the amount of tissue and time needed. Finally, we develop a novel method of calculating effective P/O ratios which corrects measurements ofJATP andJO2for rates of nonmi- tochondrial ATP hydrolysis and respiration, respectively. Measurements of JATP and JO2 in liver homogenates from brown trout (Salmo trutta) were highly reproducible, although activity declined once homogenates were 2 h old. We compared mitochondrial properties from fed and food-deprived ani- mals to demonstrate that the method can detect mitochondrial flexibility in P/O ratios in response to nutritional state. This method simplifies studies examining the mitochondrial bioenergetics of tissue homogenates, obviating the need for differential centrifugation or chemical permeabilization and avoiding the use of nonmitochondrial ATPase inhibitors. We conclude that our approach for characterizing effective P/O ratio opens up new possibilities in the study of mitochondrial function in very small samples, where the use of other methods is limited.
Introduction
Mitochondria are responsible for oxidation of food mole- cules to convert energy in the form of ATP that fuels cell functions (i.e., muscle contraction, protein synthesis, gene replication, ion homeostasis). As mitochondria produce about 90% of the cellular ATP (Lehninger et al. 1993), variation in the amount of ATP produced per unit of oxygen consumed, that is, the effective P/O ratio, have
significant consequences at all levels of biological organi- zation. Variation in effective P/O ratio is known to affect energy homeostasis in cells, and thus tissues function (Pham et al. 2014; Layec et al. 2015) and ultimately, dis- ease pathologies and normal aging (Brand 2005; Wu et al.
2007; Kadenbach et al. 2013; Conley 2016). In extreme environmental conditions such as cold, starvation and hypoxia, mitochondrial efficiency has been suggested to be a major physiological adaptation for regulating energy 1
2 3 4 5 6 7 8 9 10 11 12 13 14 15 16 17 18 19 20 21 22 23 24 25 26 27 28 29 30 31 32 33 34 35 36 37 38 39 40 41 42 43 44 45 46 47 48 49 50 51 52 53
ª2016 The Authors.Physiological Reportspublished by Wiley Periodicals, Inc. on behalf of the American Physiological Society and The Physiological Society.
This is an open access article under the terms of the Creative Commons Attribution License,
which permits use, distribution and reproduction in any medium, provided the original work is properly cited.
2016 | Vol. 4 | Iss. 18 | e13007 Page 1
PHY213007Dispatch:7.10.16CE:Saranya JournalCodeManuscriptNo.No.ofpages:9PE:SharmilaK Physiological Reports ISSN 2051-817X
homeostasis in the organism (Gnaiger et al. 2000; Trz- cionka et al. 2008; Monternier et al. 2014). However, while methods of evaluating mitochondrial efficiency have received much attention (Hinkle 2005; Van Bergen et al.
2014), measuring P/O ratios has proved to be challenging (Ferguson 2010).
The mitochondrial preparation required for assaying bioenergetics involves numerous steps encompassing dif- ferential centrifugation or bath transfer (Van Bergen et al.
2014), making it technically challenging to obtain a suffi- cient amount of mitochondria from tissues smaller than those of a mouse (Chinopoulos et al. 2011). This limita- tion has motivated current efforts to implement the high yield technique of homogenization that is capable of recovering 100% of the tissue sample for use in the mito- chondrial analysis (Pecinova et al. 2011; Makrecka-Kuka et al. 2015; Rovenko et al. 2015; Ziak et al. 2015; Salin et al. 2016). Tissue homogenate offers the advantage of studying mitochondrial function close to physiological conditions, therefore differences in mitochondrial proper- ties observed in homogenates may better reflect physio- logical processes that will occur in the animal (Kuznetsov et al. 2002; Burtscher et al. 2015). However, the problem emerges that homogenates contain ATPases that interfere with the ATP assay.
Techniques used to measure ATP production (JATP) that are compatible with simultaneous measurement of mitochondrial oxygen consumption (JO2) have included:
(1) estimation of mitochondrial ADP consumption (Estabrook 1967), (2a) direct and (2b) indirect assays of changes in ATP concentration (Ouhabi et al. 1998; Salin et al. 2010a), and (3) measurement of changes in free magnesium concentration, [Mg2+] (Chinopoulos et al.
2009). Technique 1 can produce biased measures ofJATP when using tissue homogenates due to the presence of nonmitochondrial ATPases. Technique 2b allows mea- surement of this ATPase activity so that the JATP value can be corrected, but this correction requires twice the amount of tissue and time (Salin et al. 2012a). The pres- ence of ATPase may also affectJATP measurements using technique 3. Techniques 2a and 3 aim to block the action of ATPase so as to prevent ATP hydrolysis (Ouhabi et al.
1998; Chinopoulos et al. 2014), but the efficacy of inhibi- tors may depend on the tissue, study model or mitochon- drial preparation.
Here, we describe a protocol for measuring effective P/
O ratios that simultaneously quantifies both JATP and JO2 in tissue homogenate, using a combination of tech- niques 2b and 3. As with technique 3, we use the magne- sium-sensitive fluorescent probe, Mg Green, to estimate changes in [Mg2+] (Szmacinski and Lakowicz 1996).
Mitochondrial JATP is calculated from the rate of change in [Mg2+] and is based on the unequal affinities of ATP
and ADP for Mg2+(Leyssens et al. 1996). Nonmitochon- drial ATPase activity is measured as in technique 2b by inhibiting the mitochondrial ATP flux (Salin et al.
2010a), allowing correction of JATP. Our modified tech- nique facilitates simultaneous measurement of the rates of
“uncorrected” ATP synthesis and of ATP hydrolysis, thus minimizing the amount of tissue and time needed. We validate the technique and calculate JATP, JO2 and the effective P/O ratio, using liver homogenates from juvenile brown trout (Salmo trutta). We compare P/O ratios of fed and starved fish to determine whether our approach was a specific and sensitive assay to detect variation in P/
O ratio in tissue homogenate. We chose liver because hepatic mitochondria are known to change their proper- ties in response to food availability. Attempts to assess the role of mitochondria in the regulation of energy homeostasis during fasting have been addressed in mam- mals (Bobyleva-Guarriero et al. 1984; Brand et al. 1993;
Dumas et al. 2004), birds (Bobyleva-Guarriero et al. 1984;
Monternier et al. 2015), amphibians (Trzcionka et al.
2008) and fish (Savina et al. 2009; Bermejo-Nogales et al.
2015). Of note, the role of the liver in the control of car- bohydrate and lipid homeostasis is essential for providing substrates to others tissues during fasting (Postic et al.
2004). In fish, there is a large body of evidence illustrating adaptive changes in enzymatic activities of the oxidative phosphorylation pathway (Guderley et al. 2003; Frick et al. 2008; Bermejo-Nogales et al. 2015), but whether their effective P/O ratio shows similar flexibility has so far not been determined.
Methods
Animal husbandry
Juvenile brown trout were obtained from a hatchery (Howietoun, UK) in summer 2015 and moved to the University of Glasgow. Here, the fish were kept in a com- munal tank and maintained under an 8 h light: 16 h dark photoperiod at 12°C and fed daily in excess (pellets EWOS, West Lothian, UK). In January 2016, twenty four fish were transferred to individual compartments of a stream tank. Because of the logistical constraints associ- ated with assaying fresh mitochondria, transfers of the fish to individual compartments were staggered over 12 days (two fish per day). All fish were first acclimated for a week and fed daily to excess prior to the start of the food treatments. Half of the fish were randomly allocated to an ad libitum ration, while the other half was deprived of food (initial body mass: 12.140.61 vs.
12.000.57 g in the fasted and fed group). Fish were held on these treatments for 2 weeks. At the end of this period, all fish were fasted overnight. The following 1
2 3 4 5 6 7 8 9 10 11 12 13 14 15 16 17 18 19 20 21 22 23 24 25 26 27 28 29 30 31 32 33 34 35 36 37 38 39 40 41 42 43 44 45 46 47 48 49 50 51 52 53
morning (mean1 SE: 09:3000:01 h) a pair of fish was culled and their livers collected to determine mito- chondrial parameters. Fasting led to reduction in body mass (final mass fasted group: 10.852.14 g). At the same time, the fed trout had an increase in body weight (final mass fed group: 16.503.80 g). All procedures were carried out under the jurisdiction of a UK Home Office project license (PPL 60/4292).
Estimation ofKdof ATP and ADP for free magnesium (Mg2+)
The method for determining the affinity of the magnesium with nucleotides was adapted from (Chinopoulos et al.
2014). The main adjustment of the assay of the Kdis a mea- surement in the absence of tissue homogenate and ATPase inhibitors (see below). Thus, assays were made in duplicate in a buffer containing 20 mmol/L Taurine, 10 mmol/L KH2PO4, 20 mmol/L HEPES, 110 mmol/L D-sucrose, 60 mmol/L K-lactobionate, 1 g/L BSA fatty acid free, pH 7.2 and at 12°C. The titration protocol was as follows: the buffer was supplemented with pyruvate (5 mmol/L) and malate (0.5 mmol/L). Magnesium green (2.1 lmol/L), EGTA (0.1 mmol/L) and EDTA (15lmol/L) were subse- quently added to the chamber. Then, stepwise additions of MgCl2 were performed for calibration of the fluorescent
signal into Mg2+(Fig. 1). Succinate (10 mmol/L) was then added. Stepwise additions of ATP or ADP were then per- formed to determine the affinity of those nucleotides for Mg2+ (25 additions of 0.2 mmol/L ATP or 0.25 mmol/L ADP) (Fig. 1). The two Kdvalues were determined using the least squares method, described in detail in (9)(9)(8)(8) (7). The binding affinity (Kd) of ATP and ADP for Mg2+ 3 was calculated, using the method of (Chinopoulos et al.
2014); the values were Kd-ATP= 0.1545 mmol/L and Kd- ADP=2.1333 mmol/L.
The method for determining the affinity of the magne- sium with nucleotides in the presence of mitochondria and ATPase inhibitors (as in Chinopoulos et al. 2014) was not used here due to the insufficient effect of ATPase inhibitors. In particular, there was a lack of stability of the fluorescent signal (Fig. 1) after ATP additions when in the presence of homogenate (5 mg wet mass liver per ml buffer) and inhibitors (25 lmol/L adenylate kinase inhibitor Ap5A, 2 lg/mL oligomycin, 4lmol/L carboxy- 4 latractyloside, 0.2 mmol/L beryllium sulfate tetrahydrate, 5 mmol/L sodium trifluoride and 30lmol/L sodium orthovanadate). We therefore omitted ATPase inhibitors when making measurements of Kd, JATP and JO2. Thus, the insufficient effect of ATPase inhibitors on liver homo- genate motivates us to further develop a method to quan- tify the rate of ATP hydrolysis.
–KdADP with no homogenate and no inhibitors
–KdATP with homogenate and inhibitors
–KdATP with no homogenate and no inhibitors Mg2+ addition
Nucleotide addition
Time
Fluorescent signal (V)
Figure 1. Estimation ofKdof ATP and ADP for free magnesium (Mg2+). Stepwise additions of MgCl2(10 times 0.1 mmol/L) were performed to calibrate the relationship between the fluorescent signal and [Mg2+]. Stepwise additions of ATP (black line) or ADP (light gray line) were then performed to determine the affinity of those nucleotides for Mg2+(25 additions of 0.2 mmol/L ATP or 0.25 mmol/L ADP). Assays were made with buffer (see main text for composition) and at 12°C, in the presence of magnesium green (2.2lmol/L), EGTA (0.1 mmol/L) and EDTA (15lmol/L), but in the absence of tissue homogenate and ATPase inhibitors. These were omitted due to the insufficient effect of ATPase inhibitors, as shown by the lack of stability of the fluorescent signal (dark gray line) after ATP additions when in the presence of homogenate and inhibitors (see main text for details).
ª2016 The Authors.Physiological Reportspublished by Wiley Periodicals, Inc. on behalf of the American Physiological Society and The Physiological Society.
2016 | Vol. 4 | Iss. 18 | e13007 Page 3
K. Salinet al. Effective P/O Ratio in Tissue Homogenate
1 2 3 4 5 6 7 8 9 10 11 12 13 14 15 16 17 18 19 20 21 22 23 24 25 26 27 28 29 30 31 32 33 34 35 36 37 38 39 40 41 42 43 44 45 46 47 48 49 50 51 52 53
Mitochondrial homogenate preparation Liver homogenate was prepared as in (Salin et al. 2016).
Briefly, tissues (mean 1 SE: 43.08 2.02 mg) were minced to obtain a shredded solution, which was then homogenized with a Potter-Elvehjem homogenizer in a buffer containing 20 mmol/L Taurine, 10 mmol/L KH2PO4, 20 mmol/L HEPES, 110 mmol/L D-sucrose, 60 mmol/L K-lactobionate, 1 g/L BSA fatty acid free, pH 7.2. Homogenates were then diluted to obtain a final con- centration of 5 mg/mL. The entire procedure was carried out at 4°C and completed within 30 min of the fish being culled. A sample of liver homogenate was then immedi- ately added to one of the two measurement chambers of an Oroboros oxygraph
5 . The leftover preparation of liver
homogenate was preserved on ice for use in a replicate trial.
Mitochondrial rates of oxidation and phosphorylation: measurement
Oxygen and magnesium green fluorescence signals were detected simultaneously, using respirometry chambers equipped with fluorescent sensors and recorded, using
DatLab software (Oroboros Instruments, Innsbruck, Austria, as in Chinopoulos et al. 2014). Pure oxygen gas was added to the respirometry chambers to reach a concentration of 550lmol/L. The titration protocol was as follows: respiration was stimulated by adding pyru- vate (5 mmol/L) and malate (0.5 mmol/L). Magnesium green (2.1lmol/L), EGTA (0.1 mmol/L) and EDTA (15lmol/L) were subsequently added to the chamber.
Then, stepwise additions of MgCl2 were performed for calibration of the fluorescent signal into Mg2+. Succi- nate (10 mmol/L) was then added. State 3 was reached by adding a saturating concentration of ADP (2 mmol/
L). In this condition, changes in oxygen and ATP con- centrations in the chamber are representative of raw fluxes in oxygen and ATP (JO2-raw and JATPraw, respec- tively). JO2-raw reflects the rate of oxygen consumption by the mitochondria but also by nonmitochondrial reactions; JATPraw is the balance between the rate of mitochondrial ATP production and the rate of ATP disappearance due to the activity of the various ATPase enzymes (phosphorylases, phosphatases and kinases; for further details see Chinopoulos et al. 2014). Addition of carboxyatractyloside (4lmol/L), an inhibitor of ATP- ADP exchanger, allowed calculation of the rate of ATP
ADP
JO2-raw
JATPraw
JATPSt4 JO2-ROX Ant A - Rot cATR
[O2] (µmol/L) [ATP] (µmol/L)
Time (sec)
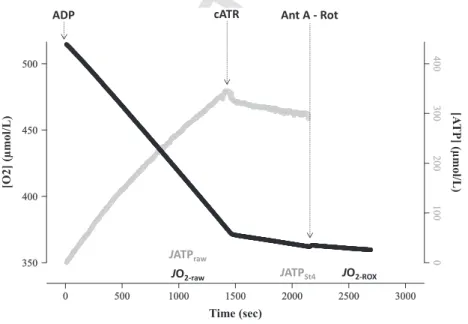
Figure 2. Output from a representative experiment, using homogenized brown trout liver, showing changes in oxygen and ATP content as a function of time. The substrates pyruvate, malate and succinate, as well as free magnesium, were present at the start of the experiment. State 3 respiration was initiated by adding 2 mmol/L ADP; the disappearance of oxygen (black line) was matched by the appearance of ATP (gray line). State 3 parameters stabilized 15 min after adding ADP, at which point rates of oxygen consumption (JO2-raw) and ATP production (JATPraw) were measured for a further 5 min. The rate of ATP disappearance due to the activity of ATPase (JATPSt4) was quantified by inhibiting the mitochondrial ATP-ADP exchange with carboxyatractyloside (cATR) (note the cessation of ATP production at this point, and reduction in oxygen consumption). Finally, the nonmitochondrial oxygen consumption (JO2-ROX) was estimated by inhibiting the respiratory chain with antimycin A (Ant A) and rotenone (Rot). Mitochondrial parameters were measured at 5 mg wet mass liver per ml at 12°C; Oxygen content in the respirometry chambers never dropped below 300lmol/L, so maintaining the liver above sensitive levels (100lmol/L in our conditions, data not shown).
1 2 3 4 5 6 7 8 9 10 11 12 13 14 15 16 17 18 19 20 21 22 23 24 25 26 27 28 29 30 31 32 33 34 35 36 37 38 39 40 41 42 43 44 45 46 47 48 49 50 51 52 53
disappearance due to ATPase activity under state 4 con- ditions (JATPSt4). Addition of complex I inhibitor, rote- none (0.5lmol/L) and complex III inhibitor, antimycin
A (2.5lmol/L) determined nonmitochondrial, or resid- ual, oxygen consumption (JO2-ROX). At each step the rates of changes in ATP and/or oxygen were allowed to stabilize. An identical trial was run on the homogenate obtained from the same fish 2 h later, in order to determine the repeatability of measurements and the stability of measurements in relation to time since sam- ple preparation.
Analysis of mitochondrial rates of oxidation and phosphorylation
Mitochondrial oxidation and phosphorylation were ana- lyzed with Microsoft Excel 2010. Free Mg2+was converted into extra-mitochondrial ATP concentration, using stan- dard binding equations previously described (Chinopou- los et al. 2014). The rate of ATP production was calculated from the linear regression of ATP concentra- tion as a function of time (Fig. 2); JATPraw was averaged over a 5 min period, starting 15 min post-ADP addition while JATPSt4was averaged over a 5 min period after flux stabilisation. JATPSt4 was then subtracted from JATPraw
to obtain the state 3 rate of mitochondrial ATP produc- tion (JATPSt3), which was expressed in pmol ATP/sec/mg wet weight of liver. Changes in oxygen concentration over time were calculated in a similar way (Fig. 2), JO2-raw
being averaged over 5 min, starting 15 min post-ADP addition, while JO2-ROX was averaged over 1–2 min after flux stabilisation. JO2-ROX was then subtracted from JO2- raw to obtain the state 3 respiration rate (JO2-St3), expressed in pmol O2/sec/mg wet weight of liver. Finally, the P/O ratio was calculated as the ratio of JATPSt3 to twofold JO2-St3; the rate of oxygen consumption is dou- bled since each molecule of oxygen is comprised of two oxygen atoms.
Chemicals
Magnesium green was purchased from Thermo Fisher Scientific (Renfrew, UK), ADP was purchase from Merck
Average of two JO2-St3trials (pmol O2sec–1mg– 1wet weight of liver) Difference in JO2-St3between trials 2 and 1 (pmol O2sec–1mg–1wet weight of liver)Difference in JATPSt3between trials 2 and 1 (pmol ATP sec–1mg–1wet weight of liver)
Average of two JATPSt3trials (pmol ATP sec–1mg–1wet weight of liver)
Difference in P/O ratio between trials 2 and 1
Average of two P/O ratio trials A
B
C
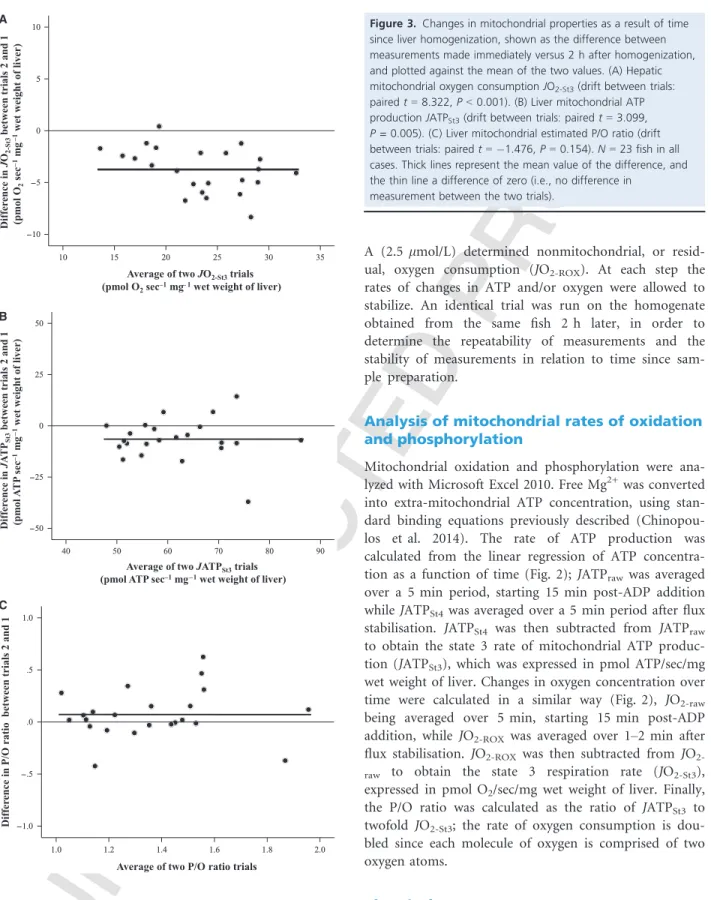
Figure 3.Changes in mitochondrial properties as a result of time since liver homogenization, shown as the difference between measurements made immediately versus 2 h after homogenization, and plotted against the mean of the two values. (A) Hepatic mitochondrial oxygen consumptionJO2-St3(drift between trials:
pairedt=8.322,P<0.001). (B) Liver mitochondrial ATP productionJATPSt3(drift between trials: pairedt=3.099, P =0.005). (C) Liver mitochondrial estimated P/O ratio (drift between trials: pairedt= 1.476,P=0.154).N=23 fish in all cases. Thick lines represent the mean value of the difference, and the thin line a difference of zero (i.e., no difference in
measurement between the two trials).
ª2016 The Authors.Physiological Reportspublished by Wiley Periodicals, Inc. on behalf of the American Physiological Society and The Physiological Society.
2016 | Vol. 4 | Iss. 18 | e13007 Page 5
K. Salinet al. Effective P/O Ratio in Tissue Homogenate
1 2 3 4 5 6 7 8 9 10 11 12 13 14 15 16 17 18 19 20 21 22 23 24 25 26 27 28 29 30 31 32 33 34 35 36 37 38 39 40 41 42 43 44 45 46 47 48 49 50 51 52 53
(Hoddesdon, UK), water was purchased from VWR (Lut- terworth, UK). All other chemicals were purchased from Sigma-Aldrich (Dorset, UK).
Statistical analysis
The reproducibility of the estimates of JO2-St3, JATPSt3, and the P/O ratio of the two trials from the same homo- genate was assessed, using Intraclass Correlation Coeffi- cients (ICC). Paired t-tests were then used to test for any consistent shifts in the values of the measurements between the first and second trial (2 h later). Finally, lin- ear mixed models were employed to test whether fed and fasted fish differed significantly in their hepatic mitochon- drial properties (mean value ofJO2-St3, JATPSt3, and P/O ratio) while taking into account any effect of testing date (included as a random factor). All statistical analyses were performed in SPSS Statistics 21 (Chicago, IL).
Results and Discussion
The reproducibility of JO2-St3 and JATPSt3measurements between the two replicate trials from the same liver homogenate was high (JO2-St3: ICC r=0.953, df =22, P<0.001; JATPSt3: ICC r=0.746, df=22, P=0.001).
As a result, the P/O ratio was also highly reproducible (ICC r=0.778, df=22, P<0.001). However, the mito- chondrial activity of homogenates declined over time, as indicated by significantly lower JO2-St3 and JATPSt3 mea- surements in the 2nd assay that was conducted 2 h after the first (Fig. 3A and B). This led to a tendency for the P/O ratio to also change over time, although this change was not significant (Fig. 3C). This lack of a significant change in P/O ratio with time posthomogenization was due to both the numerator and denominator changing in the same direction and at broadly similar rates, but this may not be the case in other tissues or for greater time intervals between assays. The temporal stability of mito- chondrial properties should therefore always be assessed when using this method, and delays between sample preparation and measurement kept to a minimum.
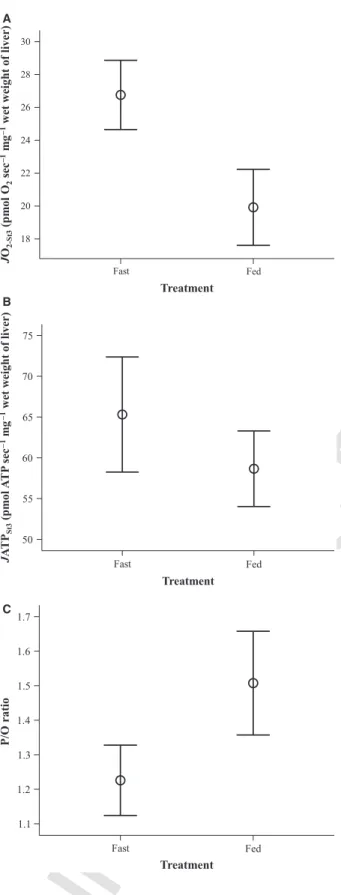
The liver mitochondria of trout starved for 14 days showed significant differences in their properties com- pared to those of fed conspecifics (Fig. 4). The mitochon- dria from fasted fish exhibited highly significantly higher rates of oxygen consumption and a trend for an increase in rates of ATP production in comparison with those of
Treatment JO2-St3(pmol O2sec–1mg–1wet weight of liver)JATPSt3(pmol ATP sec–1mg–1wet weight of liver)
Treatment
Treatment
P/O ratio
A
B
C
Figure 4.Liver mitochondrialJATP andJO2values of fasted and ad libitum-fed groups of brown trout. Food treatment significantly affected (A) mitochondrial oxygen consumption (JO2-St3:
F1,11=28.677,P<0.001), (B) mitochondrial ATP production to a lower extent (JATPSt3:F1,11=4.805,P=0.051) and (C) mitochondrial P/O ratio (F1,11=20.937,P=0.001). Shown are average values from the two replicate measurements of mitochondrial traits per fish. Data are plotted as mean1 SE.
N=12 fish per treatment group.
1 2 3 4 5 6 7 8 9 10 11 12 13 14 15 16 17 18 19 20 21 22 23 24 25 26 27 28 29 30 31 32 33 34 35 36 37 38 39 40 41 42 43 44 45 46 47 48 49 50 51 52 53
fed fish (Fig. 4A and B). As a result of this substantial increase inJO2 but lesser increase in JATP, the P/O ratio of liver mitochondria from food-deprived fish was signifi- cantly reduced compared to that of fed fish (Fig. 4C).
While an increase in coupling efficiency has been sug- gested to be a primary means by which animals reduce energy expenditure when faced with harsh conditions (Theron et al. 2000; Monternier et al. 2014; Salin et al.
2015), other studies have proposed that the P/O ratio is a major constraint in optimizing the efficiency of energy utilization
6 (Konstantinov et al. 1976; Bobyleva-Guarriero et al. 1984; Abele et al. 2002; Bottje and Carstens 2009;
Salin et al. 2012b; Conley et al. 2013). The effect of star- vation on mitochondrial properties is also likely to depend on both the tissue (Trzcionka et al. 2008; Brown et al. 2012; Crescenzo et al. 2012) and the animal species involved (Emel’yanova et al. 2007; Bottje and Carstens 2009). A reduction in the apparent P/O ratio in the liver of the food-deprived fish is consistent with previous stud- ies of chickens (Bobyleva-Guarriero et al. 1984), but con- trasts with results found in the skeletal muscle of starving penguins (Monternier et al. 2014) and in the livers of starved rats (Jung and Henke 1997). The degree to which mitochondrial properties change may also depend on the severity of the energetic challenge, for example, the dura- tion of food deprivation (Hung et al. 1997; Salin et al.
2010b). It would be profitable to test whether the effect of fasting on mitochondrial coupling efficiency is consis- tent across different tissues from the same animal, and whether the direction and magnitude of change in P/O ratio is dependent on the duration of food deprivation.
Perspectives and significance
The aim of this study was to measure simultaneously JATP andJO2 and hence the P/O ratio in tissue homoge- nate. Our approach was to use the magnesium-sensitive fluorescent probe, Mg Green, to estimate changes in [Mg2+] and in turn JATP, while correcting for ATPase interference. In our study the average P/O ratio for pyru- vate, malate and succinate oxidation was 1.367, which is only slightly lower than maximal theoretical values reported for pyruvate and malate oxidation (2.727) and for oxidation of succinate (1.636) (Brand 2005; Watt et al. 2010). This supports our conclusion that the method is appropriate for measuring effective P/O ratios.
In the conditions pertaining in our experiment, inhibitors for ATPase failed to fully inhibit ATP hydrolysis (Fig. 1).
This limitation has been overcome by inhibiting the ATP- ADP exchanger with a highly specific inhibitor, the cATR, in order to quantify rates of ATP hydrolysis. This extra step of the protocol does not require any more tissue and only a minimal amount of time for the mitochondria to
reach a steady state 4. Our method can even be used to analyze P/O ratios from permeabilized cells and isolated mitochondria. Thus, P/O ratio comparisons among spe- cies, individuals and tissues can be carried out, even across a range of mitochondrial preparations.
The Mg Green method has previously enabled evalua- tion of ATP production in permeabilized cells and iso- lated mitochondria (Chinopoulos et al. 2009, 2014).
However, such samples are not always appropriate in studies of the energy metabolism of an organism. More- over, ecology and evolutionary biology requires methods for measuring mitochondrial traits that can be applied to nonmodel organisms that potentially exhibit smaller tis- sues and a lower mitochondrial density than a laboratory mouse. We have for the first time demonstrated the feasi- bility of a method for measuring mitochondrial coupling efficiencies on homogenized tissue, showing that our method can be used to calculate effective P/O ratios from tissue samples as small as tens of milligrams. This proto- col may facilitate the study of P/O ratios in further mod- els, and shed light on the role of mitochondrial coupling efficiency in influencing fitness-related traits.
Conflict of Interest
The authors declare they have no conflict of interest. 7 References
Abele, D., K. Heise, H. O. P€ortner, and S. Puntarulo. 2002.
Temperature-dependence of mitochondrial function and production of reactive oxygen species in the intertidal mud clamMya arenaria. J. Exp. Biol. 205:1831–1841.
Bermejo-Nogales, A., J. A. Calduch-Giner, and J. Perez- Sanchez. 2015. Unraveling the molecular signatures of oxidative phosphorylation to cope with the nutritionally changing metabolic capabilities of liver and muscle tissues in farmed fish. PLoS ONE 10:e0122889.
Bobyleva-Guarriero, V., P. E. Hughes, I. Ronchetti-Pasquali, and H. A. Lardy. 1984. The influence of fasting on chicken liver metabolites, enzymes and mitochondrial respiration.
Comp. Biochem. Physiol. B 78:627–632.
Bottje, W. G., and G. E. Carstens. 2009. Association of mitochondrial function and feed efficiency in poultry and livestock species. J. Anim. Sci. 87:E48–E63.
Brand, M. D. 2005. The efficiency and plasticity of mitochondrial energy transduction. Biochem. Soc. Trans.
33:897–904.
Brand, M. D., M. E. Harper, and H. C. Taylor. 1993. Control of the effective P/O ratio of oxidative phosphorylation in liver mitochondria and hepatocytes. Biochem. J. 291:739– 748.
Brown, J. C. L., D. J. Chung, K. R. Belgrave, and J. F. Staples.
2012. Mitochondrial metabolic suppression and reactive
ª2016 The Authors.Physiological Reportspublished by Wiley Periodicals, Inc. on behalf of the American Physiological Society and The Physiological Society.
2016 | Vol. 4 | Iss. 18 | e13007 Page 7
K. Salinet al. Effective P/O Ratio in Tissue Homogenate
1 2 3 4 5 6 7 8 9 10 11 12 13 14 15 16 17 18 19 20 21 22 23 24 25 26 27 28 29 30 31 32 33 34 35 36 37 38 39 40 41 42 43 44 45 46 47 48 49 50 51 52 53
oxygen species production in liver and skeletal muscle of hibernating thirteen-lined ground squirrels. Am. J. Physiol.
Regul. Integr. Comp. Physiol. 302:R15–R28.
Burtscher, J., L. Zangrandi, C. Schwarzer, and E. Gnaiger.
2015. Differences in mitochondrial function in homogenated samples from healthy and epileptic specific brain tissues revealed by high-resolution respirometry. Mitochondrion 25:104–112.
Chinopoulos, C., S. Vajda, L. Csanady, M. Mandi, K. Mathe, and V. Adam-Vizi. 2009. A novel kinetic assay of mitochondrial ATP-ADP exchange rate mediated by the ANT. Biophys. J. 96:2490–2504.
Chinopoulos, C., S. F. Zhang, B. Thomas, V. Ten, and A. A.
Starkov. 2011. Isolation and functional assessment of mitochondria from small amounts of mouse brain tissue.
Pp. 311–324, Vol. 793inG. Manfredi and H. Kawamata eds. Neurodegeneration: methods and protocols. Humana Press Inc, Totowa, NJ.
Chinopoulos, C., G. Kiss, H. Kawamata, and A. A. Starkov.
2014. Chapter seventeen–measurement of ADP-ATP exchange in relation to mitochondrial transmembrane potential and oxygen consumption. Pp. 333–348, Vol. 542 inG. Lorenzo and K. Guido, eds. Methods in enzymology.
Academic Press, ????.
8
Conley, K. E. 2016. Mitochondria to motion: optimizing oxidative phosphorylation to improve exercise performance.
J. Exp. Biol. 219:243–249.
Conley, K. E., S. A. Jubrias, M. E. Cress, and P. Esselman.
2013. Exercise efficiency is reduced by mitochondrial uncoupling in the elderly. Exp. Physiol. 98:768–777.
Crescenzo, R., F. Bianco, I. Falcone, P. Coppola, A. G. Dulloo, G. Liverini, et al. 2012. Mitochondrial energetics in liver and skeletal muscle after energy restriction in young rats. Br. J.
Nutr. 108:655–665.
Dumas, J., D. Roussel, G. Simard, O. Douay, F. Foussard, Y.
Malthiery, et al. 2004. Food restriction affects energy metabolism in rat liver mitochondria. Biochim. Biophys.
Acta 1670:126–131.
Emel’yanova, L. V., M. V. Savina, E. A. Belyaeva, and I. V.
Brailovskaya. 2007. Peculiarities of functioning of liver mitochondria of the river lampreyLampetra fluviatilisand the common frogRana temporariaat periods of suppression and activation of energy metabolism. J. Evol. Biochem.
Physiol. 43:564–572.
Estabrook, R. W. 1967. Mitochondrial respiratory control and the polarographic measurement of ADP:O ratios. Methods Enzymol. 10:41–47.
Ferguson, S. J. 2010. ATP synthase: from sequence to ring size to the P/O ratio. Proc. Natl Acad. Sci. USA 107:16755– 16756.
Frick, N. T., J. S. Bystriansky, Y. K. Ip, S. F. Chew, and J. S.
Ballantyne. 2008. Lipid, ketone body and oxidative metabolism in the African lungfish,Protopterus dolloi
following 60 days of fasting and aestivation. Comp.
Biochem. Physiol. A Mol. Integr. Physiol. 151:93–101.
Gnaiger, E., G. Mendez, and S. C. Hand. 2000. High phosphorylation efficiency and depression of uncoupled respiration in mitochondria under hypoxia. Proc. Natl Acad.
Sci. USA 97:11080–11085.
Guderley, H., D. Lapointe, M. Bedard, and J.-D. Dutil. 2003.
Metabolic priorities during starvation: enzyme sparing in liver and white muscle of Atlantic cod,Gadus morhuaL.
Comp. Biochem. Physiol. A Mol. Integr. Physiol. 135:347– 356.
Hinkle, P. C. 2005. P/O ratios of mitochondrial oxidative phosphorylation. Biochim. Biophys. Acta 1706:1–11.
Hung, S. S. O., W. Liu, H. Li, T. Storebakken, and Y. Cui.
1997. Effect of starvation on some morphological and biochemical parameters in white sturgeon,Acipenser transmontanus. Aquaculture 151:357–363.
Jung, K., and W. Henke. 1997. Effect of starvation on antioxidant enzymes and respiratory mitochondrial functions in kidney and liver from rats. J. Clin. Biochem.
Nutr. 22:163–169.
Kadenbach, B., R. Ramzan, and S. Vogt. 2013. High efficiency versus maximal performance—the cause of oxidative stress in eukaryotes: a hypothesis. Mitochondrion 13:1–6.
Konstantinov, Y. M., V. V. Lyakhovich, and A. V. Panov.
1976. A possible role of adenine nucleotide transport in the regulation of respiration of rat liver mitochondria. Bull.
Exp. Biol. Med. 81:167–169.
Kuznetsov, A. V., D. Strobl, E. Ruttmann, A. Konigsrainer, R.
Margreiter, and E. Gnaiger. 2002. Evaluation of
mitochondrial respiratory function in small biopsies of liver.
Anal. Biochem. 305:186–194.
Layec, G., A. Bringard, Y. Le Fur, J. P. Micallef, C. Vilmen, S.
Perrey, et al. 2015. Opposite effects of hyperoxia on mitochondrial and contractile efficiency in human quadriceps muscles. Am. J. Physiol. Regul. Integr. Comp.
Physiol. 308:R724–R733.
Lehninger, A. L., D. L. Nelson, and M. M. Cosx. 1993.
Principles of biochemistry. 2nd ed. ????, Worth, NY. 9 Leyssens, A., A. V. Nowicky, L. Patterson, M. Crompton, and
M. R. Duchen. 1996. The relationship between
mitochondrial state, ATP hydrolysis, [Mg2+]i and [Ca2+]i studied in isolated rat cardiomyocytes. J. Physiol. 496:111– 128.
Makrecka-Kuka, M., G. Krumschnabel, and E. Gnaiger. 2015.
High-resolution respirometry for simultaneous measurement of oxygen and hydrogen peroxide fluxes in permeabilized cells, tissue homogenate and isolated mitochondria.
Biomolecules 5:1319–1338.
Monternier, P.-A., V. Marmillot, J.-L. Rouanet, and D.
Roussel. 2014. Mitochondrial phenotypic flexibility enhances energy savings during winter fast in king penguin chicks. J.
Exp. Biol. 217:2691–2697.
1 2 3 4 5 6 7 8 9 10 11 12 13 14 15 16 17 18 19 20 21 22 23 24 25 26 27 28 29 30 31 32 33 34 35 36 37 38 39 40 41 42 43 44 45 46 47 48 49 50 51 52 53
Monternier, P., A. Fongy, F. Hervant, J. Drai, D. Collin- Chavagnac, J. Rouanet, et al. 2015. Skeletal muscle heterogeneity in fasting-induced mitochondrial oxidative phosphorylation flexibility in cold-acclimated ducklings. J.
Exp. Biol. ???:???–???.
10
Ouhabi, R., M. Boue-Grabot, and J.-P. Mazat. 1998.
Mitochondrial ATP synthesis in permeabilized cells:
assessment of the ATP/O valuesin situ. Anal. Biochem.
263:169–175.
Pecinova, A., Z. Drahota, H. Nuskova, P. Pecina, and J.
Houstek. 2011. Evaluation of basic mitochondrial functions using rat tissue homogenates. Mitochondrion 11:722–728.
Pham, T., D. Loiselle, A. Power, and A. J. R. Hickey. 2014.
Mitochondrial inefficiencies and anoxic ATP hydrolysis capacities in diabetic rat heart. Am. J. Physiol. Cell. Physiol.
307:C499–C507.
Postic, C., R. Dentin, and J. Girard. 2004. Role of the liver in the control of carbohydrate and lipid homeostasis. Diabetes Metab. 30:398–408.
Rovenko, B. M., O. I. Kubrak, D. V. Gospodaryov, I. S.
Yurkevych, A. Sanz, O. V. Lushchak, et al. 2015. Restriction of glucose and fructose causes mild oxidative stress independently of mitochondrial activity and reactive oxygen species inDrosophila melanogaster. Comp. Biochem. Physiol.
A Mol. Integr. Physiol. 187:27–39.
Salin, K., L. Teulier, B. Rey, J. L. Rouanet, Y. Voituron, C.
Duchamp, et al. 2010a. Tissue variation of mitochondrial oxidative phosphorylation efficiency in cold-acclimated ducklings. Acta Biochim. Pol. 57:409–412.
Salin, K., Y. Voituron, J. Mourin, and F. Hervant. 2010b. Cave colonization without fasting capacities: an example with the fishAstyanax fasciatus mexicanus. Comp. Biochem. Physiol.
A Mol. Integr. Physiol. 156:451–457.
Salin, K., E. Luquet, B. Rey, D. Roussel, and Y. Voituron.
2012a. Alteration of mitochondrial efficiency affects oxidative balance, development and growth in frog (Rana temporaria) tadpoles. J. Exp. Biol. 215:863–869.
Salin, K., D. Roussel, B. Rey, and Y. Voituron. 2012b. David and Goliath: a mitochondrial coupling problem? J. Exp.
Zool. A Ecol. Genet. Physiol. 317:283–293.
Salin, K., S. K. Auer, B. Rey, C. Selman, and N. B.
Metcalfe. 2015. Variation in the link between oxygen consumption and ATP production, and its
relevance for animal performance. Proc. Biol. Sci.
282:20151028.
Salin, K., S. K. Auer, G. J. Anderson, C. Selman, and N. B.
Metcalfe. 2016. Inadequate food intake at high temperatures is related to depressed mitochondrial respiratory capacity. J.
Exp. Biol. 219:1356–1362.
Savina, M. V., L. V. Emel’yanova, S. M. Korotkov, I. V.
Brailovskaya, and A. D. Nadeev. 2009. Bioenergetics of mitochondria of the liver with biliary atresia
during prolonged starvation. Dokl. Biochem. Biophys.
425:80–83.
Szmacinski, H., and J. R. Lakowicz. 1996. Fluorescence lifetime characterization of magnesium probes: improvement of Mg2+dynamic range and sensitivity using phase-modulation fluorometry. J. Fluoresc. 6:83–95.
Theron, M., F. Guerrero, and P. Sebert. 2000. Improvement in the efficiency of oxidative phosphorylation in the freshwater eel acclimated to 10.1 MPa hydrostatic pressure. J. Exp.
Biol. 203:3019–3023.
Trzcionka, M., K. W. Withers, M. Klingenspor, and M.
Jastroch. 2008. The effects of fasting and cold exposure on metabolic rate and mitochondrial proton leak in liver and skeletal muscle of an amphibian, the cane toadBufo marinus. J. Exp. Biol. 211:1911–1918.
Van Bergen, N. J., R. E. Blake, J. G. Crowston, and I. A.
Trounce. 2014. Oxidative phosphorylation measurement in cell lines and tissues. Mitochondrion 15:24–33.
Watt, I. N., M. G. Montgomery, M. J. Runswick, A. G. W.
Leslie, and J. E. Walker. 2010. Bioenergetic cost of making an adenosine triphosphate molecule in animal
mitochondria. Proc. Natl Acad. Sci. USA 107:16823–16827.
Wu, M., A. Neilson, A. L. Swift, R. Moran, J. Tamagnine, D.
Parslow, et al. 2007. Multiparameter metabolic analysis reveals a close link between attenuated mitochondrial bioenergetic function and enhanced glycolysis dependency in human tumor cells. Am. J. Physiol. Cell. Physiol. 292:
C125–C136.
Ziak, J., A. Krajcova, K. Jiroutkova, V. Nemcova, V. Dzupa, and F. Duska. 2015. Assessing the function of
mitochondria in cytosolic context in human skeletal muscle: adopting high-resolution respirometry to homogenate of needle biopsy tissue samples.
Mitochondrion 21:106–112.
ª2016 The Authors.Physiological Reportspublished by Wiley Periodicals, Inc. on behalf of the American Physiological Society and The Physiological Society.
2016 | Vol. 4 | Iss. 18 | e13007 Page 9
K. Salinet al. Effective P/O Ratio in Tissue Homogenate
1 2 3 4 5 6 7 8 9 10 11 12 13 14 15 16 17 18 19 20 21 22 23 24 25 26 27 28 29 30 31 32 33 34 35 36 37 38 39 40 41 42 43 44 45 46 47 48 49 50 51 52 53
The contents of this page will be used as part of the graphical abstract of html only. It will not be published as part of main.
–KdADP with no homogenate and no inhibitors
–KdATP with homogenate and inhibitors
–KdATP with no homogenate and no inhibitors Mg2+ addition
Nucleotide addition
Time
Fluorescent signal (V)
Our study details a new method that simultaneously quantifies both ATP production and oxygen consumption in tissue homogenates, so for the first time allowing the calculation of P/O ratios from tissue samples as small as tens of mil- ligrams. We demonstrate that the method is highly reproducible; we compare data from fed and food-deprived animals to demonstrate that the method can detect mitochondrial flexibility in P/O ratios in response to nutritional state.
Author Query Form
Journal: PHY2 Article: 13007
Dear Author,
During the copy-editing of your paper, the following queries arose. Please respond to these by marking up your proofs with the necessary changes/additions. Please write your answers on the query sheet if there is insufficient space on the page proofs. Please write clearly and follow the conventions shown on the attached corrections sheet.
If returning the proof by fax do not write too close to the paper’s edge. Please remember that illegible mark-ups may delay publication.
Many thanks for your assistance.
Query reference Query Remarks
1 AUTHOR: Please confirm that given names (red) and surnames/family names (green) have been identified correctly.
2 AUTHOR: Please check and confirm the corresponding author address. Also, provide fax number.
3 AUTHOR: (9)(9)(8)(8)(7)—Please check if the text is presented correctly.
4 AUTHOR: Please check the use of Carboxylatractyloside here and in other instances in the article. Thank you.
5 AUTHOR: Please give manufacturer information for Oroboros oxygraph:
company name, town, state (if USA), and country.
6 AUTHOR: Konstantinov Yu et al. 1976 has been changed to Konstantinov et al.
1976 so that this citation matches the Reference List. Please confirm that this is correct.
7 AUTHOR: The journal style is NOT to include “Author Contributions”
sections. Therefore, this section has been deleted from your article. Please check if okay.
8 AUTHOR: Please provide the publisher location for reference Chinopoulos et al. (2014).
9 AUTHOR: Please provide the publisher name for reference Lehninger et al.
(1993).
10 AUTHOR: Please provide the volume number, page range for reference Monternier et al. (2015).
![Figure 1. Estimation of K d of ATP and ADP for free magnesium (Mg 2+ ). Stepwise additions of MgCl 2 (10 times 0.1 mmol/L) were performed to calibrate the relationship between the fluorescent signal and [Mg 2+ ]](https://thumb-eu.123doks.com/thumbv2/9dokorg/1380041.113746/5.918.219.682.583.929/estimation-magnesium-stepwise-additions-performed-calibrate-relationship-fluorescent.webp)