Social in fl uences normalize gambling-related harm among higher risk gamblers
ALEX M. T. RUSSELL1*, ERIKA LANGHAM2and NERILEE HING3
1Experimental Gambling Research Laboratory, School of Health, Medical and Applied Sciences, CQUniversity, Sydney, NSW, Australia
2Centre for Indigenous Health Equity Research, School of Health, Medical and Applied Sciences, CQUniversity, Cairns, QLD, Australia
3Experimental Gambling Research Laboratory, School of Health, Medical and Applied Sciences, CQUniversity, Bundaberg, QLD, Australia (Received: October 1, 2018; revised manuscript received: November 29, 2018; accepted: December 6, 2018)
Background and aims: Social influences are key drivers of gambling, and can begin in youth through parental modeling and facilitation. Over time, social influence from friends and colleagues also becomes important. Social network analysis provides a method to measure the combined nature of these social influences. This study aimed to compare social influences across gambling risk groups, by examining key characteristics of the social networks, among Australian adults.Methods:A total of 784 respondents (egos) reported their demographics, gambling behavior and gambling risk, as well as those of the 20 most influential people in their lives (alters). Egos also reported the strength of the connection between themselves and each of their alters, and between each pair of alters. Data were analyzed using egocentric social network analysis approaches.Results:Egos in higher risk groups reported more alters who gamble, including a higher proportion experiencing gambling-related harm. Relationship strength indicated that egos in higher risk groups tended to feel closer to their alters, regardless of whether the alter gambles or not. Network density (interconnectedness between alters) was greater for egos in higher risk groups. Discussion and conclusions:The findings indicate that both gambling behavior and gambling-related harm are normalized through social connections.
Greater interconnectedness in the networks of higher risk gamblers indicates difficulties in reducing or removing these influences. Thefindings indicate limitations of individualised interventions, and instead highlight the important role of changing norms within society, which can be transmitted throughout these networks.
Keywords:gambling, social network analysis, egocentric social network analysis, normalization, harm, influence
INTRODUCTION
Gambling is often promoted and experienced as a legitimate social leisure activity for adults, shared with friends and family. Gambling products and marketing incorporate and encourage interaction with others, including through social media, ostensibly promoting social connection as part of the gambling experience (Gainsbury, Delfabbro, King, & Hing, 2016; O’Loughlin & Blaszczynski, 2018). Research has potentially identified negative effects of social influences on gambling behavior, particularly problematic gambling be- havior (Raymen & Smith, 2017; Shead, Derevensky, &
Gupta, 2010; Zhai et al., 2017), including among youth (Canale et al., 2016; Dowling et al., 2016; Kristiansen, Trabjerg, & Reith, 2015). Recentfindings that, at a popula- tion level, most gambling harm is from low- and moderate- risk gamblers (Browne et al., 2016), highlight the need to improve our understanding of the determinants of harmful gambling, including social influences.
The biopsychosocial model of health offers a compre- hensive theory to explain the initiation and sustain- ment of gambling behavior (Sharpe, 2002) and recognize both unique and combined influences (Abbott et al., 2015; Blaszczynski & Nower, 2002). On a biological level, these influences include genetic predisposition
(Williams, West, & Simpson, 2012) and gender (Johansson, Grant, Kim, Odlaug, & Götestam, 2009). Psychological influences include personality (Miller et al., 2013;Nower, Derevensky, & Gupta, 2004), motivation (Gupta &
Derevensky, 2000; Williams et al., 2012), reasoning (Delfabbro & Thrupp, 2003), and mental health issues (Blaszczynski, Russell, Gainsbury, & Hing, 2016). Exami- nation of the social influences on gambling has largely focused on youth, particularly the active and passive influ- ence of family and peers. Active influences occur when someone is encouraging, pressuring, or compelling some- one to engage in a behavior such as gambling; whereas passive influences include processes of learned behavior, such as modeling and normalization (Bandura, 1977;
Bandura & Walters, 1963;Kandel & Andrews, 1987).
Early social influences on gambling behavior include perceived and actual family attitudes and behaviors toward gambling (King & Delfabbro, 2016; Saugeres, Thomas, Moore, & Bates, 2012). The passive influence of modeling
* Corresponding author: Alex M. T. Russell, BSc (Psych), GradDipSci (Merit, Psych), PhD; Experimental Gambling Research Laboratory, School of Health, Medical and Applied Sciences, CQUniversity, Level 6, 400 Kent St, Sydney, NSW 2000, Australia;
Phone: +61 2 9324 5026; E-mail:a.m.russell@cqu.edu.au This is an open-access article distributed under the terms of theCreative Commons Attribution-NonCommercial 4.0 International License, which permits unrestricted use, distribution, and reproduction in any medium for non-commercial purposes, provided the original author and source are credited, a link to the CC License is provided, and changes–if any–are indicated.
DOI: 10.1556/2006.7.2018.139
parental gambling behavior may begin early in childhood (Pitt, Thomas, Bestman, Daube, & Derevensky, 2017), although the effects have mostly been measured in adoles- cents. Parental gambling behavior has been correlated with adolescents’ gambling attitudes and intention (Pitt et al., 2017), as well as their gambling behavior (Magoon &
Ingersoll, 2006; Oei & Raylu, 2004; Wood & Griffiths, 1998). Of concern is where these influences have encour- aged the early initiation of gambling during adolescence, which is a risk for future problematic gambling (Dowling et al., 2017; Gay, Gill, & Corboy, 2016; Griffiths, 2010;
Magoon & Ingersoll, 2006). The intergenerational transmis- sion of problem gambling is related to the perceivedfinan- cial and self-enhancing benefits of gambling (Dowling et al., 2016). The relationship between parental gambling and subsequent problem gambling by the child is stronger when the parents themselves experience problems with gambling (Dowling, Jackson, Thomas, & Frydenberg, 2010; Winters, Stinchfield, Botzet, & Anderson, 2002).
Active social influences within the family include the facilitation of underage gambling by purchasing scratch cards and lotteries or placing sports bets (Hardoon, Gupta, & Derevensky, 2004; Kristiansen et al., 2015;
Reith & Dobbie, 2011), which serve to reinforce other passive influences of normalization.
Although family is the first, and often enduring social influence, as we age the social influence of family declines and that of friends and peers increases. Iterations of the reasoned action approach, such as the Theory of Planned Behavior and the Theory of Reasoned Action, explain the role of these social influences (Ajzen, 1991; Fishbein &
Ajzen, 1975). These approaches identify the role of inten- tions in driving behavior, with intentions being shaped by three factors: attitudes toward the behavior, perceptions of behavioral control, and normative beliefs (subjective norms). Subjective norms were defined by Ajzen (1991, p. 188) as“the perceived social pressure to perform or not to perform the behaviour,” with the norm more likely to influence behavior if the individual is motivated to comply (Oh & Hsu, 2001). For this reason, subjective norms are sometimes defined as what the individual thinks that“im- portant others believe the individual should do” (Finlay, Trafimow, & Moroi, 1999, p. 2382). Notably, the indivi- dual’s perception of the norm does not have to be accurate for it to influence their behavior (Cummings & Corney, 1987). Reasoned action approaches have been successfully applied to understanding gambling behavior and have iden- tified the role of subjective norms as predictors of intention and, indirectly, behavior (Dahl, Tagler, & Hohman, 2018;
Larimer & Neighbors, 2003;Martin et al., 2010;Moore &
Ohtsuka, 1999;Neighbors et al., 2007).
Research has identified social influences from both fam- ily and friends as influential in the initiation of gambling (Kristiansen et al., 2015;Reith & Dobbie, 2011). However, the causal direction between social influences and the perpetuation or escalation of gambling is less clear. Do people become more like their existing social contacts over time (social influence)? Or do new or changing interests shape social connections, through selection of new contacts who share those interests, and disconnection from those who do not (social selection)? Compared to adolescents who
gamble recreationally, those experiencing problems with gambling are more likely to have friends who also do (Dickson, Derevensky, & Gupta, 2008) and will have lost friends who do not gamble through social deselection (Gupta & Derevensky, 2000). Studies of adult males have identified similar patterns, with gambling an important part of the relationship among friendship groups, and facilitating social interaction with those outside the group when gam- bling interests aligned (Gordon, Gurrieri, & Chapman, 2015; Raymen & Smith, 2017). Gambling can maintain a sense of belonging to a social community through a
“symbolic activity that represents and reaffirms group values”(Kristiansen et al., 2015, p. 144).
Previous studies examining the relationship between social influences and gambling behavior have used correla- tional methods focused on the individual. Other public health research has demonstrated the value of examining social influence by broadening the analysis to social networks.
Social network analysis (SNA) has examined both positive and negative impacts of social influence on behaviors or conditions, such as smoking (Christakis & Fowler, 2008), obesity (Christakis & Fowler, 2007), alcohol consumption (Rosenquist, Murabito, Fowler, & Christakis, 2010), and depression (Rosenquist, Fowler, & Christakis, 2011).
Only two studies have applied SNA to gambling behav- ior, both using egocentric SNA (Meisel, Clifton, MacKillop,
& Goodie, 2015; Meisel et al., 2013). Egocentric SNA specifically studies the social networks of individuals rather than those of a population as a whole (sociocentric SNA). In an initial small study (N=40), Meisel et al. (2013) sampled pathological and non-pathological gamblers, finding that social networks around pathological gamblers included more people who gamble. They argued that this was due to people’s preference to associate with those who are similar, known as homophily. Although they found compo- sitional differences between the social networks of patho- logical and non-pathological gamblers, they did not find structural differences. In a second study of 287 undergrad- uate students from a Southern American university, also using egocentric SNA, they extended the analysis to include other addictive behavior, such as smoking, drinking, and use of marijuana,finding similar patterns of clustered behaviors (Meisel et al., 2015). Gambling behavior in this study was measured by frequency rather than a more traditional mea- sure of risk such as the Problem Gambling Severity Index (PGSI; Ferris & Wynne, 2001).
To study the social networks of gamblers at different levels of problem gambling severity, and to overcome the limitations of previous small sample sizes, this study utilized egocentric SNA using a large (N=784) adult sample of respondents.
Specifically, the study aimed to examine how the role of social influences varies among different gambler risk groups by comparing key characteristics of their social networks.
METHODS
Setting
This study was conducted in Victoria, Australia. Gambling is recognized as a legitimate leisure activity in Australia,
with an annual participation rate approximating 64% (Hing et al., 2014). About 7.9% of Australians experience some gambling-related problems, with 1.1% being classified as problem gamblers (Armstrong & Carroll, 2017). In Victoria, the participation rate is approximately 70%, with 10.4%
experiencing some gambling-related problems, and 0.7%
classified as problem gamblers (Schottler Consulting, 2015).
Respondents
A sample of 784 Victorian adults from a commercial panel provider participated in an online survey in late 2017.
Respondents were presented with an information page out- lining that the study was a social network study with questions about gambling, so that they could provide in- formed consent. A total of 2,024 potential respondents started the survey, but 548 were excluded for not meeting inclusion criteria (aged 18+with no maximum age, living in Victoria, consenting to take part, committing to providing their best answers), and a further 100 were excluded for providing poor quality data (failed attention checks). A further 592 respondents started but did not complete the survey. Thus the completion rate, based on eligible respondents, was 784/(592+784)×100=57.0%. Median completion time was 28.8 min, and respondents were compensated based on the standard practice of the research panels from which they were recruited.
The mean age of respondents was 35.3 years (SD=14.5, range: 18–77) and 54.2% of respondents were female.
Quotas were set, so that respondents were approximately evenly split between non-gamblers, and each of the four PGSI groups, facilitating statistical comparisons between all groups.
Procedure and measures
Egocentric SNA considers four main families of variables:
measures about the ego, measures about the alters, ego–alter relationships, and alter–alter relationships. The latter are particularly important for deriving social network structure variables, as described below.
Ego measures. The respondents (henceforth egos) pro- vided information about their own demographics (age, gender, main language spoken at home, country of birth, highest level of education, number of dependent children living with them, work status, income, and disposable income). They were also asked about their gambling behav- ior (frequency over the last 12 months on each of nine forms of gambling, expenditure on each form) and problem gambling severity (the PGSI; Ferris & Wynne, 2001). We used the original PGSI cutoff scores (0=non-problem gambler, 1–2=low-risk gambler, 3–7=moderate-risk gambler, 8+ =problem gambler), and Cronbach’sαin this sample was .94.
Alter measures.Egos were then asked about the 20 adults who they considered had been the most influential in their lives over the past 12 months (henceforthalters). Previous social network analyses have used between 3 (Wang &
Muessig, 2017) and 30 (Meisel et al., 2013) alters, and we found 20 alters to be an acceptable compromise in terms of information detail and survey length. Egos gave the name
(or nickname) of each of the 20 alters, which was required for subsequent questions. They then reported their percep- tions of the gambling behavior of each alter (frequency of engagement in gambling forms other than lottery games, instant scratch tickets and bingo in the past 12 months;
which form they engaged in most) and level of harm due to gambling each alter had experienced over the past 12 months (no, minor, moderate, or severe harm).
Ego–alter relationship measures.The ego indicated the nature of their relationship with each alter (e.g., mother, father, brother, sister, other family member, friend, col- league, etc; recoded into family, friends, and colleagues), and how close the ego was to each alter (not particularly close, somewhat close, very close, and extremely close).
The closeness measures were used to calculate a mean“tie to alter”strength. For alters who gambled, egos were asked to report how often the ego and each alter gambled together.
Alter–alter relationships. The ego then reported how close each pair of alters were (e.g.,“How close is John to Peter?”) using the names provided for each alter, and using the same closeness scale as for ego–alter relationships.
Initial analyses treated these closeness variables as a scale, as well as a dichotomy, where a relationship (“tie”) was considered to be present if it was rated as somewhat, very, or extremely close. Results were generally in alignment, so we have opted to report the latter recoding here.
Social network measures and statistical analysis
Ego measures (demographics, gambling behavior, and risk) were compared using standard statistical analyses across PGSI groups. These comprised analysis of variance (ANOVA) with Tukey’s pairwise comparisons, or non- parametric (Welch tests) where appropriate, for continuous measures; Kruskal–Wallis and Bonferroni-corrected Mann– Whitney Utests for ordinal measures and chi-square with pairwise tests of independence for categorical variables.
Alter characteristics were calculated based on similarity to the ego. The absolute difference in age between the ego and each of their alters was calculated, and then averaged for a single mean absolute difference score per ego. Gender similarity, gambler status, and gambling-related harm status were calculated using Krackhardt and Stern’s (1988) EI index in E-Net v0.41 (Lexington, Kentucky; Borgatti, 2006), with negative scores indicating that more alters are of the same group as the ego (i.e., same gender, gambler status, or gambling-related harm status), and positive scores indicating more alters are in the opposite group to the ego.
Alter–alter similarity is henceforth referred to as heteroge- neity, calculated using Blau’s H, also in E-Net, with scores closer to 0 indicating that the alters in an ego’s network are mostly similar to each other on the relevant measure (ho- mogeneity), whereas scores closer to 1 indicate that the alters are mostly different to each other (heterogeneity).
Finally, data from the alter–alter relationship measures were used to calculate the structural characteristics of each ego’s egocentric social network.Density refers to the pro- portion of possible alter–alter ties that actually exist. In the present data set, there were 190 possible alter–alter ties per ego, so, for example, in an ego’s network where 38 of the alter–alter relationships existed (i.e., a tie was considered to
be present), density would be 38/190=0.20.Constraintis another measure of how interconnected an ego’s alters are.
Here, if an ego is connected to alters who are highly connected to each other, then an ego is said to be con- strained, with higher scores indicating higher constraint.
Hierarchyis a measure of the nature of this constraint. If an ego is closely connected to a small number of alters who essentially act as the ego’s gateway to a larger social network, then hierarchy is higher. Once again, these mea- sures are calculated as a score for individual egos, and can be compared using standard statistical analysis (ANOVA or equivalent non-parametric tests).
Analyses were conducted using a combination of SPSS v25.0 (Armonk, NY;IBM Corp., 2017) for descriptive and inferential statistics, E-Net v0.41 (Borgatti, 2006) for cal- culating network structural variables, and R v3.4.0 (Vienna, Austria;R Core Team, 2017), with the following packages in particular: igraph, network, sna, ndtv, visNetwork, all for creating network diagrams.
Ethics
All procedures performed in studies involving human parti- cipants were in accordance with the ethical standards of the institutional and/or national research committee and with the 1964 Helsinki Declaration and its later amendments or comparable ethical standards. All participants gave informed consent and were informed they could withdraw at any time.
Data were anonymized before analysis. The study was approved by CQUniversity Australia Human Research Ethics Committee, clearance number H17/05-080.
RESULTS
Ego characteristics
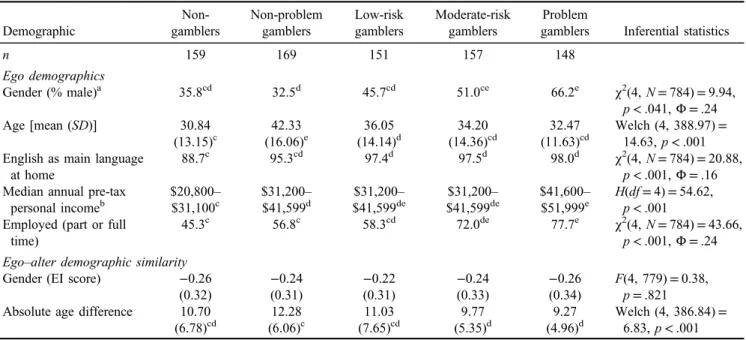
As indicated in Table 1, respondents in the problem gambler group were significantly more likely to be male compared to all other PGSI groups apart from moderate- risk gamblers. Non-problem gamblers were significantly more likely to be female compared to moderate risk and problem gamblers. Those in the non-gambler and the low risk, moderate risk or problem gambler groups were sig- nificantly younger compared to non-problem gamblers, and low-risk gamblers were significantly older than non- gamblers. Gamblers in the three highest risk groups were significantly more likely to speak English as their main language at home compared to non-gamblers, and all gamblers had a significantly higher income compared to non-gamblers, with problem gamblers having a higher income than non-problem gamblers. Those in the moderate risk or problem gambler groups were significantly more likely to be employed, particularly compared to non- gamblers and non-problem gamblers.
Ego–alter similarity
No significant differences were observed between the groups in terms of the proportion of alters who were the same gender as the ego. However, the alters of egos in higher risk groups (moderate risk and problem gamblers) were significantly closer in age to the ego compared to non- problem gamblers.
Table 1.Ego demographic characteristics, and ego–alter similarity in terms of demographics, by ego group
Demographic
Non- gamblers
Non-problem gamblers
Low-risk gamblers
Moderate-risk gamblers
Problem
gamblers Inferential statistics
n 159 169 151 157 148
Ego demographics
Gender (% male)a 35.8cd 32.5d 45.7cd 51.0ce 66.2e χ2(4,N=784)=9.94,
p<.041,Φ=.24
Age [mean (SD)] 30.84
(13.15)c
42.33 (16.06)e
36.05 (14.14)d
34.20 (14.36)cd
32.47 (11.63)cd
Welch (4, 388.97)= 14.63,p<.001 English as main language
at home
88.7c 95.3cd 97.4d 97.5d 98.0d χ2(4,N=784)=20.88,
p<.001,Φ=.16 Median annual pre-tax
personal incomeb
$20,800–
$31,100c
$31,200–
$41,599d
$31,200–
$41,599de
$31,200–
$41,599de
$41,600–
$51,999e
H(df=4)=54.62, p<.001 Employed (part or full
time)
45.3c 56.8c 58.3cd 72.0de 77.7e χ2(4,N=784)=43.66,
p<.001,Φ=.24 Ego–alter demographic similarity
Gender (EI score) −0.26
(0.32)
−0.24 (0.31)
−0.22 (0.31)
−0.24 (0.33)
−0.26 (0.34)
F(4, 779)=0.38, p=.821 Absolute age difference 10.70
(6.78)cd
12.28 (6.06)c
11.03 (7.65)cd
9.77 (5.35)d
9.27 (4.96)d
Welch (4, 386.84)= 6.83,p<.001 Note.Pairwise comparisons are indicated by superscript letters (c, d, and e), indicating significant differences. In cases where a group has multiple superscripts, the group is not significantly different to any other group with either of those superscripts. For example, for gender, non-gamblers have a superscript of cd, and thus do not differ significantly from any other group with either c or d in their superscript (i.e., they only differ significantly from the problem gambler). No superscripts are shown when no significant differences were observed.
aEgos were given the option of“Other (please specify)”for gender, but none selected the option.bEgos were given the options“don’t know” and“prefer not to say.”Egos that selected those options were removed from analysis (n=77).
Table2.Mean(SD)numberofalterswhogamble,andwhoexperiencegambling-relatedharm,byegogroup AltertypeNon-gamblersNon-problem gamblersLow-risk gamblersModerate-risk gamblersProblem gamblersInferentialstatistics Alterswhogamble3.72(5.26)a 7.30(7.17)b 9.38(6.73)c 9.85(6.91)c 13.01(7.30)d Welch(4,386.02)=48.26,p<.001 As%ofalters18.60%36.50%46.90%49.25%65.05% Heterogeneity0.17(0.18)a 0.21(0.19)ab 0.27(0.19)c 0.26(0.19)bc 0.19(0.19)a F(4,779)=9.79,p<.001 Homophily−0.63(0.53)a −0.27(0.72)b 0.06(0.67)c 0.02(0.69)c −0.30(0.73)d Welch(4,386.02)=54.23,p<.001 Alterswhoarefamilyandwhogamble1.29(2.70)a 2.75(3.29)b 3.20(3.03)bc 3.26(3.38)bc 4.15(4.03)c Welch(4,385.78)=17.67,p<.001 As%ofalterswhoarefamily17.74%35.08%45.46%45.41%59.00% Alterswhoarefriendsandwhogamble1.99(3.64)a 3.55(4.55)b 4.66(4.39)bc 5.04(4.70)c 6.75(5.48)d Welch(4,385.46)=24.43,p<.001 As%ofalterswhoarefriends18.51%37.80%46.38%49.92%67.50% Alterswhoarecolleaguesandwhogamble0.43(1.15)a 1.01(2.15)ab 1.52(2.40)bc 1.55(2.40)bc 2.11(3.49)c Welch(4,368.76)=16.47,p<.001 As%ofalterswhoarecolleagues21.71%36.47%52.16%56.86%71.13% Alterswhogambleandwhoexperiencedharm1.34(3.59)ab 0.65(1.89)a 2.54(4.62)b 4.08(5.27)c 7.74(6.54)d Welch(4,356.42)=53.47,p<.001 As%ofalterswhogamble36.02%8.90%27.08%41.42%59.49% Heterogeneity0.06(0.13)a 0.04(0.10)a 0.12(0.15)b 0.19(0.18)c 0.26(0.19)d Welch(4,377.26)=52.94,p<.001 Homophily−0.87(0.36)a −0.61(0.74)b 0.20(0.86)cd 0.40(0.68)c 0.17(0.67)d Welch(4,373.17)=168.94,p<.001 Alterswhoarefamily,whogamble,and experienceharm0.59(2.22)ab 0.24(0.74)a 0.69(1.36)ab 1.22(2.01)b 2.58(3.37)c Welch(4,353.87)=24.93,p<.001 As%ofalterswhoarefamilyandwho gamble45.74%8.73%21.56%37.42%62.17% Alterswhoarefriends,whogamble,and experienceharm0.57(1.74)ab 0.24(0.88)a 1.41(2.91)bc 2.17(3.54)c 4.05(4.36)d Welch(4,345.31)=40.29,p<.001 As%ofalterswhoarefriendsandwho gamble28.64%6.76%30.26%43.06%60.00% Alterswhoarecolleagues,whogamble,and experienceharm0.18(0.77)a 0.16(0.73)a 0.44(1.30)ab 0.69(1.55)bc 1.11(2.26)c Welch(4,370.00)=10.06,p<.001 As%ofalterswhoarecolleaguesandwho gamble41.86%15.84%28.95%44.52%52.61% Numberofalterswhogamble,withwhomego gamblesNA2.83(5.51)a 4.70(6.23)ab 5.62(6.56)b 10.43(7.98)c Welch(3,337.69)=31.91,p<.001 As%ofalterswhogambleNA38.77%50.11%57.06%80.17% Numberofalterswhogamble,withwhomego gambles,andwhohaveexperiencedharmNA0.30(1.51)a 1.73(4.07)b 2.55(4.60)b 6.51(6.72)c Welch(3,285.98)=51.94,p<.001 As%ofalterswhogamble,andwithwhom egogamblesNA10.6036.8145.3762.42 Note.Pairwisecomparisonsareindicatedbysuperscripts,withdifferentlettersindicatingsignificantdifferences.Incaseswhereagrouphasmultiplesuperscripts,thegroupisnotsignificantly differenttoanyothergroupwitheitherofthosesuperscripts.
Alter gambling behavior and gambling-related harm The proportion of alters who gamble varied by the ego’s risk group. For non-gamblers, 3.72 of their 20 alters (on average) were gamblers, and this number increased through the PGSI risk groups. For egos classified as problem gamblers, 13.01 of their 20 alters on average were gamblers (Table2). Alters who gamble were not more likely to come from any particular relationship group to the ego (family, friends, and colleagues) for any of the ego risk groups.
Not only did egos in higher risk groups associate with more alters who gamble, they also reported that most of their alters who gamble experience gambling-related harm.
For egos classified as problem gamblers, approximately 60% of their alters who gamble were reported as experienc- ing gambling-related harm. Surprisingly, however, non- gamblers reported that a higher proportion of their alters experience gambling-related harm compared to non- problem gamblers (36.0% vs. 8.9%). No significant differ- ences were found between relationship groups in terms of harmed alters within risk group, most likely due to inflated variance and reduced sample size (not all egos had alters in all three relationship groups).
Furthermore, gamblers in higher risk groups were sig- nificantly more likely to gamble with a higher proportion of their alters who gamble – up to 80% of them for egos classified as problem gamblers. Those in higher risk groups were also significantly more likely to gamble with alters who experience gambling-related harm.
Ego–alter relationship strength and structural network measures
Egos in low risk and problem gambler groups reported a stronger mean ego–alter relationship strength compared to non-problem gamblers. Similar relationships were observed for alters when considered by relationship type (family, friends, and colleagues), and also based on whether the alter was a gambler or non-gambler (Table3).
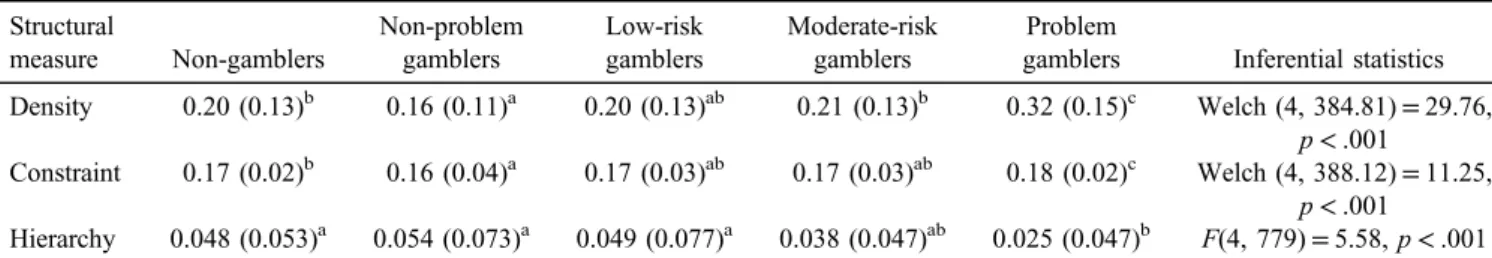
Finally, the network structural measures indicated that the networks of those in higher risk groups, particularly problem gamblers, were significantly more dense (i.e., more alters were connected to each other) compared to non-problem gamblers. Problem gamblers were significantly more con- strained than non-problem gamblers, and hierarchy was significantly lower for problem gamblers compared to all other groups apart from moderate risk gamblers (Table4).
Social network diagrams for egos classified as non-problem and problem gamblers
Example social network diagrams are shown for particular egos who were classified as a non-problem gambler (Figure 1) and a problem gambler (Figure 2). These egos were chosen to be representative of the sample based on the basis of the number of alters who gamble in their network, and the network density. For clarity, the ego is not repre- sented in this diagram as they would be another circle connected to all of the alters.
In Figure1, distinct social groups are evident, with little interconnection between them. Most alters do not have a relationship with most of the other alters, and thus network density is low. In contrast, Figure 2 represents a highly connected (dense) network for an ego classified as a prob- lem gambler. Their alters who gamble generally have relationships with each other, and appear to come from all relationship groups (i.e., the ego’s family, friends, and colleagues).
DISCUSSION
The results of this study paint a picture of those in higher risk groups, particularly problem gamblers, being sur- rounded by other gamblers. From the present cross- sectional study, it is difficult to determine whether these social influences drive gambling behavior (social influ- ence), or whether the gambling behavior influences whom the ego associates with (social selection). Determining this distinction is likely to require longitudinal methodol- ogies. No matter how this state arises, research has con- sistently found that social/peer norms influence gambling behavior (Dahl et al., 2018; Larimer & Neighbors, 2003;
Martin et al., 2010; Moore & Ohtsuka, 1999; Neighbors et al., 2007), leading to the conclusion that being surrounded by gamblers normalizes gambling behavior.
Because 39% of Australian adults gamble at least monthly (Armstrong & Carroll, 2017), gambling has become a normal activity. Despite this, there are high levels of community concern about normalization of a behavior like gambling (e.g.,AdStandards, 2018), especially among children, adolescents, and young adults (Thomas et al., 2018). This study has sought to understand how social networks may contribute to and help to maintain this normalization.
Table 3.Mean (SD) ego–alter relationship strength by alter subgroups and by ego group
Alter group Non-gamblers
Non-problem gamblers
Low-risk gamblers
Moderate-risk gamblers
Problem
gamblers Inferential statistics All alters 1.65 (0.63)ab 1.52 (0.66)a 1.74 (0.60)b 1.71 (0.57)ab 1.75 (0.54)b Welch (4, 389.02)=3.52,p=.008 Family 2.09 (0.75)ab 1.99 (0.73)a 2.25 (0.67)b 2.18 (0.61)ab 2.15 (0.64)ab F(4, 741)=3.17,p=.013 Friends 1.58 (0.67)ab 1.43 (0.72)a 1.62 (0.69)ab 1.58 (0.62)ab 1.68 (0.64)b F(4, 770)=3.04,p=.017 Colleagues 1.13 (0.85)a 0.95 (0.75)a 1.11 (0.78)a 1.23 (0.76)ab 1.46 (0.72)b F(4, 440)=5.40,p<.001 Non-gamblers 1.70 (0.60)ab 1.55 (0.69)a 1.77 (0.73)ab 1.72 (0.71)ab 1.79 (0.61)b F(4, 669)=2.73,p=.028 Gamblers 1.48 (0.85)a 1.64 (0.84)ab 1.82 (0.70)b 1.72 (0.66)ab 1.80 (0.62)b Welch (4, 301.98)=3.29,p=.012 Note.Pairwise comparisons are indicated by superscripts, with different letters indicating significant differences. In cases where a group has multiple superscripts, the group is not significantly different to any other group with either of those superscripts.
Not only are egos in higher risk groups surrounded by more gamblers, but also by more gamblers who experience gambling-related harm. If we accept the proposition that being surrounded by more gamblers normalizes gambling, then being surrounded by more gamblers who have experi- enced harm must normalize gambling-related harm. This influence is likely to be compounded for those in higher risk groups, because they gamble with a higher proportion of their alters who gamble, including those who experience gambling-related harm, and thus observing their behavior first hand may further normalize gambling (Cullum, O’Grady, Armeli, & Tennen, 2012) and gambling-related harm. Thus, reducing the social influence of alters who
experience gambling-related harm represents an important intervention for egos in higher risk groups. One alternate interpretation is that those in higher risk groups may have reported that most of their alters experienced gambling- related harm in order to feel better about their own harm.
Future research could potentially include directly surveying alters to compare their harm level to that reported by the ego.
In addition, the finding that non-gamblers report that a higher proportion of their alters who gamble experience harm (compared to the proportion reported by non-problem gamblers) is interesting, and may indicate that people who do not gamble have a lower threshold for what they consider constitutes gambling-related harm.
Table 4.Mean (SD) network structural measures by ego’s group Structural
measure Non-gamblers
Non-problem gamblers
Low-risk gamblers
Moderate-risk gamblers
Problem
gamblers Inferential statistics Density 0.20 (0.13)b 0.16 (0.11)a 0.20 (0.13)ab 0.21 (0.13)b 0.32 (0.15)c Welch (4, 384.81)=29.76,
p<.001
Constraint 0.17 (0.02)b 0.16 (0.04)a 0.17 (0.03)ab 0.17 (0.03)ab 0.18 (0.02)c Welch (4, 388.12)=11.25, p<.001
Hierarchy 0.048 (0.053)a 0.054 (0.073)a 0.049 (0.077)a 0.038 (0.047)ab 0.025 (0.047)b F(4, 779)=5.58,p<.001 Note.Pairwise comparisons are indicated by superscripts, with different letters indicating significant differences. In cases where a group has multiple superscripts, the group is not significantly different to any other group with either of those superscripts.
Figure 1.The egocentric social network for an ego who is classified as a non-problem gambler.Note.Large circles are alters who gamble, and small circles are alters who do not gamble
However, as indicated by the network density of egos in higher risk groups, reducing these influences by associating less, or not at all, with these alters may be difficult, because the social networks are so highly interconnected. We note this network density as a novelfinding in gambling social network studies, as Meisel et al. (2013) did not find a difference in density, although this may be due to a lack of power due to their sample size. The finding of network density is, however, in agreement with the literature for other health behaviors, such as smoking (Christakis &
Fowler, 2008; Cutler & Glaeser, 2007; Ennett et al., 2008; Etcheverry & Agnew, 2008), alcohol consumption (Abar & Maggs, 2010;Ali & Dwyer, 2010;Knecht, Burk, Weesie, & Steglich, 2011;Meisel et al., 2015;Mundt, 2011;
Rosenquist et al., 2010; Stock et al., 2014), substance use (Ennett et al., 2006; Pearson et al., 2006), and dietary patterns (Christakis & Fowler, 2007; Pachucki, Jacques,
& Christakis, 2011). Importantly, because gambling and gambling-related harm are pervasive through their social networks, there is an interactive or amplifying effect (Epstein, Griffin, & Botvin, 2008; Mrug & McCay, 2013). Furthermore, the networks are not hierarchical (i.e., there is not a key connection that forms a critical path connecting the ego to their network), highlighting the challenges of reducing or eliminating these social
influences for anyone in the network wishing to change their behavior.
A path for future research is to determine appropriate, and achievable, methods to reduce these harmful social influ- ences. Because of this network density, approaches that facilitate an ego’s ability to be aware of and appropriately respond to these influences, rather than trying to eliminate them, may be more successful. However, the strength of these social bonds also forms an opportunity for behavior change and normalizing harm-minimization strategies and approaches that have been successful in other behaviors, such as smoking (Christakis & Fowler, 2008), exercise (Sandon, 2016), and bullying (Wölfer & Scheithauer, 2014). Lessons can be learned from successful approaches in smoking reduction, which include increased taxes, reduction of loca- tions where smoking is permitted, and increased education about harmful effects (Cohen, Scribner, & Farley, 2000;
Levy, Hyland, Higbee, Remer, & Compton, 2007). Peer influence can also be used to shape behavior, such as through normative feedback, which is designed to correct misperceptions by providing information about a person’s behavior compared to others of similar ages (Moreira, Oskrochi, & Foxcroft, 2012). This feedback can be an effec- tive tool for reduction of gambling behavior (Auer & Griffiths, 2015;Celio & Lisman, 2014;Neighbors et al., 2015).
Figure 2.The egocentric social network for an ego who is classified as a problem gambler.Note.Large circles are alters who gamble, and small circles are alters who do not gamble. Squares indicate alters who gamble and who have experienced gambling-related harm
Limitations and strengths
Because the study was cross-sectional, it was not possible to determine the relative roles of social selection versus social influence. A longitudinal study, which allows for observa- tions of change within the networks, is necessary to help determine their relative roles. A longitudinal study would also allow for the examination of change in gambling patterns over time, as these are not stable (Delfabbro, King, &
Griffiths, 2014), and help determine how changes in behavior relate to changes in social networks. Another limitation is that egocentric SNA, by design, does not require information from the alters, and thus the information about these alters comes solely from the ego. However, previous studies (e.g.,Larimer
& Neighbors, 2003) have found that the respondents’beliefs about social norms are important predictors, which may somewhat mitigate this limitation. Furthermore, the measure of harm for each alter was short, because asking egos tofill in a validated harms screen for each of their 20 alters was not possible within the confines of the survey. In addition, because respondents were recruited using quotas based on non-gambler status or PGSI group status, the overall sample is not representative of the Victorian population. However, the purpose of the study was to compare networks across these groups, and thus the sample was not designed to be representative of the Victorian population as a whole. Finally, these social networks are, by definition, networks of indivi- duals. Broader sociocentric SNA may be able to identify clusters of gamblers within a population, although socio- centric SNA has its own limitations (e.g., refusal and lack of anonymity) and may be impractical for behaviors such as gambling where public data about individuals, and their connections to each other, are not readily available.
The overall strengths of the study are that this is thefirst large-scale study to examine social networks in gambling by risk group. It is thefirst (to our knowledge) study to suggest that gambling harm may be normalized, and the first to identify challenges in altering social networks of gamblers in higher risk groups due to their degree of interconnectedness.
CONCLUSIONS
Many forms of gambling represent an important social relationship between people. Influences from people within a person’s social network can shape their gambling behavior through normalization, and for those in higher risk net- works, also normalize gambling-related harm. The density of these networks, particularly for those in higher risk groups, presents challenges for those wishing to change their gambling behavior and for the reduction of gambling harm more broadly in the population. Instead, changing norms within society, which can in turn be transmitted through these networks, is likely to be more effective than changing the networks of individuals.
Funding sources: This study was funded by the Victorian Responsible Gambling Foundation as an Early Career Re- searcher grant in Round 8 of their Grants for Gambling
Research Program. The authors would like to thank them for their support of this project, particularly Sean O’Rourke.
Authors’ contribution:AMTR, EL, and NH designed the study, the survey, and conducted data collection. AMTR led the overall project, wrote thefirst draft of all sections of the manuscript, and conducted the statistical analyses. All authors read and commented on the manuscript and ap- proved it for submission.
Conflict of interest: AMTR has received funding from Victorian Responsible Gambling Foundation, Queensland Justice and Attorney-General, Gambling Research Australia, National Association for Gambling Studies, Australian Communications and Media Authority, and the Alberta Gambling Research Institute. He has received industry funding for an evaluation of problem gambling among casino employees from Echo/Star Entertainment Group. He had travel expenses paid to present research by the Victorian Responsible Gambling Foundation. He is also affiliated to the University of Sydney. He declares no conflict of interest in relation to this manuscript. EL has received research funds from the Victorian Responsible Gambling Foundation, the Department of Families, Housing, Commu- nity Services and Indigenous Affairs (FaHCSIA), Gambling Research Australia, Department of Human Services, Edu- cation Queensland, Australia’s National Research Organi- sation for Women’s Safety, Lowitja Institute, and the New Zealand Ministry of Health. She has received an honorarium from Gambling Research Exchange Ontario, and had travel expenses paid to present her research by Gamble Aware, Gambling Research Exchange Ontario, Victorian Responsible Gambling Foundation, and the Gambling Impact Society. She declares that she has no conflicts of interest in relation to this manuscript. NH has received research funds from the Victorian Responsible Gambling Foundation, Gambling Research Australia, Australian Government Department of Social Services, Alberta Gambling Research Institute, the Australian Gam- bling Research Centre, the Queensland, New South Wales, Victorian and South Australian Governments, the Australian Research Council, and Australia’s National Research Orga- nization for Women’s Safety. She has also received consul- tancy funds from Echo Entertainment and Sportsbet and an honorarium from Singapore Pools for membership of its International Advisory Committee. She declares that she has no conflicts of interest in relation to this manuscript.
Acknowledgements: The authors would like to thank Mr. Vijay Rawat for his research assistance during this project. They would also like to thank the respondents for taking part in this research.
REFERENCES
Abar, C. C., & Maggs, J. L. (2010). Social influence and selection processes as predictors of normative perceptions and alcohol use across the transition to college.Journal of College Student Development, 51(5), 496–508. doi:10.1353/csd.2010.0005
Abbott, M., Binde, P., Clark, L., Hodgins, D., Korn, D., Pereira, A., Quilty, L., Thomas, A., Volberg, R., Walker, D., &
Williams, R. (2015).Conceptual framework of harmful gam- bling: An international collaboration revised September 2015.
Guelph, Canada: Gambling Research Exchange Ontario (GREO). Retrieved from https://prism.ucalgary.ca/handle/
1880/51023
AdStandards. (2018, April 26).Most complained about ads from 1998–2018. Retrieved from https://adstandards.com.au/blog/
most-complained-about-ads-1998-2018
Ajzen, I. (1991). The theory of planned behavior.Organizational Behavior and Human Decision Processes, 50(2), 179–211.
doi:10.1016/0749-5978(91)90020-T
Ali, M. M., & Dwyer, D. S. (2010). Social network effects in alcohol consumption among adolescents.Addictive Behaviors, 35(4), 337–342. doi:10.1016/j.addbeh.2009.12.002
Armstrong, A., & Carroll, M. (2017).Gambling activity in Aus- tralia: Findings from wave 15 of the Household, Income and Labour Dynamics in Australia (HILDA) survey. Melbourne, Australia: Australian Gambling Research Centre.
Auer, M. M., & Griffiths, M. D. (2015). The use of personalized behavioral feedback for online gamblers: An empirical study.
Frontiers in Psychology, 6, 1406. doi:10.3389/fpsyg.2015.
01406
Bandura, A. (1977).Social learning theory. Oxford, UK: Prentice- Hall.
Bandura, A., & Walters, R. H. (1963). Social learning and personality development. New York, NY: Holt.
Blaszczynski, A., & Nower, L. (2002). A pathways model of problem and pathological gambling. Addiction, 97(5), 487– 499. doi:10.1046/j.1360-0443.2002.00015.x
Blaszczynski, A., Russell, A., Gainsbury, S., & Hing, N. (2016).
Mental health and online, land-based and mixed gamblers.
Journal of Gambling Studies, 32(1), 261–275. doi:10.1007/
s10899-015-9528-z
Borgatti, S. P. (2006).E-network software for ego-network analy- sis. Lexington, KY: Analytic Technologies.
Browne, M., Langham, E., Rawat, V., Greer, N., Li, E., Rose, J., Rockloff, M. J., Donaldson, P., Thorne, H., Goodwin, B., Bryden, G., & Best, T. (2016). Assessing gambling-related harm in Victoria: A public health perspective. Melbourne, Australia: Victorian Responsible Gambling Foundation.
Canale, N., Vieno, A., Ter Bogt, T., Pastore, M., Siciliano, V., &
Molinaro, S. (2016). Adolescent gambling-oriented attitudes mediate the relationship between perceived parental knowl- edge and adolescent gambling: Implications for prevention.
Prevention Science, 17(8), 970–980. doi:10.1007/s11121-016- 0683-y
Celio, M. A., & Lisman, S. A. (2014). Examining the efficacy of a personalized normative feedback intervention to reduce college student gambling.Journal of American College Health, 62(3), 154–164. doi:10.1080/07448481.2013.865626
Christakis, N. A., & Fowler, J. H. (2007). The spread of obesity in a large social network over 32 years.The New England Journal of Medicine, 357(4), 370–379. doi:10.1056/NEJMsa066082 Christakis, N. A., & Fowler, J. H. (2008). The collective dynamics
of smoking in a large social network. The New England Journal of Medicine, 358(21), 2249–2258. doi:10.1056/
NEJMsa0706154
Cohen, D. A., Scribner, R. A., & Farley, T. A. (2000). A structural model of health behavior: A pragmatic approach to explain and
influence health behaviors at the population level.Preventive Medicine, 30(2), 146–154. doi:10.1006/pmed.1999.0609 Cullum, J., O’Grady, M., Armeli, S., & Tennen, H. (2012). Change
and stability in active and passive social influence dynamics during natural drinking events: A longitudinal measurement- burst study.Journal of Social and Clinical Psychology, 31(1), 51–80. doi:10.1521/jscp.2012.31.1.51
Cummings, W. T., & Corney, W. (1987). A conceptual model of gambling behavior: Fishbein’s theory of reasoned action.
Journal of Gambling Behavior, 3(3), 190–201. doi:10.1007/
BF01367440
Cutler, D. M., & Glaeser, E. L. (2007).Social interactions and smoking. Cambridge, MA: National Bureau of Economic Research.
Dahl, E., Tagler, M. J., & Hohman, Z. P. (2018). Gambling and the reasoned action model: Predicting Past behavior, intentions, and future behavior. Journal of Gambling Studies, 34(1), 101–118. doi:10.1007/s10899-017-9702-6
Delfabbro, P., King, D., & Griffiths, M. (2014). From adolescent to adult gambling: An analysis of longitudinal gambling patterns in South Australia. Journal of Gambling Studies, 30(3), 547–563. doi:10.1007/s10899-013-9384-7
Delfabbro, P., & Thrupp, L. (2003). The social determinants of youth gambling in South Australian adolescents. Journal of Adolescence, 26(3), 313–330. doi:10.1016/S0140-1971(03) 00013-7
Dickson, L., Derevensky, J. L., & Gupta, R. (2008). Youth gambling problems: Examining risk and protective factors.
International Gambling Studies, 8(1), 25–47. doi:10.1080/
14459790701870118
Dowling, N. A., Jackson, A. C., Thomas, S. A., & Frydenberg, E.
(2010). Children at risk of developing problem gambling.
Melbourne, Canada: Gambling Research Australia. Retrieved fromhttp://www.jogoremoto.pt/docs/extra/1HISat.pdf Dowling, N. A., Merkouris, S. S., Greenwood, C. J., Oldenhof, E.,
Toumbourou, J. W., & Youssef, G. J. (2017). Early risk and protective factors for problem gambling: A systematic review and meta-analysis of longitudinal studies.Clinical Psychology Review, 51,109–124. doi:10.1016/j.cpr.2016.10.008 Dowling, N. A., Shandley, K., Oldenhof, E., Youssef, G. J.,
Thomas, S. A., Frydenberg, E., & Jackson, A. C. (2016). The intergenerational transmission of problem gambling: The me- diating role of parental psychopathology.Addictive Behaviors, 59,12–17. doi:10.1016/j.addbeh.2016.03.002
Ennett, S. T., Bauman, K. E., Hussong, A., Faris, R., Foshee, V. A., Cai, L., & DuRant, R. H. (2006). The peer context of adolescent substance use: Findings from social network anal- ysis. Journal of Research on Adolescence, 16(2), 159–186.
doi:10.1111/j.1532-7795.2006.00127.x
Ennett, S. T., Faris, R., Hipp, J., Foshee, V. A., Bauman, K. E., Hussong, A., & Cai, L. (2008). Peer smoking, other peer attributes, and adolescent cigarette smoking: A social network analysis. Prevention Science, 9(2), 88–98. doi:10.1007/
s11121-008-0087-8
Epstein, J. A., Griffin, K. W., & Botvin, G. J. (2008). A social influence model of alcohol use for inner-city adolescents:
Family drinking, perceived drinking norms, and perceived social benefits of drinking.Journal of Studies on Alcohol and Drugs, 69(3), 397–405. doi:10.15288/jsad.2008.69.397 Etcheverry, P. E., & Agnew, C. R. (2008). Romantic partner and
friend influences on young adult cigarette smoking: Comparing