NATIONAL VOLUNTEER CENTRE
NON-PROFIT RESEARCH GROUP ASSOCIATION
ÉVA KUTI - KLÁRA CZIKE
CITIZENS’ DONATIONS AND VOLUNTARY ACTIVITIES Flash report on the findings of the 2004 survey
Supported by
Charles Stewart Mott Foundation; the Department of ICSSZEM Civil Relation; the
National Civil Fund; and the National Employment Foundation
Budapest, 2005
2 CONTENTS
1. INTRODUCTION, ACKNOWLEDGMENTS
2. DONATIONS AND VOLUNTARY ACTIVITIES IN 2004 2.1. Financial donations
2.2. Donations in kind
2.3. Voluntary activities and blood donations
3. SOCIO-DEMOGRAPHIC CHARACETRISTICS OF DONORS AND VOLUNTEERS
3.1. Demographic characteristics 3.2. Qualifications and social status 3.3. Social links
4. MOTIVES
5. CHANGES AND TENDENCIES, 1993-2004 6. THE SURVEY’S MOST IMPORTANT FINDINGS 7. QUESTIONNAIRE
8. TABLES AND DIAGRAMS
1. INTRODUCTION AND ACKNOWLEDGMENTS
Our survey is the result of the co-operation between the National Volunteer Centre and the Non-profit Research Group. The survey’s primary goal was to map, explore and analyse the changes, new facts and tendencies that have taken place since the survey of 1993, entitled ‘Citizens’
donations and voluntary work’.
First and foremost, we are grateful to the sponsors of this survey, who recognised the importance of these issues and made it possible to carry out the programme. We owe special thanks to Tamás Scsaurszki, who at once recognised the strong link between understanding the nature and development of donating and voluntary activities and the Charles Stewart Mott Foundation’s programme that is aimed at supporting Hungarian civil society. The professional and practical support offered by Béla Jagasics, who gained experience in recognising the significance of private support and civil activity as a professional who is responsible for the government’s civil relations, was of similar importance to us. We would also like to thank the decision-makers at the NEF (National Employment Foundation) and the Ministry of Employment for looking at the employment aspects of this survey. Beside their financial help, they clearly use the findings of the survey related to the field of their work on a daily basis.
When formulating our research strategy and the questionnaires, we benefited from the findings of the 1993 survey, for which we would like to thank Ágnes Czakó, László Harsányi and Ágnes Vajda. We would hereby also like to thank the staff of Szonda-Ipsos, who recorded the data.
We are grateful to István Sebestyén and Renáta Nagy for their invaluable help in processing the data.
The survey of 1993 collected data on the donation habits and voluntary activities of 14833, randomly selected adults (over 18). Due to the tight budget of this survey, we could only ask 5000 randomly selected Hungarian citizens (over 14) this time. The data collected was then multiplied in accordance with the number of total population over 14. The present publication contains this data and a short analysis thereof. The aim of the flash report is to provide a practical summary of citizens’ donations and volunteerism for organisations dealing with donation collection, distribution and volunteers, as well as volunteers and individuals. A volume of studies is being compiled simultaneously with the flash report, which contains deeper analyses for those who have a special interest in the phenomena we have examined, or those who have a wish to get acquainted with the field from a more scientific viewpoint.
In line with the previous surveys, we have considered anyone who gives financial donations or donations in kind (e.g. second-hand clothes, food, books, toys, etc.) to people falling outside their circle of relatives and friends (foundations; churches, or governmental institutions) as donors.
4
Voluntary activity is also defined as unpaid voluntary help given to people not included in one’s circle of relatives and friends, or to organisations.
2. DONATIONS AND VOLUNTARY ACTIVITIES IN 2004
Nearly four fifths of the population aged fourteen and over were involved in making at least one kind of donation out of the following; financial donations; donations in kind, unpaid voluntary activities and blood donations in 2004. This means that almost 7 million people did something, even if it was small, for the sake of their wider community. Most of them helped people and various non- profit, governmental and local governmental institutions, denominations and parties outside their circle of family and friends in more than one way.
Diagram no.1
Proportion of donors and volunteers among the population aged 14 and over
Gives one form of help 25%
Gives 2 forms of help 28%
Gives 3 forms of help 23%
Gives 4 forms of help
3% Does not give or help
21%
The most popular form of donations made by two thirds of the population aged 14 or over was financial. The percentage of donors of donations in kind was near 50% and the percentage of volunteers came close to 40%.
Table no.1
The number and proportion of volunteers and donors outside the circle of family and friends according to the form of help given
The donors and volunteers’
Form of support given number percentage
%
Financial 5 719 756 65.2
In kind 4 145 910 47.3
Voluntary activity 3 474 731 39.6
Blood donors 692 089 7.9
Gave help of at least one of the above-mentioned forms 6 918 059 78.9
6 2.1. Financial donations
Financial donations can take various forms, due to which they are a widely spread form of contribution. The times people meet others in need has been multiplied over the last decade. The number of requests and calls for donations by persons, institutions and organisations has increased.
We can distinguish three basic kinds of these donationsTP1PT.
¾ direct requests; collection and calls for donations not linked to one particular organisation regarding persons, affairs and disasters;
¾ donations through purchase of goods
¾ donations to organisations (foundations, associations and other non-profit organisations, governmental institutions, denominations and parties)
The oldest form of requests motivated by personal needs is begging. This everyday phenomenon, especially in bigger cities, motivated more than a quarter of people to donate in 2004.
The proportion of church-goers who traditionally dropped something in the collection box at the end of service was even bigger. Collection boxes set up at public places such as post offices and airports proved half as ’popular’, as did the donation lines operated largely by media support.
Collections using premium rate text messages have raised less interest, although this interest is now perceivable.
Table no. 2
Percentage of donors motivated by direct requests, collections and calls for donations among the population aged 14 and over; amount and distributions of donations made
Form of donation Percentage of
donorsP*P Amount and distribution of donations
% 1000 Ft %
Church collection box 30.3 7 570 516 58.1
To beggars 27.2 2 421 666 18.5
Collection boxes at public places (e.g. post office, street)
14.9 1 233 401 11.1 By calling a donation line 13.9 1 444 517 9.5
By premium rate text messages 4.6 371 038 2.8
In total: – 13 041 138 100.0
*The same donor may have made different forms of donation
From the different forms of direct collection, the two traditional ways, i.e. church collection and begging (but especially the former one) have proven to be financially and otherwise the most successful. These forms of donation made up 19%, in real terms 57 million Forints, of the 13 billion in total, whereas other techniques together made up less than 25%.
TP
1
PT The three different kinds were sharply distinguished from one another and, to avoid cumulative amounts, we have asked the interviewees not to state the same amount of donation twice.
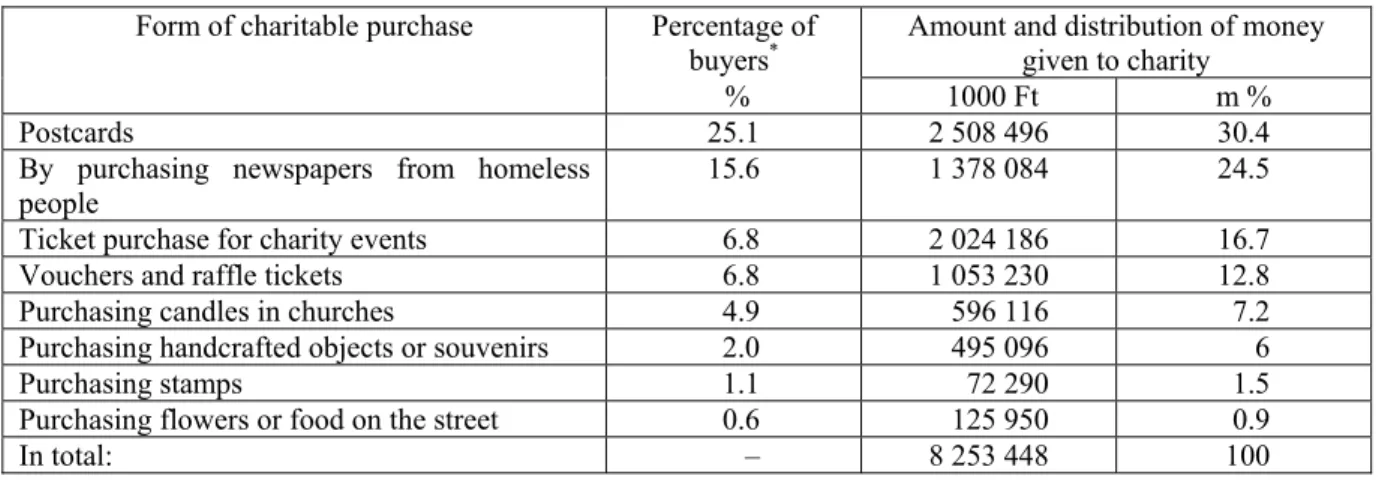
Donations given through product purchase cannot be considered as ‘pure’ charity, since the donor receives some kind of service, goods or otherwise. The amount paid by them may not even be above the market price of the product/service. Support often consists of the customer choosing a product out of a selection, e.g. a UNICEF postcard, an ornament produced or entered into auctions by the charity, a part of the selling price of which she/he knows will go to the groups in need.
Table no. 3
Percentage of people donating through product purchases among the population aged 14 and over;
the amount and distribution of money given to charity
Form of charitable purchase Percentage of
buyers* Amount and distribution of money given to charity
% 1000 Ft m %
Postcards 25.1 2 508 496 30.4
By purchasing newspapers from homeless
people 15.6 1 378 084 24.5
Ticket purchase for charity events 6.8 2 024 186 16.7 Vouchers and raffle tickets 6.8 1 053 230 12.8
Purchasing candles in churches 4.9 596 116 7.2
Purchasing handcrafted objects or souvenirs 2.0 495 096 6
Purchasing stamps 1.1 72 290 1.5
Purchasing flowers or food on the street 0.6 125 950 0.9
In total: – 8 253 448 100
*The same donor may have purchased different kinds of products.
The most frequent form of this kind of donation in 2004 was the purchase of postcards. A quarter of the interviewees said that they used this form as a way of donating. A relatively large number of people, namely 16%, bought newspapers from homeless people. Although participation in charity events such as balls, concerts and dinners, etc. and the frequency of buying raffle tickets are significantly lower (7% each), donors choosing these forms paid a much higher amount for the tickets and invitations than average. Purchases of church candles and artefacts, souvenirs and stamps made for charity purposes are even lower. We also have to note that the rate of flowers, fruit and vegetables purchased from people in need is probably so low because this option did not appear among the answers. The fact that some of the donors made a spontaneous reference to these donations shows the importance of this form of charity.
Unfortunately we could not draw such clear lines within the donations made to organisations2, non-profit organisations, denominations and political parties. The amounts given for religious and political purposes often reach their real addressees via non-profit organisations taking
2 We are not dealing with donations given to governmental and local governmental institutions such as schools, hospitals, old peoples’ homes, etc. These organisations were given 2.9 billion Ft worth of support by 4.7% of the population aged 14 and over in 2004, as we found out from the answers. We have reason to believe that a large part of this amount was linked to the services received. Such as study trips, sporting activities and language courses, etc. We also know that the local cultural events, festivals and village decorating activities are made possible by the classic
8
the form of associations that belong in the authority of the churches and parties. It is also not rare to find donations collected by the churches going to charities or educational institutions registered as secular non-profit organisations. For this reason, donations given to churches, secular non-profit organisations and political parties are all under the same heading in the table below.
Table no. 4
Percentage of financial donors to denominations, non-profit organisations and political parties among the population aged 14 and over; the amount and distribution of donations given by the
supported organisation’s field of activity
Amount and distribution of donations Field of activity Percentage of
donors*
% 1000 Ft %
Religious activity 13,0 7 319 393 38,3
Healthcare and social care 8,1 5 969 341 31,2 Education and scientific research 2,4 1 518 531 7,9 Culture, arts and traditions 2,2 1 811 552 9,5
Sports and leisure activities 1,1 784 526 4,1
Environment and animal protection 0,9 384 838 2,0 Support given to trans-border Hungarians 0,6 633 578 3,3 Regional and settlement development 0,3 124 209 0,6
Political activities 0,2 297 021 1,6
Protection of public safety, civil guards and
firemen 0,2 130 764 0,7
Protection of civil rights and minorities 0,2 87 589 0,5 Professional and economic advocacy 0,1 24 793 0,1
International relations 0,1 17 842 0,1
Economic development and creation of
workplaces 0,0 17 885 0,1
In total: – 19 121 862 100,0
*The same donor may have made different forms of donation
Most donors and the largest amount of donation were attracted by church-related and religious organisations as well as non-profit organisations working in the field of healthcare and social care. These two fields received almost two-thirds of the total donations of 19 billion Forints.
The support given to cultural, educational, sport, leisure, environmental organisations as well as organisations supporting trans-border Hungarians was also significant. The rest of the fields could only expect an insignificant percentage of citizens to make donations.
The three forms of support differed greatly in terms of range and economic significance.
Table no. 5
Percentage of donors making financial donors aged 14 and over; amount and distributions of donations made
Form of donation Percentage of donors*
Amount and distribution of donations
% 1000 Ft %
Personal requests, collection boxes and actions 54,0 13 041 138 32,3 Donations given through purchase 38,1 8 253 448 20,4
Direct support given to organisations 20,7 19 121 862 47,3
In total: – 40416448 100,0
*Nearly two-thirds of the donors made not just one, but two or three different forms of donations
People collecting and requesting money and the organisers of collections were listened to by more than half of the population aged 14 and over, but they could only collect one-third of the donated money. The average amount of donations of this kind per donor did not even reach 3000 Ft in 2004. This amount was even lower, around 2500 Ft, in the case of charitable purchases.
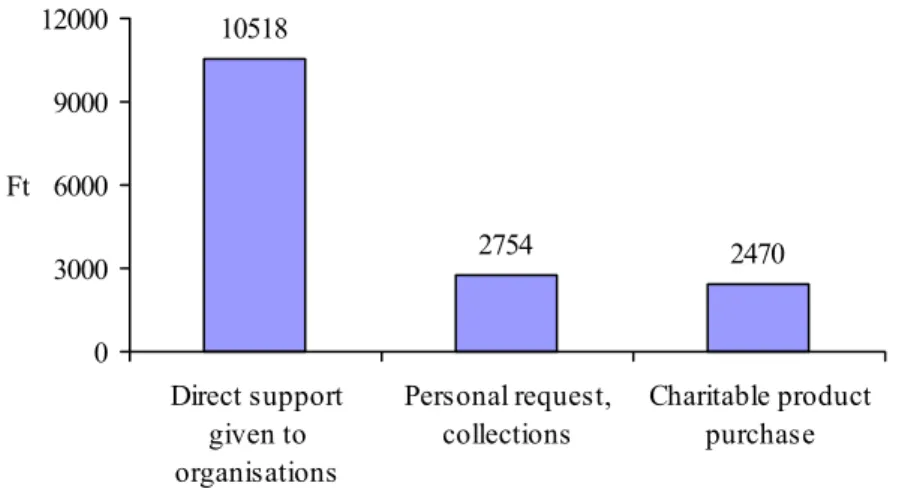
Although only a fifth of the population gave direct financial donations to non-profit organisations, parties, but the average rate of support of this kind has exceeded 10.000 Ft.
Diagram no.2
The annual amount of financial donations of different kinds per donor
10518
2754 2470
0 3000 6000 9000 12000
Direct support given to organisations
Personal request, collections
Charitable product purchase Ft
The majority of donors were made up of people donating small amounts under 5000 Fts or even 1000 at times, irregardless of the form of donation given. The proportion of this group whether they donated by purchasing or by giving money to beggars or collectors, was close to 90%, and exceeded 50% even within those supporting organisations.
Table no. 6
Distribution of donors of different forms according to the volume of the given form of support given in percentage
Amount of donation Donors responding to personal requests, collection boxes and
actions
Charitable purchasing
donors Supporters of non-profit organisations, churches
and parties
1000 Ft and less 46,2 47,9 14,3
1001– 5000 Ft 41,3 41,9 40,3
5001–10000 Ft 8,5 7,0 23,8
above 10000 Ft 4,0 3,2 21,6
In total: 100,0 100,0 100,0
Even if we take the aggregate of all forms of donations, what we find is that the financial sacrifice of more than a quarter of the donors stayed within a 1000 Ft limit, and the remaining 40% donated between 1000-5000 Ft in 2004. The strong concentration of the donated amount is linked to this finding. Two-thirds of the donations came from 17% of the donators that gave more than 10.000 Forints to beggars and people in need. The smallest donations ranging from a few hundred Forints to 5000, made up for as much as sixth of the total amount donated
Diagram no.3
Distribution of the number of financial donors and the donations they made by the size of the donation
2
26
15
40
17
17
66
17
0% 20% 40% 60% 80% 100%
Distribution of the amount donated Distribution of donors
–1000 Ft 1001–5000 Ft 5001–10000 Ft 10001 Ft–
The majority of donors identified themselves as occasional donors, but most of them donated on more than just one occasion. At the same time, regularity in the majority of cases meant donating only once or twice a year. Only a little more than 15% of the donors donate once a month or even more frequently.
10
Diagram no.4
Distribution of financial donors by the frequency of donation
Other times 46%
Donates more often on occassions
45%
Donates on one extraordinary
Weekly 5%
Monthly 11%
Twice a year 15%
Once a year 15%
*Distribution of donors that gave an assessable answer
More than half of the donors intended to help people in need by making a donation. More than a third of the donors said that their donation served the general interest of their community.
Only a fraction of the questioned donors referred to their own interest.
Table no. 7
Distribution of donors* by the beneficiaries of their donations
Who benefits from the donation? Distribution of donors % People in need not known by the donor 53,9 The general interest of the community 36,9
People in need the donor knows 4,5
The donor’s family, themselves as well as others 4,2
Only the donor and his/her family 0,5
In total: 100,0
*Distribution of donors that gave an assessable answer
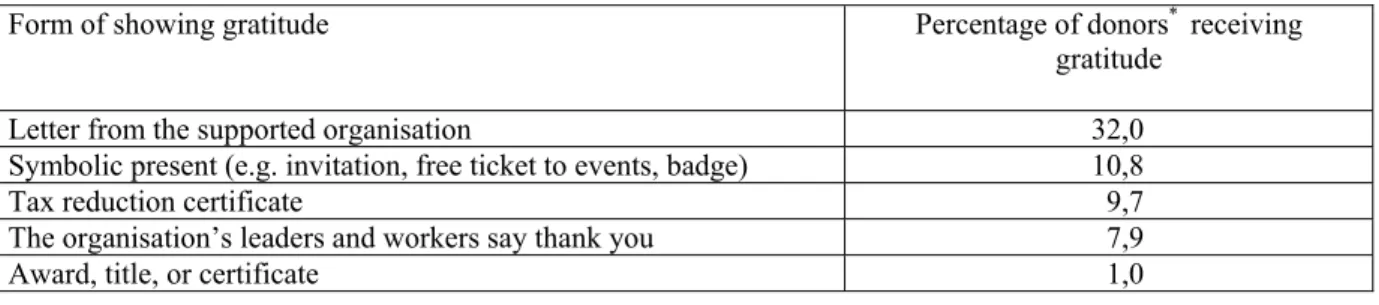
Only the smaller half, i.e. 45% of the donors received some kind or more than one form of thank-yous. Diagram no.8 contains the frequency of different forms of showing gratitude.
Table no. 8
Frequency of different forms of showing gratitude
Form of showing gratitude Percentage of donors* receiving gratitude
Letter from the supported organisation 32,0 Symbolic present (e.g. invitation, free ticket to events, badge) 10,8
Tax reduction certificate 9,7
The organisation’s leaders and workers say thank you 7,9
Award, title, or certificate 1,0
* The same donors may have received more than one form of gratitude.
Tax allowance certificates were very rare, less than 10% of the donors received any such thing and a mere half of these donors actually used their certificate. This obviously points to the fact that decisions to donate came from the intention to help and weighing up one’s own interest was extremely uncommon. This probably applied even more to donations in kind, in which case the law does not allow the use of tax reduction certificates.
2.2. Donations in kind
Nearly half, 47% of the population aged 14 and over was involved in making donations in kind. The most frequent form of donations in kind was by far items of clothing, which was reported by 42% of the interviewees. Many donors helped those in need with books, records, toys (18%) and food (12%). Donating furniture and other household objects, household appliances, computers and cars was a lot rarer, but these represent much bigger values of course. A significant part of the donors made not just one but more forms of donation.
Since we are mostly talking about objects that serve personal use, it does not come as a surprise that the majority of the donations in kind were made directly to the individuals and families, more often than not people the donors already knew, in need. Almost two-thirds of the donors only used informal networks to reach their beneficiaries. Somewhat more than a fifth of them also donated to individuals and particularly organisations, denominations and secular non- profit organisations and local governmental institutions and parties in smaller proportions. The percentage of donors donating only to organisations reached 16%. We have every reason to believe that the organisations supported fulfilled the mediator’s role even in the above-mentioned two cases and were the real beneficiaries of the donations only in special cases.
Diagram no.5
Distribution of donors of donations in kind by the kind of beneficiaries
Only supports individuals
61,4%
Supports both individuals and
organisations 23,1%
Only supports organisations
15,5%
Support given to individuals were probably motivated by social considerations, although the selection of beneficiaries could also be random due to its informal nature. We have somewhat more exact pieces of information on the composition of donations in kind that were made to non-profit organisations, religious institutions and parties.
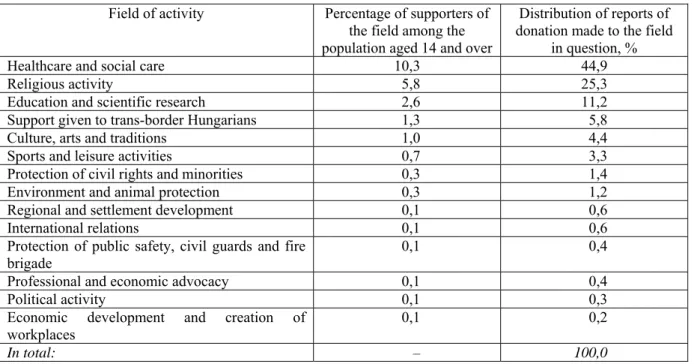
Table no. 9
Percentage of donors who made donations in kind to non-profit organisations, religions and political parties among the population aged 14 and over; distribution of reports of the donations
by the supported organisation’s field of activity
Field of activity Percentage of supporters of the field among the population aged 14 and over
Distribution of reports of donation made to the field
in question, %
Healthcare and social care 10,3 44,9
Religious activity 5,8 25,3
Education and scientific research 2,6 11,2
Support given to trans-border Hungarians 1,3 5,8
Culture, arts and traditions 1,0 4,4
Sports and leisure activities 0,7 3,3
Protection of civil rights and minorities 0,3 1,4
Environment and animal protection 0,3 1,2
Regional and settlement development 0,1 0,6
International relations 0,1 0,6
Protection of public safety, civil guards and fire
brigade 0,1 0,4
Professional and economic advocacy 0,1 0,4
Political activity 0,1 0,3
Economic development and creation of workplaces
0,1 0,2
In total: – 100,0
Whether we consider the percentage of donors among the population aged 14 and over or the distribution of reports of the donations in kind made by them, the order of priorities remains the same. The vast majority of beneficiaries is made up of organisations operating in the field of social care and healthcare. Denominations are in the second place and education is in the third. The
14
fourth and fifth places are taken up by supporting trans-border Hungarians and culture. The percentage of mentions of all the rest of the fields together does not reach 10%.
Donations in kind, just like financial donations, are also characterised by opportuneness.
Table no. 10
Distribution of donors of donations in kind by the frequency of donations
Frequency of donations Distribution of donors %
On one, extraordinary occasion 4,7
Sometimes, more often (e.g. collections or campaigns) 50,1
Once a year 12,8
Regularly, about twice a year 22,5
Regularly, about once a month 7,7
Regularly, about once a week 2,2
In total: 100,0
*Distribution of donors that gave an assessable answer
More than half of the donors said that their donations in kind were not regular but neither extraordinary, they were mostly connected to collections. Those who identified themselves as regular donors reported making donations once or twice a year. Monthly donations were rare, weekly ones were scarce.
2.3. Voluntary activities and blood donations
As we mentioned before, 40% of the population aged 14 or over were involved in voluntary activities in 2004 (see table no.11). Citizens, outside their circle of families and friends carried out voluntary activities for the sake of individuals and institutions.
Table no. 11
Fields of voluntary activities
The number and percentage of donors and volunteers Form of support
No. % Helping locally and in the settlement 2 365 878 68,1
Giving help to educational, healthcare and cultural institutions 740 122 21,3 Receive people in need to the donor’s home 325 815 9,4 Settling official affairs and consultancy 1 409 668 40,6 Giving help to religious institutions 409 651 11,8
Giving help to political parties 81 655 2,3
Giving help to other organisations, associations, clubs or circles 424 513 12,2
Collecting donations 227 412 6,5
Appearing at a charity event and organising events 287 018 8,3 Membership in boards or supervisory committees 86 658 2,5 Accounting and other administrative duties 69 683 2,0
Most of the voluntary activities were taken up by giving help locally (68%); settling official affairs (41%) and giving help to social, healthcare and cultural organisations (21%). One answerer may have selected more than one option of course.
It was more frequent that the volunteers did something occasionally, but more than once a year than doing something regularly. Regular volunteer mostly give help on a monthly basis. We could draw up a similar table based on the 1993 survey, except that the column of volunteering
’twice a year’ was higher than the column of volunteering ’on a monthly basis’ in that one.
Diagram no.6
Frequency of voluntary activities
mo
Percent
50
40
30
20
10
0
once more than once once a year twice a year monthly weekly
During the interviews, we were also curious to find out how old the volunteers started their voluntary activities. In general, the different age groups tended to join volunteers aged between 14 and 20.
The beneficiaries of the voluntary activities are mostly people the volunteers know but are not related to or friends with (26%). They also involve organisations (11%), and activities carried out for the sake of the settlement or local community (15%). The percentage of support given to individuals not known by the volunteers is only 6%.
Table no. 12
Beneficiaries of voluntary activities
The number and percentage of volunteers
Beneficiaries
No. % People known by the volunteers but not
related to or friends with them 2 294 501 26,2 Individuals not known by the volunteers 500 646 5,7
Organisations 921 318 10,5
Settlement, local community 1 324 642 15,1
The amount of time spent volunteering for organisations such as civil organisations, state nursery schools, schools and churches, was less than 10 hours a month in 2004.
Diagram no.7
Amount of monthly voluntary work done for organisations
Number of volunteers
500000
400000
300000
200000
100000
0
1-1,5 hours a month 6-10 hours a month 11-15 hours a month 16-20 hours a month over 21 hours a month
Most of the voluntary activities consisted of organisation, building and fixing.
Diagram no.8 Types of voluntary activity
0,8 0,5
1,4
0,2
1,10,9
0,2 0,20,4 1,8
1,2
0,3 0
2
Adminisztráció
Építés, javítás
Adománygyűjtés Lelki go
ndozás
Sütés, főzés
Takarítás Százalék
Volunteers mostly donated time to religious organisations (4%), although the support of organisations of sport and leisure activities was also high (3%) in comparison to the rest of activity fields.
18 Table no. 13
Number and percentage of volunteers volunteering for the different organisations
Number and percentage of people reporting voluntary activities
Field of activity
No. %
Culture 212 231 2,4
Sport, recreation 255 164 2,9
Education 187 483 2,1
Healthcare and social care 201 585 2,3
Public safety 54 963 0,6
Environment and animal protection 141 380 1,6 Settlement development, housing 91 373 1,0
Economic development 10 353 0,1
Protection of civil rights and minorities 38 020 0,4 International relations, EU 10 943 0,1 Supporting trans-border Hungarians 41 532 0,5 Professional employment advocacy 24 218 0,3
Church 387 496 4,4
In comparison to the 1993 survey, the amount of monthly working hours increased by 44%.
Similarly to the findings of that survey, most volunteers were involved in cultural, sport, health and social care activities. The distribution of time on the other hand has changed according to the data collected in 2004; the percentage of sport and leisure-related voluntary working hours has grown significantly. At the same time, religious organisations' share of donated working hours has dropped considerably.
If one compares the voluntary activities of adults and children of secondary school age, as is shown in table 9, one sees that a much bigger share of voluntary activities of children relate to environment protection and the church than that of the adult population. The percentage of culture and education-related activities is much lower in the case of children.
Table no. 14
The amount of time secondary school goers and adults spent carrying out voluntary activities for non-profit organisations and the church by the organisation’s field of activity, expressed in hours
Field of activity High school goers
Adults In total:
Culture, arts and traditions 20 807 1 413 727 1 434 534 Religious activity 68 750 2 880 673 2 949 423 Sports and leisure activities 65 831 2 390 233 2 456 064 Education and scientific research 11 473 848 592 860 065 Healthcare and social care 29795 1 417 195 1 446 990 Protection of civil rights and minorities – 203 302 203 302 Protection of public safety, civil guards and fire brigade and
crime prevention – 715 370 715 370
Environment and animal protection 47 900 954 453 1 002 353
Economic development and creation of workplaces – 34 731 34 731 Regional and settlement development – 759 121 759 121
International relations 2 312 13 939 16 251
Supporting trans-border Hungarians 2 312 346 217 348 529 Professional and economic employment advocacy – 150 676 150 676
Political activity – 291 039 291 039
In total: 249 180 12 419 268 12 668 448
Table no. 15
The amount of time secondary school goers and adults spent carrying out voluntary activities for non-profit organisations and the church by the organisation’s field of activity, expressed in
percentage
Field of activity Secondary
school goers Adults In total:
Culture, arts and traditions 8,4 11,4 11,3
Religious activity 27,6 23,2 23,3
Sports and leisure activities 26,4 19,2 19,4
Education and scientific research 4,6 6,8 6,8
Healthcare and social care 12,0 11,4 11,4
Protection of civil rights and minorities – 1,6 1,6 Protection of public safety, civil guards and fire brigade and
crime prevention – 5,8 5,6
Environment and animal protection 19,2 7,7 7,9
Economic development and creation of workplaces – 0,3 0,3
Regional and settlement development – 6,1 6,0
International relations 0,9 0,1 0,1
Supporting trans-border Hungarians 0,9 2,8 2,8
Professional and economic employment advocacy – 1,2 1,2
Political activities – 2,4 2,3
In total: 100,0 100,0 100,0
Diagram no.9
The amount of time secondary school goers and adults spent carrying out voluntary activities for non-profit organisations and the church by the organisation’s field of activity, expressed in
percentage
0% 20% 40% 60% 80% 100%
High school goers Adults
Environment protection Sports, leisure Church, religion Other fields Education and scientific research Culture
Healthcare and social care
According to the volunteers working for the organisations, their support mostly serves the general interest of the community, which is the same target group as the one chosen by the interviewees of the 1993 survey.
Table no. 16
Number of volunteers by the beneficiaries of their activity
Who did the activity serve? Number of volunteers The general interest of the community 677 473 People in need not known by the donor 71 458 People in need the donor knows 22 379 The donor’s family, their own and
others’ interest 60 464
Indefinable 18 567
Only 243 541 people, i.e. 3% answered to the question; ‘which groups of society are you most willing to donate to?’ The table’s findings correspond to the usual answer that volunteers most willingly donate to children (22%). The number of supporters of the disabled is high, as is the percentage of voluntary activity carried out for the elderly (12-12%). Support given to Romas, addicts and other minorities is considered to be small.
20
Table no. 17
Preferred groups of society in voluntary activities
Target group 1* 2 3 4 5 6 7 8 9
The unemployed 1,3 1,9 3,6 7,5 10,0 7,2 1,3 4,9 0,8
Women 1,3 3,7 6.3 10,9 8,3 5,0 2,1 0,8 0,6
Romas 0,8 0,6 0,8 1,2 2,0 3,8 6,3 8,4 13,4
Children 21,9 9,5 4,6 1,6 0,9 0,3 0,3 0,3 0,6
The disabled 7,1 12,0 8,6 5,3 3,5 1,4 0,9 0,7 0,2
Addicts 0,5 0,6 1,5 2,4 3,4 6,3 7,3 8,4 7,2
The elderly 7,1 10,6 12,4 4,7 3,0 1,0 0,7 0,5 0,1 Trans-border Hungarians 1,1 0.9 1,9 4,4 5,3 8,9 7,0 6,4 2,1 Other minorities not mentioned
above
0,8 0,4 0,3 0,7 2,0 3,7 8,3 9,4 11,8
*1-9: at which place the volunteer mentions the group as a social group to be supported
Only a very small proportion of the answerers, 8%, i.e. 692.089 people in total said ‘yes’ to whether they gave any blood in 2004. 78% of the blood donors carried out some form of voluntary activity, which made up 10% of volunteers.
Diagram no.10
Percentage of blood donors in 2004
3% 8%
Cannot give blood Gave blood
Did not give blood 89%
22
3. SOCIO-DEMOGRAPHIC CHARACETRISTICS OF DONORS AND VOLUNTEERS
According to international and previous national experience, donations and voluntary activities are strongly linked to people’s social situation, demographic characteristics and the connection networks built and maintained by them. Below is an analysis of the effects of these factors on voluntary behaviour by the form of help given. We also hold it important though to remind the readers of an earlier finding of the survey, according to which there is an overlap between the donors and the volunteers. The majority of interviewees help the ones in need, which means that the characteristics of donors and volunteers are in part the data of the same group of people. This explains the similarities to a certain extent, while it‘re-values' the differences despite the overlaps.
3.1. Demographic characteristics
One such remarkable difference is between the charitable habits of men and women. (Table no.17) Women tend to donate a lot more than men but participate in voluntary activities much less than men do. This is probably due to the greater household workload and lack of time. Also, the management of societies and foundations is normally made up of men and the traditionally female areas of health and social care make up for a small percentage of non-profit institutions.
(Traditions would suggest the opposite, since the majority of charities were mostly operated by women until the end of the 2nd World War. They also did the majority of charity work.)
There are less remarkable, but nevertheless noticeable differences in age. (Table no.11) Although the greatest percentage of people joining donors and voluntary activities was people aged 31-40, the percentage of volunteers by age differed by the following three forms of voluntary activity;
The percentage of financial donors already reaches its average in the case of 21-30 year- olds. (It is much lower prior to these ages.) Following this, it remains well above average between the ages 31-60, and then falls back to average between the ages 61-80, after which it begins to drop drastically.
Participation in making donations in kind is much less even. The figures stay above average between the ages 31 and 60. Participation of all age groups is lower than average both prior to and following these ages.
Table no. 18
Percentage of donors and volunteers by demographic characteristics
Financial In kind Volunteers
Demographic characteristics donors
percentage of population aged 14 and over Sex
Male 61,7 42,1 43,0
Female 68,3 51,9 36,7
Age
14–17 51,2 38,8 39,6
18–20 52,8 35,7 43,3
21–30 65,7 43,2 42,8
31–40 70,3 55,8 47,7
41–50 67,6 53,5 46,9
51–60 69,5 51,9 40,8
61–70 65,2 45,1 31,3
71–80 64,5 42,0 24,0
81– 50,8 30,1 13,9
Residence
Capital 71,1 54,9 40,9
County capital 67,5 48,6 38,6
Other cities 62,4 43,1 34,8
Towns 63,3 46,3 44,1
Marital status
Single 58,2 39,5 42,9
Married or co-habiting 70,8 53,2 42,5
Divorced or separated 58,4 46,1 36,5
Widow 58,8 37,0 22,0
Size of household
1–2 persons 63,0 43,0 32,7
3–5 persons 67,8 50,8 44,5
6 or more persons 54,3 43,1 41,7
Number of children living in the household
0 64,8 43,8 34,2
1 64,8 48,6 45,0
2 69,6 54,6 46,4
3 61,7 51,6 48,8
4 and above 52,9 42,3 34,4
In total 65,2 47,3 39,6
Diagram no.11
Percentage of donors and volunteers by age
0 10 20 30 40 50 60 70 80
14–17 18–20 21–30 31–40 41–50 51–60 61–70 71–80 81–
Age group
%
Financial donors Donors of in kind donations Volunteers
Experience is completely different regarding volunteers. This form of help is rare only in the case of (especially very) old people. The percentage of volunteers is around average in the case of teenagers, goes above average from 18 to 50 and falls back to it from 51 to 60, after which it starts dropping significantly. The average volunteering of youth is remarkable, especially considering that public education in its current form does not require or acknowledge any such activities (apart from a few secondary school initiatives). The percentage of volunteers among the elderly is striking and is probably also due to the lack of motivating factors, even though it means a way of relating to society outside the world of labour, which could enable pensioners in forced passivity to strengthen their connection network.
Residing in the capital comes with exceptionally high participation rates of donating. (This is probably due to the greater number of requests and calls.) On the other hand, it is the residents of towns that participate most intensively in voluntary activities. This is likely to be due to the more transparent needs of a smaller community and the more forceful power of the norms of making sacrifices. The collected data is remarkable for another reason at the same time, that is, that previous surveys have found grater numbers in the case of urban volunteering.
By far, the best donors are those living in a marriage or co-habiting. Participation in volunteer work is also well above average in this group, although singles are in the competition as well. Divorced people and widows are much more passive in every respect. Financial and life management problems of divorced people clearly provide the explanation of this. The time that could be donated by widows would make volunteering just as possible as in the case of singles, but older age, worse medical condition and the lack of appropriate opportunities all set back the donation of time considerably.
Both donating and volunteer work are most wide-spread in the case of people who live in a household of 3-5. The number of children living in the household also seems to be an important
influencing factor, which is probably because a significant part of the help requests come into the family by the mediation of children. The percentage of donors is the highest in families with two children. The number of financial donors is above average only in this category. It seems like this is where the parallel is not yet drawn between having children and being in a worse situation financially. The rate of families with 1 to 3 children that participate in making donations in kind is also above the average. Families with 3 children have the highest percentage of participation in voluntary activities, although activity of families with 1 or 2 children is also high. Participation rates fall well under average in all three forms of help in the case of families with 4 or more children.
3.2. Qualifications and social status
The differences by demographic characteristics described above are not of course independent of the interviewees’ social statuses, since, as we know, age, place of residence and family relations often go hand in hand with serious differences in education and work positions.
Table no. 19
Percentage of donors and volunteers by education and social status
Financial In kind Volunteers
Qualifications and social status donors
percentage of population aged 14 and over Qualification
Lower than primary school 44,4 30,5 24,0
Primary school 56,0 36,5 31,3
Vocational school 63,2 45,2 39,5
Secondary school 75,2 56,8 46,2
College, university 81,4 64,6 53,9
Occupation (pensioners and unemployed people by their last job)
Self-employed 78,2 57,9 49,1
Intellectual worker with college/university
degree 81,6 65,6 57,0
Intellectual worker without college/university degree
78,1 60,9 45,0
Physical worker 59,8 41,1 33,2
Does not have and has not had a job 53,5 37,8 42,8 Current economic activity
Active job seeker 74,6 54,2 47,4
Unemployed 48,2 39,4 35,6
Retired 62,1 43,5 30,2
On maternal leave 62,1 49,1 37,3
Student 56,1 39,5 44,5
Housewife 65,8 45,4 44,8
Other dependant 43,4 41,6 30,8
In total 65,2 47,3 39,6
26
Level of education, as has been shown by previous international and national surveys, is an outstandingly important defining factor of voluntary behaviour. This statement is confirmed by the data of table no.18. The percentage of donors and volunteers grows with the level of education and is of a salient value in the case of university/college degree holders. In accordance with this, the survey by occupation groups also shows the much greater tendency of intellectual workers with university/college degrees to make sacrifices.
The picture is somewhat shaded by the overview of the connection between economic activity and charity. What is clear is that active job seekers participate in a much higher percentage in both forms of donating and voluntary activities than any other groups of society. The percentage of financial donors within the group of housewives also reached the average, which might mean the return of a part of society that can be considered the late successor of the old charitable women's societies. This is especially true if we consider that the percentage of volunteers within the same group goes well above average as well. The fact that the rate of volunteers is high among students is also an important (and promising) sign. Willingness of women on maternal leave to make donations in kind is probably the result of the mutual help they offer between each other to families with children (e.g. clothes, pushchairs, furniture etc.), but it also means that the formal and informal networks to facilitate these have also been developed by now.
3.3. Social links
Connection networks have a very important role in becoming a donor or volunteer. Not only because they mediate norms and create motivations, but they also create and operate the mechanisms that make the different forms of social participation an everyday routine and evident for the individual.
The more layers there are to social links and the tighter the individual’s social connections are, the more likely it becomes that he/she will contribute to completing the tasks important to the community as a donor and/or volunteer. It is highly likely that a part of the demographic and social characteristics described in the previous chapter formed such important explanatory factors because they also indicate the intensity of the relationship between the individual and society. (Marital status is clearly one such factor which indicates the size of informal networks; e.g. the presence of children in the family, which means connections with child institutions; the active job seeker’s status, which refers to the existence of workplace connections, or even age, which also has an effect on the extent and depth of connections.)
According to the data collected (Table no.19), having tight connections outside the informal sphere, membership of civil organisations such as societies and clubs, unions and political parties have a rather strong effect on voluntary activities and donating. Participation is much higher in all three forms of support among members than non-members. Differences in voluntary work are especially big (one and a half times more) in voluntary work. Civil organisations' and parties' members participate in making donations in kind much more intensively than those who are linked to these institutions only on occasions.
Table no. 20
Percentage of donors and volunteers by the intensity of social connections
Financial In kind Volunteers
Social links donors
percentage of population aged 14 and over Association membership
Non-member 63,0 44,8 35,6
Member 78,1 61,4 62,9
Union membership
Non-member 63,9 46,2 38,3
Union member 84,6 63,1 60,0
Party membership
Non-member 64,9 47,0 39,2
Party member 87,3 63,4 64,1
Religious links
Practices religion as prescribed by the church 81,7 57,2 46,5
Religious his/her way 65,0 46,5 39,4
Not religious 56,8 42,6 36,2
Ethnic minority
Not a member of any minorities 65,7 47,6 39,4 Member of a minority, as stated by the
answerer
55,0 41,9 41,7
Donating 1% of the answerer’s income tax
Filled out a form about the 1% 83,4 62,8 54,1
Paid taxes but did not fill out a disposal form 66,4 46,5 40,9 Non-tax payer, did not fill out a disposal form 58,3 42,0 34,0
In total 65,2 47,3 39,6
Belonging to a denomination has a similar effect on charity. The rate of donors and volunteers among those who practise religion as prescribed by their denomination is much higher than among those who are religious their own way. This clearly indicates that it is not so much the value system that influences people, but the frequency of requests and how much these requests are
‘underlined’.
The role of ethnic minority membership3 in voluntary activity is less clear. Among those who say they are a member of an ethnic minority, the percentage of donors is much lower and the percentage of volunteers is somewhat higher than in the rest of the population. It seems like solidarity is weaker in these groups of society than the average, or at least not strong enough to counterbalance the effects of poverty, low-level education and a bad labour market situation.
There seems to be a strong link between decisions to offer 1% of one’s income tax and the support given at the expense of one’s own income and free time. Those who offer the 1% are much better donors and volunteers than those who do not fill out the disposal form, despite paying income tax, let alone those who are not liable to pay taxes.
Diagram no.12
Distribution of tax payers by their behaviour regarding financial donations and the offering of 1%
of their income tax
83,4 66,4
16,6 33,6
0% 10% 20% 30% 40% 50% 60% 70% 80% 90% 100%
Offered 1%
Did not offer 1%
Donated money Did not donate money
These data clearly argue against the common assumption that many of us get their obligation to support ‘over and done with’ by paying the 1%. On the contrary; more than 4/5th of those who fill out the disposal form donate from their own money as well (diagram no.12) We can say with confidence then that the 1% system does not put the development of private donations at risk.
28
3 Out of the 5000 answerers chosen to appear in the table, 234 said they were members of an ethnic minority. The proportion of Romas was almost 2/3rd; therefore the findings of the ethnic minority survey were heavily influenced by their answers.
4. MOTIVES
Willingness to donate and join in voluntary activities is formed by the individuals’ different motives. People in tighter financial situations normally make financial donations less often, but they are, of course, willing to volunteer as well. Those whose parents also carried out voluntary activities will be more likely to connect to society the same way.
21% of the answerers responded to the question why they did not donate or volunteer in 2004. The most characteristic answer was; ‘I myself need support, I cannot afford to help others’, which 56%
of the answerers thought described their situation. A striking discovery was that, at the same time, lack of time was not a significant factor in staying clear of giving support. The majority of answerers believe in the usefulness of donations. The distrust in non-profit organisations also seems to be on the decrease, although there are many votes regarding this issue. Only 15% of the answerers ticked 5 to the answer; ‘There was not a particular reason (not to go), that is just how it happened' , which means that passivity is conscious behaviour in the population aged 14 and over.
Table no. 21
Marking of the reasons of non-donors (%)
Reason 1* 2 3 4 5
I need support myself 20,5 7,9 8,3 7,4 55,9
Donates his/her money to help the family 58,8 7,5 8,4 4,9 20,3
Has no time 58,0 8,1 15,7 6,0 12,2
Nobody asked for this kind of help 51,0 7,9 15,7 6,2 19,1 Does not believe in the usefulness of donations 44,3 7,6 23,6 9,9 14,6 Finds requests to donate disturbing 49,3 6,3 18,3 10,0 16,1
Too many frauds 33,8 6,2 18,3 13,9 17,8
Does not trust his/her support will be used for the right
purposes 33,8 7,9 23,8 13,0 21,5
No particular reason 54,7 6,8 18,3 5,5 14,7
1=does not apply at all, 5=applies the most
Out of the statements of motivation, ‘It felt good to help others’ received the highest marks;
more than 80% of the answerers ticked 4 or 5 to it. The statement ‘Volunteering and donating have a strong tradition in our family’ was also agreed by many and was marked 3 or above by more than half of the answerers.
Volunteering is definitely a versatile activity, which, for this reason, is hard to put into categories. Yet, it is possible to distinguish two groups by the sex, age, education and marital status of the volunteers. The new type of voluntarism serves the acquisition of knowledge, the useful spending of free time and self-development, whereas the old types include activities that can be linked to traditional civil values, solidarity, family motivation or perhaps a religious background.
30
An interesting finding is that statements regarding the new type of voluntarism found only very low support (e.g. connecting to community, useful spending of free time, self-development, gaining experience, etc.) According to international surveys, voluntarism of youth aiming at gaining knowledge is on the increase, whereas the number of traditional volunteers is dropping. The educational system in Hungary is not yet prepared to make voluntarism popular, which might have contributed to the low appearance of values of the new type of voluntarism.
Table no. 22
Motivation of volunteers (%)
Motivation 1* 2 3 4 5
Voluntarism is motivated by family 24,0 10,0 23,6 16,9 25,5 It feels good to help 4,0 4,8 8,5 18,9 63,7 Realising a concrete aim 47,7 7,7 15,1 11,5 18,0 Tight relation to the supported organisation 61,2 6,9 8,8 7,4 15,7
Grateful to the organisation 69,4 6,4 8,9 6,6 8,7 Life circumstances have improved 68,8 7,5 8,7 6,1 8,9 Quality of services used has improved 75,2 6,0 8,5 5,1 5,2 Connecting to community 63,1 6,6 11,2 9,1 10,0 Useful spending of free time 60,7 7,7 11,9 8,4 11,3 Getting to know myself through voluntarism 61,7 8,0 13,9 8,3 8,2
Gaining experience 53,6 7,7 15,4 10,9 12,4 Challenge, professional development 76,1 6,5 8,0 4,6 4,8
Acquiring a new job 94,4 2,3 1,7 0,8 0,8 Using tax deduction 94,2 2,0 1,6 1,0 1,2 Example set by close friends and acquaintances 43,1 7,7 20,2 13,0 16,0
Persuaded by others 78,3 6,0 8,1 3,5 4,2 Can afford to do so 33,1 9,6 19,9 13,2 24,2
Sudden decision 49,7 7,7 14,9 10,0 17,5 1=does not apply at all, 5=applies the most
The new and old type of voluntarism cannot be distinguished as sharply as previously anticipated. To assess this we have put the statements of motivation in new fields (e.g. if voluntarism is motivated by the family=traditional, old type; challenge, professional development=new type), by which we have created a variable to measure this difference. The differences are not too great but nonetheless characteristic.
Table no. 23
Old and new types of voluntarism
Old New
Sex Mostly women Mostly men
Age Over 30 Under 30
Qualification Secondary or lower Degree Marital status Married, with children Single
Numerous European and American studies have reported that carrying out voluntary activities can also help find paid employment. This finding has been supported by our ones in that 3% gave a higher mark than 3 to the question whether joining voluntarism helped them find paid employment.
Motivating people to join voluntary activities may be an important factor in reducing unemployment.
We asked about the answerers’ attitudes towards social problems by forming contradictory pairs, which they could mark from 1 to 10. At one end of the opposition stood the statements beyond the answerer’s decision and responsibility, whereas the focus of the other end is on the individual’s liability and problem-solving in community. The fact that almost all of the answers are closer to the community’s side paints us a positive picture. The last answer forms an exception, but the average of this hardly stayed on problem-shifting side (4.71). The choice made in this answer assumes consciousness in voluntarism and provides a very good reason to be optimistic about the social responsibility taken by communities and individuals. The answers moving mostly towards the centre also assume that there has been statements that divide the answerers, such as the answer given to the first statement, in the case of the rest of the statements, the majority's answers stayed on the right side of the diagram. To the last question 50% of the answerers gave a 5, however, 15%
agree completely with the left side’s statement, i.e. approaches voluntarism from the point of view of the donor’s good will.