0236-5383/$ 20.00 © 2018 Akadémiai Kiadó, Budapest
THE APPLICATION OF MAGNETIC RESONANCE IMAGING (MRI) TO THE EXAMINATION OF PLANT
TISSUES AND WATER BARRIERS
Pál Jakusch,1 * Tímea Kocsis,2
Ilona Kovácsné Székely2 and István Gábor Hatvani3*
1Eötvös Loránd University, Faculty of Science, Centre of Environmental Sciences, Pázmány Péter sétány 1/A, H-1117 Budapest, Hungary
2Budapest Business School University of Applied Sciences Faculty of Commerce, Catering and Tourism, Department of Methodology, Alkotmány u. 9–11, H-1054 Budapest, Hungary
3Institute of Geological and Geochemical Research, MTA Research Centre for Astronomy and Earth Sciences, Budaörsi út. 45, H-1112 Budapest, Hungary
(Received: May 3, 2018; accepted: July 30, 2018)
The aim of the present study is to extend the applicability of MRI measurements similar to those used in human diagnostics to the examination of water barriers in living plants, thus broadening their use in natural sciences. The cucumber, Cucumis sativus, and Phillyrea angustifolia, or false olive, were chosen as test plants. The MRI measurements were carried out on three samples of each plant in the same position vis-a-vis the MRI apparatus using a Siemens Avanto MRI scanner. Two different relaxation times were employed, T1,capable of histological mapping, and T2, used for the examination of water content. In the course of the analysis, it was found that certain histological formations and branching cause modifications to the intensity detected with relaxation time T2. Furthermore, these positions can also be found in T1 measurements. A monotonic correlation (cucumber: ρ = 0.829; false olive: ρ = –0.84) was observed between the T1 and T2 measurements. In the course of the statistical analysis of the signal intensities of the xylems it was concluded that they cannot be regarded as independent in a statistical sense; these changes rather depend on the anatomic structure of the plant, as the intensity profile is modified by nodes, leaves and branches. This serves as a demonstration of the applicability of MRI to the measurement of well know plant physiological processes. The special parametrization required for this equipment, which is usually used in human diagnostics, is also documented in the present study.
Keywords: Magnetic Resonance Imaging (MRI) – nodes – water barrier – water content – xylem
INTRODUCTION
The technique known as Magnetic Resonance Imaging (MRI) is mostly associated with its use in human diagnostics. Its increasingly widespread use in areas of non- human research presents researchers with new opportunities, and it must be conceded that there is still “much ground to cover”. The application of nuclear magnetic reso- nance imaging (NMR) to plant studies is of great interest, as it allows for repeated, non-invasive investigation at the microscopic scale of living plants under well- defined environmental conditions [14]. It is also true that the non-destructive study of
* Corresponding author; e-mail: hatvaniig@gmail.com
physiological processes in agricultural products requires increasingly higher spatial and temporal resolutions [25]. In this connection, Van As and van Duynhoven [45]
give a detailed overview of MRI application in plant sciences and of the possibilities of application in food industry.
MRI – From human diagnostics to plant physiological research
The advantage of the application of MRI is that it visualizes the tissues of the exam- ined plant in real time without causing anatomic dysfunction [30]. As in human diag- nostics, the method is non-destructive, and measurements can therefore be repeated several times on the same sample. Besides their destructiveness, the other problem with classical methods of making physiological measurements of plants is accuracy [32]. This is because classical methods make it hard to detect changes on account of the effects of the direct environment on the test subjects. The use of MRI in research into plant physiology may well be the solution to this problem. MRI measures the quantity and the distribution of the protons, making it suitable for the determination of the inner structure of the plants and the examination of the microdynamics of their water content [18]. Both direct and indirect MRI methods exist for this [31]. Such NMR and n-MRI techniques have been described and applied by Van As and Windt [44]. These non-destructive, non-invasive methods have also been employed to study the dynamics of plant water relations, e.g. changes under environmental stress [44].
Application of MRI in plant studies
There have been numerous studies exploring the possibilities of the application of MRI in investigations in the physical-, chemical-, life-, and clinical sciences. For example, a study by Yang et al. [51] yielded important thermodynamic and kinetic data on the formation of CO2 hydrate in flow systems, while Musse at al. [31] used MRI to quantify the apparent microporosity of apples and tomatoes. Quantitative MRI measurements have been used in several studies to investigate vegetal tissues [2, 6, 18]. Borisjuk et al. [7] provide a review of technological developments in MRI and the creation of opportunities for the three dimensional visualization and quantification of lipids in plant materials. In that study, the authors explain the importance of the imaging of lipids in living plants and further prospects for its use. NMR has also been used by Van der Weerd et al. [46, 47] to study the cell water balance in maize and pearl millet under osmotic stress. Mazhar et al. [27] give a detailed review of the application of MRI to the examination of fruit and vegetables, in which proton mag- netic resonance imaging (1H-MRI) has been applied since the 1980s to the non- destructive internal quality study of horticultural products. 1H-MRI has also been employed in the determination of the state of maturity in, for instance, avocadoes [10]. It has also been used to study disorders in fresh produce, including e.g. heat injury in mangoes [22] and mechanical injury in avocadoes [37]. Hills and Clark [18]
Acta Biologica Hungarica 69, 2018
review the general postharvest applications of 1H-MRI, including for internal quality evaluation in other fruit and vegetables including blueberry, cherry, durian, melon, mangosteen, nectarine, papaya, pineapple, strawberry, tangerine, water melon, and zucchini.
Being non-invasive, MRI gives high resolution information on the quantity of hydrogen in tissue without loss of or damage to that tissue [3]. As such, it has proved highly adaptable in physiological research, not only in the case of fruit [35] and veg- etables [29], but also trees [41]. MRI has been used to examine the maturing process of apples by Wang et al. [49], tomatoes by Ishida et al. [20] and Saltveit [36]. Several pieces of research conducted using MRI have had the aim of determining the nature of water transport and water distribution in the plant. Kuchenbrod et al. [25] con- ducted research on maize to examine the variation in flow conditions connected to transpiration at rates of between 1 and 10 mm s–1. This research was intended to enable the visualization of the water content/condition in the plant [39]. Research has also been carried out on cucumber plants using portable NMR to measure the water transport in situ in xylem [38, 41–43].
Environmental aspects
Water plays an essential role in plant development [40]. According to the Fifth Report of Intergovernmental Panel on Climate Change (IPCC), changes in the global water cycle in the 21st century will not be uniform the world over. The contrast in precipita- tion between wet and dry regions and between wet and dry seasons will increase, although there may be regional exceptions [19]. Prista et al. [34] worked out chron- ostratigraphic analogies for IPCC scenarios, and came to the conclusion that the Pliocene (Mid Piacenzian Warm Period) offers the best analogue for a warming cli- mate in Europe nowadays. The regional climate modelling results of the PRUDENCE project [4] showed that a change in precipitation may be expected in the Carpathian Basin, both in terms of quantity and distribution in the first decades of 21st century.
Apart from the fact that simulation results suggest that total annual precipitation has not changed to any great degree, changes significant in their size and opposite in their trends are to be expected in different seasons. The amount of seasonal precipitation is expected to increase in winter and decrease in summer. This may well culminate in the total restructuring of the annual distribution of precipitation [4]. Such regional precipitation changes as those already expected may cause permanent water stress to plants, in addition to any increase in heat stress that will likely be part of any such scenario.
Several abiotic stress factors have negative effects on the plant-water relationship [13, 48]. Therefore, if the growth of plants is to be facilitated through scientific efforts, the detailed investigation of the relationship between the plant and its water uptake is a priority. Plant responses to changing environmental conditions are dis- cussed in Brüggemann et al. [8], while the impact of anoxic conditions on phloem and xylem transport processes are discussed by Peuke et al. [33], as measured using MRI
flowmetry. In plants, the transport and accumulation of water and dry matter in dif- ferent organs and tissues is a major determinant on their growth and final composition [16, 23]. For this reason, it is important to review the functions of the recurring ele- ments on the plant’s stem. These are the following: nodes, internodes, leaf funda- ments and axillary buds [28]. Of these, the internodes play a key role in plant growth [17]. Beyond this, several other factors that cannot be disregarded influence plant development. One is the minerals supplied by the soil. In this regard, the zinc content of the plant is important [9] in processing the auxin hormone [12]. Another factor worth mentioning is the plant’s exposure to light. [26].
Aims
The aim of the present study is to highlight the applicability of MRI measurements of the type used in human diagnostics to the examination of water barriers in living plants, as part of the expansion of a new frontier in the natural sciences. It should be emphasized that the method employed in this study is not the usual one used in plant physiological studies. Rather, it is an MRI technique used in human diagnostics spe- cifically tuned (that is, parametrized in a series of trials) for the purposes of this specific piece of plant physiological research
MATERIALS AND METHODS
The basis of MRI measurements is the interaction between the external magnetic field, the electromagnetic waves and the hydrogen atoms of the material. MRI meas- ures the quantity and distribution of the protons. Water is among the materials with relatively high proton content, making it suitable for the examination of the plant- water relationship using MRI. It should be noted that MRI does not detect the particu- lar anatomic structure, but the quantity and distribution of water [21, 50] on the basis of the spin system in living plants. This, in turn, engages in just a weak interaction with the examined biological system’s macroscopic parameters, that is, those which influence its biological and chemical behavior. Therefore, such measurements make it possible to draw conclusions concerning the behavior of the examined biological system [5, 9, 15].
The measurements were carried out at the Kaposvár University Institute of Diagnostic Imaging and Radiation Oncology using a Siemens Avanto MRI apparatus of the kind used in human diagnostics, and capable of producing a 1.5 T magnetic field (Fig. 1).
The applied sequence is a medley of the sequences used in human diagnostics, specifically, those performed on the cranium, ankle and knee [21], each with its par- ticular setting (Table 1). These were obtained from a set of trials in which the factory settings corresponding to human diagnostics were adjusted on the basis of the opti- mization of the localized images. In terms of their mass, the plant samples are much
Table 1
Specific settings used in the MRI measurements tuned for plant physiological purposes, the analysis of cucumber and false olive
MRI Setting Name of the plant
Cucumber False olive
T1
Repetition time (sec) 1160 1160
Echo time (sec) 42118 3.94
Pixel spacing (mm) 0.36 0.97
Slice thickness (mm) 0.69 0.89
Resolution (pixel) 0.089 0.837
T2
Repetition time (sec) 42315 42151
Echo time (sec) 42131 2.38
Pixel spacing (mm) 0.35 0.976
Slice thickness (mm) 1 0.7
Resolution (pixel) 0.122 0.666
Fig. 1. Siemens Avanto MRI apparatus
smaller than the human body, with much less total water content. Therefore, a cranial coil was used, enabling investigators to focus in on the sample. This also meant that it was capable of a slice thickness of less than one millimeter (Table 1, T1: slice thick- ness).
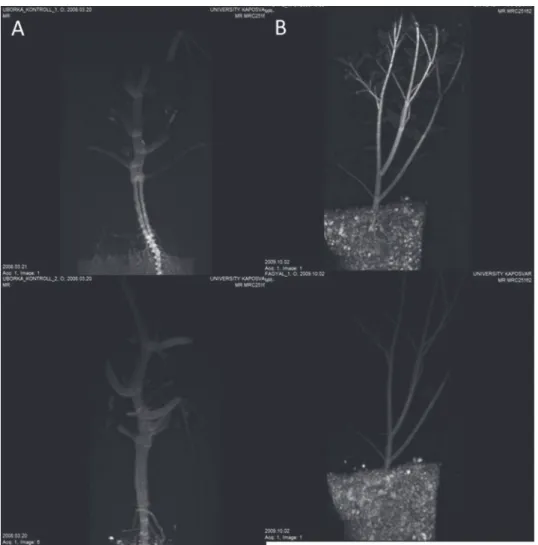
The test plants were grown under different conditions. The cucumber was grown in a modified Hoagland nutrition solution [24], and the false olive in a container (Fig. 2). The cucumber plants grew to a height of 15–20 cm and the false olive to 30–35 cm.
The intensity of the detected signal in the xylem elements was assessed as a func- tion of distance from the root. Stochastic connections were determined between the xylem elements inside the plant with the aim of examining the water-plant interac-
Fig. 2. MRI pictures of cucumber A) and false olive B), in which the upper panel represents the T1 and lower the T2 measurement
Acta Biologica Hungarica 69, 2018
tion. Water barriers caused by nodes and differences in the intensities caused by the anatomic structure were detected using T1 measurements; these were then correlated with the results of the T2 measurements. Transverse relaxation time (T2) is known to be related to the water status of cell compartments, i.e. their water content, water mobility, as well as the interactions between water and macromolecules [2, 31].
So-called T2-weighted 1H MR images produce regions of higher signal intensity (hyperintense) from tissue containing mobile water, whereas water in environments with restricted mobility gives rise to a reduced signal intensity (hypointense) [1, 27].
Statistics
Addinsoft’s XLSTAT 2017’s test for goodness of fit was employed to see if sample data displayed a normal distribution. The relationship was evaluated using Spearman’s ρ coefficient of correlation. LOWESS (locally weighted scatterplot smoothing [11]) non-parametric regression was used to determine the relationship between the dis- tance of the root and the T1 and T2 relaxation times, respectively. The coefficient of determination of non-parametric regression is used to show the percentage of the total deviation explained by distance from the root at T1 and T2.
RESULTS AND DISCUSSION Examination of the xylem of cucumber
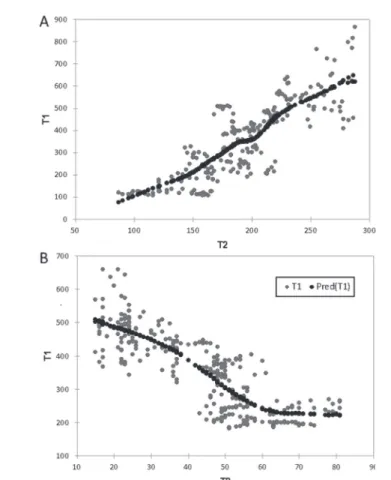
Xylems in the hypocotyls of cucumber were examined one by one using MRI. In this part of the branch the vascular tissues may be easily seen. As the distribution of the data is significantly different from a normal distribution (p-value < 0.0001 for T1, and p < 0.0174 for T2), a non-parametric regression method was chosen to determine the relationship between the relaxation time values of T1 (activity of the cells) and T2 (water content). Spearman’s ρ was 0.829, indicating a significant strong positive monotonic correlation between T1 and T2 relaxation times (p-value < 0.0001). The coefficient of determination of the non-parametric regression was 67.9% (Fig. 3a).
Examination of the xylem of false olive
After segmenting the branch part of the false olive, since the plant has both main and lateral stems, the two sides could be differentiated in the MRI images, as the curves of the intensity signals partly diverged approaching the branch apex. Further exami- nations were carried out on the main branch. The intensity signals on the two sides of the branch were found to be not independent of each other. The distribution of the data is significantly different from that characteristic of a normal distribution (p-value < 0.0001 for both relaxation times). Consequently, a non-parametric regres-
sion method was used to determine the relationship between the values of T1 (activ- ity of the cells) and T2 (water content) relaxation times. Spearman’s ρ was –0.84, indicating a significant (p-value < 0.0001) and strong negative monotonic correlation between T1 and T2 relaxation times. The coefficient of determination given by LOWESS was 69.6%, and a negative relationship between the variables is observable (Fig. 3b).
Detection of anatomic structure and its interpretation
Anatomical differences that cause local maximum and minimum points in the inten- sity signals of T2 measurements could be detected by T1 measurements. Using the two types of measurement technique, the location of the nodes on the branch causing local
Fig. 3. Non-parametric regression between T1 and T2 measurements of cucumber A and false olive B
Acta Biologica Hungarica 69, 2018
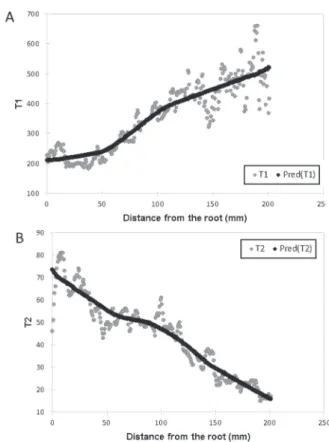
maxima was determined. Local maximum points were found at heights of 26.22 mm, 71.76 mm, 91.08 mm, 109.02 mm, and 130.41 mm, respectively (Fig. 4) in the case of cucumber. Spearman’s ρ was –0.942, indicating a significant (p-value < 0.0001) strong negative monotonic correlation between the distance from the root and T1 values. Moreover, ρ was –0.918 in the case of the distance from the root and T2 val- ues, indicating a significant (p-value < 0.0001) strong negative monotonic correlation as well. A non-parametric regression was applied to describe the relationship between the distance from the root and the relaxation times (Fig. 4). The coefficient of deter- mination using LOWESS between the distance from the root and T1 and T2 values was 89% and 86.6%, respectively.
Nodes were also determined for the false olive at several locations along the stem.
Local maxima and minima in the signal intensity were detected using the data from the T1 measurements. Nodes were found at heights of 10.5 mm, 25.2 mm, 39.9 mm, 60.2 mm, 72.8 mm, 86.1 mm, 102.2 mm, 118.3 mm, 128.1 mm, 154.7 mm and 186.2 mm (Fig. 5). Spearman’s ρ was 0.903, indicating a significant (p-value < 0.0001)
Fig. 4. The intensity signal of T1 A and T2 B measurements as a function of the distance from the root for cucumber
strong positive monotonic correlation between the distance from the root and T1 val- ues. This figure was ρ = –0.938 between the distance from the root and T2 values indicating a significant (p-value < 0.0001) strong negative monotonic correlation. A non-parametric regression method was applied to the description of the relationship between the distance from the root and the relaxation times (Fig. 5). The coefficient of determination between the distance from the root and T1 and T2 values was 85.2%
and 91%, respectively.
In the course of the examination of the two plant species, it was demonstrated that MRI signal intensity (which is in direct relationship with the water content) decreased from the root upwards, towards the branch apex. In general, the water content of the plant is not independent of its height. The various water barriers deriving from a plant’s anatomy are caused by the special structure of nodes. These anatomic ele- ments and their effects can be detected and determined using MRI. Intensity signal data deriving from the T1 and T2 measurements show high correlations for both of the plant species used in the research.
Fig. 5. The intensity signal of T1 A and T2 B measurements as a function of the distance from the root for false olive
Acta Biologica Hungarica 69, 2018
Functional MRI has also been used to study transients of biophysical parameters in a cucumber plants in response to environmental changes [39]. The detailed flow imaging experiments showed the location of xylem and phloem in the stem, as well as highlighting the changes in the biophysical parameters of plants in response to environmental changes [39]. The results of the measurements made in this study concerning changes in the water content of the plants (T2 measurements) are parallel to the findings of these investigations.
A better understanding is needed of the mechanism of phloem transport, the factors that determine the allocation of carbon to various organs, and the relation between xylem anatomy and conductivity [45]. In the T2 measurements in the present research, the anatomical structure of xylem elements appear to affect water transport. This knowledge may in turn assist in the better understanding of phloem transport.
CONCLUSIONS
The present study demonstrates that, besides their use in human diagnostics, the util- ity of MRI techniques extends to the investigation of plant physiology. In this respect, it represents a novel tool in the hands of the researchers into not only plant physiol- ogy, but to the integrated examination of soil, root, stem and leaf water content, root anatomy, and (radial and axial) transport in roots, the stem, and leaves.
With this approach, accurate, high resolution measurements could be made in a non-destructive way, allowing the measurement of a given specimen several times.
Moreover, it was possible to detect the exact anatomic elements of the plants at a scale of less than one millimeter. Measurements were made using complementary T1 and T2 relaxation time techniques. For the interpretation of the maximum and mini- mum values of T2 data, T1 measurements were also necessary. It was demonstrated that the curve of the intensity signal of xylem elements depends on the anatomic structure, and that the intensity profile was modified by the nodes, leaves and the branches.
With the application of the MRI used in human diagnostics to plant physiological studies, researchers gain the possibility of exploiting the capacity of MRI equipment in medical centers and hospitals, as in the case of the present research.
REFERENCES
1. Abbott, J. A. (1999) Quality measurement of fruits and vegetables. Postharvest Biol. Technol. 15, 207–225.
2. Adriaensen, H., Musse, M., Quellec, S., Vignaud, A., Cambert, M., Mariette, F. (2013) MSE-MRI sequence optimisation for measurement of bi- and tri-exponential T2 relaxation in a phantom and fruit. Magn. Reson. Imaging 31, 1677–1689.
3. Andaur, J. E., Guesalaga, A. R., Agosin, E. E., Guarini, M. W., Irarrázaval, P. (2004) Magnetic Resonance Imaging for nondestructive analysis of wine grapes. J. Agric. Food Chem. 52, 165–170.
4. Bartholy, J., Pongrácz, R., Gelybó, Gy., Szabó, P. (2008) Analysis of expected climate change in the Carpathian Basin using the PRUDENCE results. Időjárás 112, 249–265.
5. Berényi, E., Bogner, P., Horváth, Gy., Repa, I. (1997) Radiológia. Budapest, Springer Hungarica Kiadó Kft. (in Hungarian)
6. Borisjuk, L., Rolletschek, H., Neuberger, T. (2012) Surveying the plant’s world by magnetic resonance imaging. Plant 70, 129–146.
7. Borisjuk, L., Rolletschek, H., Neuberger, T. (2013) Nuclear magnetic resonance imaging of lipid in living plants. Prog. Lipid Res. 52, 465–487.
8. Bürggemann, N., Gessler, A., Kayler, Z., Keel, S. G., Badeck, F., Barthel, M., Buchmann, N., Brugnoli, E., Esperschütz, J., Gavrichkova, O., Ghashghaie, J., Gomez-Casanovas, N., Keitel, C., Knohl, A., Kuptz, D., Palacio, S., Salmon, Y., Uchida, Y., Bahn, M. (2011) Carbon allocation and carbon isotope fluxes in the plant-soil-atmosphere continuum: a review. Biogeosciences 8, 3457–3489.
9. Buxton, B. R. (2009) Introduction to Functional Magnetic Resonance Imaging. Cambridge Univer- sity Press.
10. Chen, P., McCarthy, M. J., Kim, S. M., Zion, B., Trans, A. (1996) Development of a high speed NMR technique for sensing maturity of avocados. Trans. ASAE 39, 2205–2209.
11. Cleveland, W. S., Devlin, S. J. (1988) Locally weighted regression: An approach to regression analysis by local fitting. J. Am. Stat. Assoc. 83, 596–610.
12. Cosgrove, D. J. (2005) Growth of the plant cell wall. Nat. Rev. Mol. Cell Biol. 6, 850–861.
13. Daudet, F. A., Lacointe, A., Gaudillère, J. P., Cruiziat, P. (2002) Generalized Münch coupling between sugar and water fluxes for modeling carbon allocation as affected by water status. J. Theor. Biol. 214, 481–498.
14. Edzes, H. T., Van Dusschoten, D., Van As, H. (1998) Quanitative T2 imaging of plant tissues by mean of multi-echo MRI microscopy. Magn. Reson. Imaging 16, 185–196.
15. Földes, T., Bogner, P., Závoda, F., Repa, I. (2003) Opportunities of CT and MRI measurements in carbohydrate research. Magy. Radiológia 10, 231–237. (in Hungarian)
16. Guichard, S., Gary, C., Leonardi, C., Bertin, N. (2005) Analysis of growth and water relation of tomato fruits in relation to air vapor pressure deficit and plant fruit load. J. Plant Growth Regul. 24, 1–13.
17. Haraszty, Á., Hortobágyi, T., Fridvalszky, L., Kiss, I., Pólya, L. (1978) Növényszervezettan és növény- élettan. Nemzeti Tankönyvkiadó. Budapest (in Hungarian)
18. Hills, B. P., Clark, C. J. (2003) Quality assessment of horticultural products by NMR. Ann. R. Nmr.
S. 50, 75–120.
19. IPCC (2013) Summary for Policymakers. In: Stocker, T. F., D. Qin, G.-K. (eds) Climate Change 2013: The Physical Science Basis. Contribution of Working Group I to the Fifth Assessment Report of the Intergovernmental Panel on Climate Change. Plattner, M., Tignor, S. K., Allen, J., Boschung, A., Nauels, Y., Xia, V., Bex, P. M. Midgley (eds)]. Cambridge University Press, Cambridge, United Kingdom and New York, NY, USA. www.ipcc.ch
20. Ishida, N., Kobayashi, T., Koizumi, M., Kano, H. (1989) 1-H-NMR imaging of tomato fruits. Agric.
Biol. Chem. 53, 2363–2367.
21. Jakusch, P., Anda, A. (2010) New possibilities in following the transport of water in living plants.
10th Annual Meeting of the European Meteorological Society (EMS) and 8th ECAC, Switzerland.
22. Joyce, D. C., Hockings, P. D., Mazucco, R. A., Shorter, A. J., Brereton, I. M. (1993) Heat treatment injury of mango fruit revealed by nondestructive magnetic resonance imaging. Postharvest Biol. Tech.
3, 305–311.
23. Kenouche, S., Perrier, M., Bertin, N. J., Larionova, J., Ayadi, A., Zanca, M., Long, J., Bezzi, N., Stein, P. C., Guari, Y., Cieslak, M., Godin, C., Goze-Bac, C. (2014) In vivo quantitative NMR imaging of fruit tissues during growth using Spoiled Gradient Echo sequence. Magn. Reson. Imaging 32, 1418–1427.
24. Kovács, K., Kuzmann, E., Vértes, A., Lévai, L., Cseh, E., Fodor, F. (2010) Effect of cadmium on iron uptake in cucumber roots: A Mössbauer-spectroscopic study. Plant Soil 327, 49–56.
Acta Biologica Hungarica 69, 2018 25. Kuchenbrod, E., Kahler, E., Thürmer, F., Deichmann, R., Zimmermann, U., Haase, A. (1998)
Functional Magnetic Resonance Imaging in intact plants-quantitative observation of flow in plant vessels. Magn. Reson. Imaging 16, 331–338.
26. Larcher, W. (2004) Physiological Plant Ecology. Springer-Verlag, Berlin Heidelberg.
27. Mazhar, M., Joyce, D., Cowinc, G., Breretonc, I., Hofmand, P., Collins, R., Gupta, M. (2015) Non-destructive 1H-MRI assessment of flesh bruising in avocado (Persea americana M.) cv. Hass.
Postharvest Biol. Tech. 100, 33–40.
28. Mohr, H., Schopfer, P. (1995) Plant Physiology. Springer-Verlag. Berlin-Heidelberg.
29. Moreda, G. P., Ortiz. Canavate, J., Garcia-Ramos, F. J., Ruiz-Altisent, M. (2009) Non-destructive technologies for fruit and vegetable size determination – a review. J. Food Eng. 92, 119–136.
30. Muja, N., Bulte, J. W. M. (2009) Magnetic resonance imaging of cells in experimental disease models.
Prog. Nucl. Mag. Res. Sp. 55, 61–77.
31. Musse, M., De Guio, F., Quellec, S., Cambert, M., Challois, S., Davenel, A. (2010) Quantification of microporosity in fruit by MRI at various magnetic fields: comparison with X-ray microtomography.
Magn. Reson. Imaging 28, 1525–1534.
32. Pearcy, R. W., Ehleringer, J., Mooney, H. A., Rundel, P. W. (1991) Plant Physiological Ecology.
Chapman and Hall, London–New York–Tokyo.
33. Peuke, A. D., Gessler, A., Trumbore, S., Windt, C. W., Homan, N., Gerkema, E., Van As, H. (2014) Phloem flow and sugar transport in Ricinus communis L. is inhibited under anoxic conditions of shoot or roots. Plant Cell Environ, DOI: 10.1111/pce.12399
34. Prista, G. O., Agostinho, R. J., Cachao, M., A. (2015) Observing the past to better understand the future: a synthesis of the Neogene climate in Europe and its perspectives on present climate change.
Open Geosci. 7, 65–83.
35. Raffo, A., Gainferri, R., Barbieri, R., Brosio, E. (2005) Rippening of banana fruit monitored by water relaxation and diffusion H-1-NMR measurements. Food Chem. 89, 149–158.
36. Saltveit, M. E. (1991) Determining tomato fruit maturity with nondestructive in vivo nuclear magnetic resonance imaging. Postharvest Biol. Tech. 1, 153–159.
37. Sanches, J., Biscegli, C. I., Durigan, J. F., Sim es, M. L., da Silva, W. T. L. (2003) Diagnosis of mechanical injuries in avocados by magnetic resonance imaging. In: V World Avocado Congress, Granada, Málaga, Spain, pp. 695–700.
38. Schaafsma, T. J., Van As, H., Palstra, W. D., Snaar, J. E., de Jager, P. A. (1992) Quantitative measurement and imaging of transport processes in plants and porous media by 1H NMR. Magn.
Reson. Imaging 10, 827–836.
39. Scheenen, T., Heemskerk, A., Jager, de A., Vergeldt, F., Van As, H. (2002) Functional imaging of plants: A nuclear magnetic resonance study of cucumber plant. Biophys. J. 82, 481–492.
40. Van As, H., Scheenen, T., Vergeldt, F. J. (2009) MRI of intact plants. Photosynth. Res. 102, 213–222.
41. Van As, H. (2007) Intact plant MRI for the study of cell water relations, membrane permeability, cell- to-cell and long-distance water transport. J. Exp. Bot. 58, 743–756.
42. Van As, H., Schaafsma, T. J. (1984) Noninvasive measurement of plant water flow by nuclear magnetic resonance. Biophys. J. 45, 469–472.
43. Van As, H., Reijnders, J. E., de Jager, P. A., P. A. van de Sanden, Schaafsma, T. J. (1994) In situ plant water balance studies using a portable NMR spectrometer. J. Exp. Bot. 45, 61–67.
44. Van As, H., Windt, C. W. (2008) Magnetic Resonance Imaging of Plants: Water Balance and Water Transport in Relation to Photosynthetic Activity. In: Aartsma, T. J., Matysik, J. (eds) Biophysical Techniques in Photosynthesis II. Springer, Berlin_Heidelberg, pp. 55–75.
45. Van As, H., van Duynhoven, J. (2013) MRI of plants and foods. J. Magn. Reson. 229, 25–34.
46. Van der Weerd, L., Claessens, M. M. A. E., Edfé, C., Van As, H. (2002) Nuclear magnetic resonance imaging of membrane permeabilty changes in plants during osmotis stress. Plant Cell Environ. 25, 1539–1549.
47. Van der Weerd, L., Claessens, M. M. A. E., Ruttink, T., Vergeldt, F. J., Schaafsma, T. J., Van As, H.
(2001) Quantitative NMR microscopy of osmotic stress responses in maize and pearl millet. J. Exp.
Bot. 52/365, 2333–2343.
48. Verslues, P. E., Agarwal, M., Katiyar-Agarwal, S. Zhu, J. H., Zhu, J. K. (2006) Methods and concepts in quantifying resistance to drought, salt and freezing, abiotic stresses that affect plant water status.
Plant. J. 45, 523–539.
49. Wang, S. Y., Wang, P. C., Faust, M. (1988) Non-destructive detection of water-core in apple with nuclear magnetic resonance imaging. Hort-Science 35, 227–234.
50. Westbrook, C., Roth, C. K., Talbot, J. (2005) MRI in practice. Blackwell publishing. Italy.
51. Yang, M., Song, Y., Zhu, N., Zhao, Y., Liu, Y., Jiang, L. (2013) Dynamic measurements of CO2 flow in water saturated porous medium at low temperature using MRI. Energy Proced. 37, 1267–1274.