New Medicine 79
2/2012
© Borgis
regional studies on health science
o r i g i n a l p a p e r s
COMPARATIVE ANALYSIS
OF QUESTIONNAIRES EXPLORING NUTRITIONAL STATUS AND RISK
OF MALNUTRITION IN THE ELDERLY LIVING IN RESIDENTIAL CARE
*enikő turóczi, Márta Veresné Bálint, róbertné csajbók, adrienn lichthammer, istván szabolcs
Department of Dietetics and Nutritional Sciences, Faculty of Health Sciences; Semmelweis University Budapest, Hungary
Head of Department: prof. dr. István Szabolcs, MD, PhD
Summary
Aim. Our aim was to compare different validated questionnaires that measure nutritional status and risk of malnutrition in the institutionalized elderly, matching these with data of the body mass index (BMI) and to evaluate comparatively the usefulness of these measurement methods.
Material and methods. 104 elderly volunteers (N = 104, aged 50-94, median age: 78.3) living in social institutions were investi- gated for risk of malnutrition comparing five different questionnaires – SNAQ, NSI, MNA, MUST, SCREEN II. Data process- ing was performed using Microsoft Excel version 2003 and SPSS Statistics version 17.0.
Results. SNAQ, MUST and especially MNA showed a significant correlation with BMI, so these questionnaires can be primar- ily recommended for measuring elderly malnutrition. Two of them, MUST and SNAQ, filtered nearly the same subgroup of
“no risk of malnutrition” cases. On the other hand, the use of NSI and SCREEN II can be queried because their results did not correlate well with BMI and they identified more cases to be threatened by malnutrition than the other questionnaires listed above.
Conclusions. Concordance of the results by using SNAQ, MUST and MNA indicate that they are the best methods to estimate nutritional status and risk of malnutrition in the elderly. However, MNA is a more complex survey with more questions and therefore it requires more time to be filled out.
On the other hand, NSI and SCREEN II seem to be less appropriate for measuring the risk of malnutrition at least in the Hungarian institutionalized elderly.
Key words: elderly, nutritional status, BMI, malnutrition screening tools, questionnaires INTRODUCTION
In the elderly, adequate nutritional status is of key importance to maintaining health and quality of life.
However, monitoring of nutritional status in the elderly is often neglected or performed too late and malnutrition may develop with serious consequences. Therefore, evaluation of the nutritional status and habits of the el- derly and screening for malnutrition is an important task of clinical gerontology.
Data from numerous validated surveys performed in different countries by different are available (1-3) but a comparative evaluation of the different questionnaires used regarding their ability to evaluate the nutritional status and habits is lacking.
AIMS
We aimed to examine in a comparative manner the usefulness of different validated questionnaires to mea- sure the nutritional status and risk of malnutrition in elder-
ly home residents as well as to match the recorded data against the body mass index in order to assess similarity and divergence of the different validated questionnaires.
MATERIAL AND METHODS
The survey was performed in four elderly homes of Budapest in August 2011. 104 elderly subjects volun- teered for the study. Age groups were classified accord- ing to the WHO classification (4). All participants filled out all 5 questionnaires with the assistance of a regis- tered dietician. The five validated questionnaires can be found as below:
SNAQ (http://www.slu.edu/readstory/newslink/6349), NSI (http://www.mnaging.org/pdf/dynh.pdf),
MNA (http://www.mna-elderly.com/mna_forms.html), MUST (http://amnutrition.hu/downloads/upload/200910 51403522008130112428must.pdf),
SCREEN II (with permission of Dr. Heather Keller, cre- ator of the questionnaire).
80 New Medicine
3/2012
Enikő Turóczi et al.
Body mass index (BMI) of the participants was calcu- lated from the actual body mass and height.
Data processing was performed using Microsoft Ex- cel version 2003 and SPSS Statistics version 17.0. For statistics we used frequency rows to arrange the nu- merical data, when we were in need of sorting the num- bers by quantitative criteria. Correlation of one or two variables, and frequency distribution of combined data were examined with the help of cross tables. We tested the existence of a relation between two qualitative vari- ables with examination of separateness. The intensity of the existing relation was analysed with the Cramer indicator. All statistical tests were performed at the sig- nificance level of 5%.
Data collection and processing were performed with permission of the ethical committee (TUKEB number:
186/2011), taking into consideration the laws of ano- nymity and the protection of data.
RESULTS
Categorisation of the questionnaires according to their results (rate of risk and no risk of malnutrition in the el- derly).
According to their results, the five surveys could be grouped into three main categories, indicating the state of elderly nutrition (fig. 1).
1. The MUST and the SNAQ questionnaires gave simi- lar results. They filtered nearly the same numbers of cases with risk of malnutrition as well as those with no threat, and therefore they were put into one category.
2. The NSI and the SCREEN II questionnaires rated far more persons in the group of malnutrition risk than the previous questionnaires, but the results were nearly equal; therefore they were also put into one category.
3. Results with MNA were intermediate so it was not classified in category 1 or 2 (fig. 1).
Further evaluation of the questionnaires with similar results
Using MUST and SNAQ 69.2% of the participants were put into the same category. This may be explained by the similarity of the questionnaires itself: they include relatively few questions, so their completion requires only a few minutes. There is a difference that SNAQ con- sists of questions about appetite and culinary habits as well, while MUST requires also body mass and height
measurements. Statistically, the difference between the outcomes of the two surveys is significant but the signifi- cance is rather weak (p = 0.040; C = 0.202) (tab. 1).
Table 1. Comparison of the results of SNAQ and MUST (N = 104).
Must total
(persons) No risk
(persons)
Risk (persons)
snaQ
No risk
(persons) *61 15 76
Risk
(persons) 17 11 28
total (persons) 78 26 104
* p = 0.040 versus the risk categories
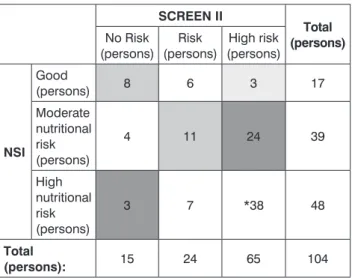
By comparison of NSI and SCREEN II, it can be seen that as compared to the previous surveys, they classi- fied fewer people, 57 (only 54.8%), in the same catego- ry. In the case of a further 24 persons only a slight dif- ference can be observed, while 6 persons were placed into a completely opposite group based on the surveys (tab. 2). There is a significant difference between the outcomes of NSI and SCREEN II (p = 0.00; C = 0.350).
Filling out NSI requires 4-5 minutes, while with SCREEN II it takes about 5-10 minutes; however, they ended in similar results (tab. 2).
Table 2. Comparison of the results of NSI and SCREEN II (N = 104).
screen ii
total (persons) No Risk
(persons) Risk
(persons) High risk (persons)
nsi Good
(persons) 8 6 3 17
Moderate nutritional risk (persons)
4 11 24 39
High nutritional risk (persons)
3 7 *38 48
total
(persons): 15 24 65 104
*p = 0.00 versus the lower risk categories
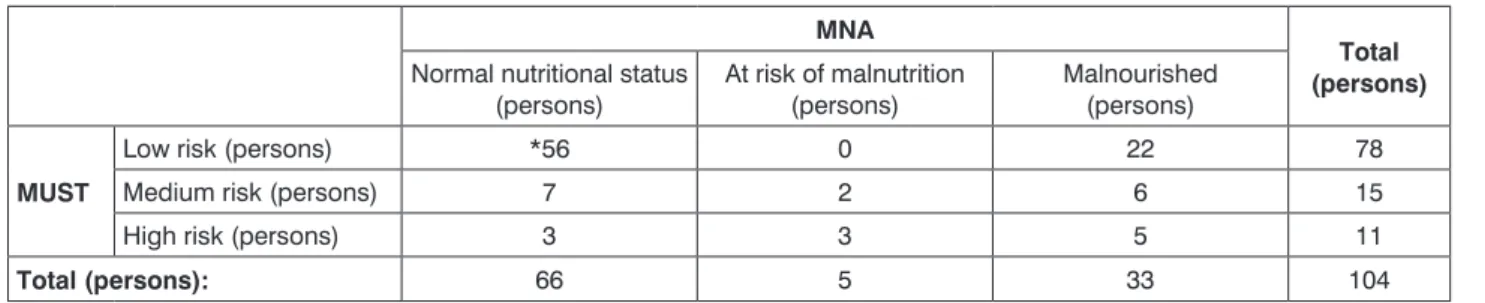
comparison of surveys of the longest and shortest completion time
Comparing MUST, which has the fewest questions with the shortest completion time, and MNA, which has the most questions with the longest completion time, it was found that these questionnaires put 63 persons (60.5%) into the same group. The two methods were mostly the same in case of no risk of malnutrition. Al- though the two surveys classified 25 persons (24%) into Fig. 1. Comparison of the different survey results (N = 104).
New Medicine 81
3/2012
Comparative analysis of questionnaires exploring nutritional status and risk of malnutrition in the elderly living in residential care
a completely opposite category, their outcomes are still significant with each other with a moderately strong rela- tion (p = 0.00; C = 0.331) (tab. 3).
Both methods require an expert to complete. They con- sist of closed questions and anthropometric data (tab. 3).
comparison of the results of the surveys and the BMi (body mass index)
During the comparison of NSI and BMI, we observed that the classification of the two methods is diffused;
there is no relation between their results. The same could be noted after the analysis of SCREEN II and BMI.
The MNA and the BMI grouped the same number of undernourished people, except one person, and the category of “good/normal” with 27 persons was the same. The BMI could also detect the fact of overweight and obesity in the case of 19-19 persons, who were rated in the “good” category by the MNA, since it only measures the malnutrition or the chance of that. Con- sequently the two methods classified 73 persons (70%) into the same category (tab. 4). There is a moderately strong significance between their results (p = 0.00;
C = 0.429) (tab. 4).
According to MUST and BMI, 9 people belong to the category of “malnutrition”. Since the MUST does not make a distinction either between normal, overweight or obese cases, the two methods classified a further 78 persons in the category of no malnutrition threat. Alto- gether 87 people (83.6%) were placed in the same cat- egory of the two techniques. Between their results, there is moderate strong relation (p = 0.00; C = 0.426).
We can state that SNAQ and BMI classified 79 per- sons (76%) similarly. There is significance between their results, which is slightly less than moderate (p = 0.023;
C = 0.303).
DISCUSSION
The measurement of nutritional status is the basis of geriatric service (5, 6). Since the number of elderly is con- tinuously growing, fast and reliable methods are needed which allow one to screen the elderly who are undernour- ished or at risk of malnutrition in order to implement in- tervention (7). For this purpose, validated questionnaire methods are often used among the elderly; according to the literature, ten different ones exist (1, 2).
Those remarkable domestic (8-11) and foreign (12-15) examinations, which measured the nutritional status and the risk of malnutrition of the elderly, used different methods; thus – apart from some exceptions – their results cannot be compared entirely. Therefore the screening methods themselves need to be com- pared and analysed. In 2011, a study compared five different questionnaires (MUST, SNAQ, NRS2002, MST and MNA-SF) with the help of inpatients (16). In our present investigation we analysed the screening tools of SNAQ, NSI, MNA, MUST and SCREEN II, with the par- ticipation of elderly subjects.
CONCLUSIONS
In the course of our research, we found three meth- ods – SNAQ, MUST, MNA – equally good to be used for evaluating the nutritional status and the risk of malnutri- Table 3.Comparison of the results of MUST and MNA (N = 104).
Mna total
(persons) Normal nutritional status
(persons)
At risk of malnutrition (persons)
Malnourished (persons)
Must
Low risk (persons) *56 0 22 78
Medium risk (persons) 7 2 6 15
High risk (persons) 3 3 5 11
total (persons): 66 5 33 104
*p = 0.00 versus the higher risk categories
Table 4. Comparison of the results of MNA and BMI (N = 104).
BMI classification 1 (kg/m2)
total (persons) Underweight
(< 18.5) (persons)
Normal (18.5-24.99)
(persons)
Overweight (≥ 25) (persons)
Obese (≥ 30) (persons)
Mna categories
Normal nutritional status
(persons) 1 *27 19 19 66
At risk of malnutrition
(persons) 4 1 0 0 5
Malnourished
(persons) 4 9 11 9 33
total (persons): 9 37 30 28 104
1: http://apps.who.int/bmi/index.jsp?introPage=intro_3.html – 2011.06.12.
*p = 0.00 versus the other categories
82 New Medicine
3/2012
Enikő Turóczi et al.
tion of Hungarian elderly people. Only the results of these surveys correlate with the BMI values. The result of the MNA showed the closest relation from among them. The MUST and the SNAQ screened nearly the same amount of cases that have no malnutrition risk. Both question- naires have a fast completion time; therefore the deci- sion about which to use is always influenced by aspects of the examination.
On the basis of the outcomes, the use of NSI and SCREEN II for filtering malnutrition risk of Hungarian el- derly is only worth considering, while they categorized the examined people into the group of malnutrition risk in a higher ratio than the other methods. Moreover, their results differed much more from BMI values.
References
1. Phillips MB, Foley AL, Barnard R et al.: Nutritional screening in community-dwelling older adults: a systematic literature review. Asia Pac J Clin Nutr 2010; 19(3): 440-449. 2. Bauer JM, Kaiser MJ, Sieber CC:
Evaluation of nutritional status in older persons: nutritional screening and assessment. Curr Opin Clin Nutr Metab Care 2010; 13(1): 8-13. 3. Queen- sland Government: Validated Malnutrition Screening Tools: Comparison Guide. (http://www.health.qld.gov.au/nutrition/resources/hphe_scrn_tools.
pdf) – 2011 július 12. 4. Bagyinszki Z, Kovács I, Péntek B: Idősek szociális
ellátása. Budapest, Nemzeti Szakképzési és Felnőttképzési Intézet 2007.
5. Hartmann G: Időskor II. rész. Élelmezés 2007; 10: 35-40. 6. Székács B (szerk.): Geriátria – az időskor gyógyászata Budapest, Semmelweis Kiadó 2005. 7. Antal M, Regöly-Mérei A: Táplálkozás, életmód időskorban- kockázati tényezők és ajánlások. Orvosi Hetilap 2011; 152: 182-189.
8. Barta Zs, Mekkel G, Bakó Gy: A tápláltsági állapot felmérése idős betegekben tápláltsági állapotot értékelő űrlap (MNA) segítségével. Mag- yar Belorvosi Archivum 2003; 56: 152-156. 9. Békési K, Veresné Bálint M:
Tápláltsági állapot és tápanyag – ellátottság időskorban. Új diéta 2007; 1:
10-11. 10. Lelovics Zs, Henter I, Kubányi J: Szociális otthonokban végzett tápláltságiállapot-szűrés (MUST) eredménye. Új diéta 2005; 4: 14-15.
11. Lelovics Zs: A tartós bentlakásos intézményekben élő időskorúak tápláltsági állapota és táplálkozási rehabilitációja. Új diéta 2009; 3-4: 7-9.
12. Keller HH, Haresign H, Brockest B: Process evaluation of bringing nu- trition screening to seniors in Canada (BNSS). Can J Diet Pract Res 2007;
68(2): 86-91. 13. Heuberger RA, Caudell K: Polypharmacy and nutritional status in older adults: a cross-sectional study. Drugs Aging 2011; 28(4):
315-323. 14. Lee JS, Weyant RJ, Corby P et al.: Edentulism and nutritional status in a biracial sample of wellfunctioning, community-dwelling elderly:
the Health, Aging, and Body Composition Study. The American Journal of Clinical Nutrition 2004; 79: 295-302. 15. Lesser S, Pauly L, Volkert D:
Nutritional situation of the elderly in Eastern/Baltic and Central/Western Europe – the AgeingNutrition project. Ann Nutr Metab 2008; 52(1): 62-71.
16. Neelemaat F, Meijers J, Kruizenga H et al.: Comparison of five malnu- trition screening tools in one hospital inpatient sample. J Clin Nurs 2011;
20(15-16): 2144-2152.
Correspondence to:
* Enikő Turóczi Department of Dietetics and Nutritional Sciences, Faculty of Health Sciences, Semmelweis University 17 Vas St., H-1080 Budapest, Hungary
tel.: +36 30 514 91 47 e-mail: enikoturoczi@gmail.com Received: 22.08.2012
Accepted: 10.09.2012