DOES THE POST-SOCIALIST PAST DETERMINE THE RELATIONSHIP BETWEEN GDP PER CAPITA
AND EDUCATION?*
EVIDENCE FROM EUROPE
Zsuzsanna BANÁSZ – Vivien Valéria CSÁNYI
(Received: 19 October 2017; revision received: 6 May 2018;
accepted: 15 July 2018)
Education is one of the key factors of economic growth. Despite the huge amount of researches investigating the relationship between education and GDP as a proxy of well-being, to the best of our knowledge, none of these studies examined a group of post-socialist countries comparing with not-post-socialist countries. This paper aims to fi ll this gap. We examine the correlation between growth and education with panel data evidence for 18 post-socialist (PS) countries and 16 devel- oped market economies (DME) over the 1990–2014 period. The goal of this paper is to test two hypotheses: (i) The relationship between GDP per capita and tertiary education’s enrolment rate is stronger in the post-socialist countries than in other countries. (ii) In the post-socialist countries, the relationship between GDP per capita and tertiary education’s enrolment rate is stronger than the re- lationship between GDP per capita and any other level of education. Correlation analyses confi rmed both hypotheses. Our fi ndings suggest that the patterns of relationship between GDP and measures of tertiary education are different for PS and DME countries and would be interesting to observe when and how the gap between the patterns disappears.
Keywords: education, economic wealth, European countries, post-socialist past, developed market economies, correlation
JEL classifi cation indices: I25, O57, P20
* This publication/research has been supported by the European Union and Hungary and co- financed by the European Social Fund through the project EFOP-3.6.2-16-2017-00017, titled “Sus- tainable, intelligent and inclusive regional and city models” and MTA-PE Budapest Ranking Re- search Group (Grant No. 16208).
Zsuzsanna Banász, Research Fellow at MTA-PE Budapest Ranking Research Group, Veszprém, Hungary. E-mail: banasz@gtk.uni-pannon.hu
Vivien Valéria Csányi, corresponding author. Assistant Research Fellow at MTA-PE Budapest Ranking Research Group, Veszprém, Hungary. E-mail: csanyivivien@gtk.uni-pannon.hu
1. INTRODUCTION
The investigation of the effects of education is a widely researched area. The rise of income inequality since the 1980s generates interest for research in the estimation of returns to schooling (see excellent reviews from Psacharopoulos 1985, 1994; Psacharopoulos – Patrinos 2004 and Gerber – Cheung 2008). Fur- thermore, it provokes further interest for investigating the cause of income dif- ferences across countries (see e.g. Filmer – Pritchett 1999 and Bergh – Fink 2008) since education is one of the key factors of economic growth and can in- fluence economic growth in different ways. The more the workers are educated, the more easily they learn new technologies, and thus, the more they promote in- novation. Additionally, education increases the productivity of workers. Recent studies suggest that differences in income across countries could be explained by the differences in cognitive skills (Hanushek 2016 and Hanushek – Woessmann 2010, 2012).
From the mid-18th century, economists started to investigate the possible causes and measuring tools of economic growth. According to Evsey Domar (1947) and Roy Harrod (1948), economic growth can be explained by the level of the pro- ductivity of capital. Robert M. Solow (1956) and Trevor W. Swan (1956) consid- ered savings as the main component of economic growth. Joseph A. Schumpeter (1980) thought that the element factor of growth is innovation and technological change.
In the following, only those theories are summarised in which human capi- tal is mentioned as the main component of economic growth. Sir William Petty (1676) was the first one who used the term ‘human capital’ and tried to deter- mine its value. Among the classical approaches, Adam Smith (1776) was the first who considered human capital as a part of capital assets. Ferenc Jánossy (1966) stated that the most essential part of growth is the structure of labour force by professions. Mankiw et al. (1992) added human capital accumulation to the Solow model and found that the augmented model could explain 80% of the cross-country differences in per capita income. They measured human capital ac- cumulation by the percentage of the working age (enrolled in secondary school) population. Maddison (1995) also confirmed human capital as one of the critical factors of economic growth and measured human capital as the weighted average of different levels of education.
The perception of the role and importance in post-socialist (PS) countries differed a lot from developed market economies (DME) and went through a significant change alongside the change of the system .
The paper is organized as follows. After the introduction, the literature review summarises previous analyses on the relationship between economic growth and
education. This is followed by a section where the motivation and the question of our research will be clarified, and the hypotheses will be formulated. Next section introduces the data and methods applied in this research. Finally, our results and conclusions are presented.
2. LITERATURE REVIEW
The literature on the contribution of education to economic wealth can be derived from the models of the 1960s. At that time the aggregate national production function was used, which depends on physical capital, labour, land and the time, which can serve as the measurement of technical changes. In this case, economic growth equals the different inputs’ cumulative effects. Studies carried out with this technique found that a significant proportion of the growth remained unex- plained; thus it was necessary to introduce new explanatory variables.
Based on US data between 1910 and 1960, Denison (1985) found that the unex- plained ‘significant part’ is 50% and assumed that education is the missing key com- ponent which could explain this part. Denison analysed 9 different versions of high- est educational qualification. The problem with his calculations was that he did not take into account that the quality of education can be different in time and places.
Schultz (1961) analysed U.S. statistics between 1929 and 1957. He calculated the income growth that was derived from the increased level of education. His results showed that the contribution of education to economic growth was between 36 and 70 per cent. The estimations of Denison and Schultz were criticised because their papers lacked the causal relations of education and economic growth. Furthermore, others, e.g. Balogh – Streeten (1967) stated that it would be necessary to decom- pose education according to its quality in different places. A few decades later, the real contribution of education could be calculated using this method (Varga 1998).
The estimates from the 1980s applied econometric techniques to determine the relationship between education and economic wealth (Hicks 1980; Wheeler 1980; Mingat – Tan 1996). Initially, the illiteracy rate was used as a proxy of education (Hicks 1980; Wheeler 1980). We focus on recent studies that used en- rolment ratios as a human capital proxy. In the past two decades, authors ap- plied modern econometric tools (e.g. two- or three-stage least squares, Granger causality tests) to determine the direction and the strength of the relationship between education and growth (Petrakis – Stamatakis 2002; Vu et al. 2012; Barro 2005, 2013; Ogunmuyiwa – Okuneye 2015). Typically, growth is measured by GDP or GDP per capita or the rate of GDP growth; and education is measured by the number of years spent in school (Pereira – St. Aubyn 2009), completion rate at different levels of education (Petrakis – Stamatakis 2002), or the number
or rate of enrolled students at three different (primary, secondary and tertiary) levels of education (Self – Grabowski 2004; Vu et al. 2012; Jalil – Idrees 2013).
Besides these quantitative indicators of education its qualitative measures are also important (Barro 2005, 2013). Akhmat et al. (2014) studied the relationship between educational indicators and research outcomes in those countries where the numbers of publications, citations and patents are the highest in the world.
They used panel cointegration technique for the period of 1980–2011. Ogun- muyiwa – Okuneye (2015) used a VAR-Granger causality approach to examine the direction and effect of tertiary enrolment on economic growth for the period of 1980–2010 in Nigeria.
Because we have noticed similarities in the enrolment rates and in economic growth of the PS countries, this paper focuses on these quantitative variables.
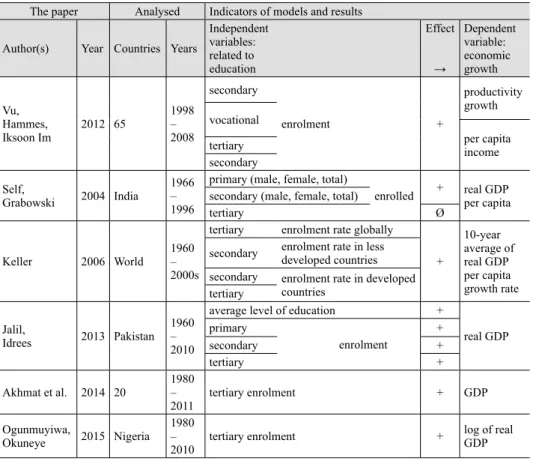
Table 1 summarises the results of the estimates considering enrolment rates as independent variables.
Table 1. Summary of some previous analyses The paper Analysed Indicators of models and results Author(s) Year Countries Years
Independent variables:
related to education
Effect
→
Dependent variable:
economic growth
Vu, Hammes, Iksoon Im
2012 65 1998
– 2008
secondary
enrolment +
productivity growth vocational
per capita income tertiary
secondary Self,
Grabowski 2004 India 1966 – 1996
primary (male, female, total)
enrolled + real GDP per capita secondary (male, female, total)
tertiary Ø
Keller 2006 World
1960 – 2000s
tertiary enrolment rate globally +
10-year average of real GDP per capita growth rate secondary enrolment rate in less
developed countries secondary enrolment rate in developed
countries tertiary
Jalil,
Idrees 2013 Pakistan 1960 – 2010
average level of education +
real GDP primary
enrolment
+
secondary +
tertiary +
Akhmat et al. 2014 20
1980 –
2011 tertiary enrolment + GDP
Ogunmuyiwa,
Okuneye 2015 Nigeria 1980 –
2010 tertiary enrolment + log of real
GDP Source: Authors’ compilation.
In few cases, the analyses concluded that education enrolment rate has no significant effect on economic growth, but most frequently, the results show a positive correlation between them. For example, examining annual real GDP per capita in India between years 1966 and 1996 the tertiary enrolment rates had no effect on them, but primary and secondary enrolment rates had a positive cor- relation on GDP (Self – Grabowski 2004). Several studies concluded that all three (primary, secondary and tertiary) levels of education had a positive effect on economic growth, e.g. in Pakistan during 1960–2010 (Jalil – Idrees 2013), or examining 65 countries during 1998–2008 (Vu et al. 2012). In the study of Mingat – Tan (1996), the proportion of participants in primary, secondary and tertiary education appeared as explanatory variables. Based on 113 countries data derived from years 1960 and 1985, the result of regression analyses showed that the participation rate of education in the year 1960 affected the future economic growth. Namely, if a country had 10 percentage points bigger participation rate in the primary education in 1960, it caused an annual average of 0.32 percentage point increase in growth rate of GDP per capita 1960–1985.
There were authors who analysed DMEs and developed countries (DCs) or less developed countries (LDCs) separately.
Landau (1986) investigated the impact of government expenditure on econom- ic growth on the sample of 65 LDCs for the period of 1960–1980. He examined – inter alia – the impact of public educational expenditure on GDP per capita growth; and for measuring human capital he used primary, secondary and terti- ary enrolment ratios. He found that the enrolment ratios are strongly correlated with growth rates, but there is no correlation between the levels of expenditure on education and growth.
O’Neill (1995) showed that the convergence in education levels can be ex- plained by the differences in income in the LDCs. He used gross secondary enrol- ment ratios to measure human capital and the logarithm of real per capita GDP.
He also stated that the relationship between education and income is causal from education to income.
Keller (2006) also used subsamples for DCs and LDCs and aimed to explore what kind of education investment has more effect on per capita growth. Her results show that tertiary enrolment rates affect growth globally. However, when only LDCs were taken into account secondary enrolment rates had the great- est effect. In the case of DCs, besides secondary enrolment rates, tertiary enrol- ment rates affect per capita GDP growth the most. Akhmat et al. (2014) found a positive relationship between enrolment ratios in higher education and GDP in 20 countries. In the case of Nigeria, Ogunmuyiwa – Okuneye (2015) also found a positive relationship between tertiary enrolment and economic growth.
Petrakis – Stamatakis (2002) analysed completion rates in 24 countries be- tween years 1970 and 1990, and their results showed that primary and secondary education influence growth in developing countries. This statement is also cor- rect in developed countries, but in such countries, tertiary education has a larger effect on economic growth.
3. MOTIVATION, RESEARCH QUESTION, HYPOTHESES
Despite the vast amount of papers investigating the relationship between educa- tion and growth, to the best of our knowledge, none of these studies examined a group of the PS countries comparing with the not-PS countries. This paper aims to fill this gap in the literature. A few of these studies pay attention to a PS coun- try individually, for example, Romania (Burja – Burja 2013; Dragoescu 2015), but these studies do not take into account the socialist past of the country. Both studies found that in Romania an increase in the number of students enrolled in tertiary education caused an increase in the GDP per capita or the rate of GDP growth. Popescu – Crenicean (2012) also examined the case of Romania, but their research focuses on the structural changes of the educational system and analyses the effect of these changes on economic growth. They analysed the cur- ricula of different educational institutions and found that there is a considerable interest in entrepreneurship education which can promote innovation in the edu- cational system.
Dombi (2013) investigated the sources of economic growth in ten Central Eastern European post-socialist countries (Bulgaria, Czech Republic, Estonia, Hungary, Latvia, Lithuania, Poland, Romania, Slovak Republic, Slovenia) and showed that the primary source of economic growth (app. 60%) was the accumu- lation of physical capital in the period of 1995 and 2007, and the impact of labour was marginal.
The motivation of our study came from two sources. First, we got inspiration from authors (O’Neill 1995; Petrakis – Stamatakis 2002; Keller 2006 and Dombi 2013) who separated developing and developed countries in order to diagnose the effect of development level on the correlation between economic wealth and education. This gave us the idea that it would be relevant to distinguish countries according to their socialist past. This interest has been strengthened by the fact that in our home country (Hungary), both GDP and the enrolment rate in tertiary education rose after the system changed (Figure 1). After the collapse of social- ism in 1989, the concerned countries have become more open in all areas, includ- ing the economy and higher education (Tomusk 2004; Hare – Lugachev 1999).
The availability of higher education has increased from elite to any social class.
That could be the reason why both GDP per capita and the enrolment rate in terti- ary education began to rise sharply after 1990 in post-socialist states.
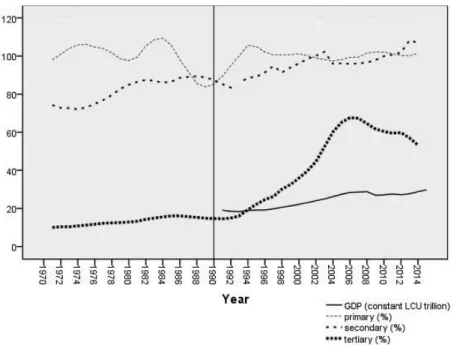
Figure 1 shows GDP (constant local currency in trillion) and gross enrolment ratios (%) of Hungary between years 1960 and 2014. The expression, ‘gross’
means that average and underage students are taken into account, too. For ex- ample, “gross enrolment ratio for tertiary school is calculated by dividing the number of students enrolled in tertiary education regardless of age by the popula- tion of the age group which officially corresponds to tertiary education” (World Bank 2017b). This may result in higher values than 100%. The vertical line in 1990 represents the change of regime from socialist to democratic. After this transition, the rising trend of GDP was accompanied by a highly rising trend of tertiary enrolment rate. Figure 1 does not show GDP per capita, but the shape of its curve would closely follow the GDP illustrated because the population of Hungary has not changed considerably over the examined period. The population was approximately 10 million people each year. (Over the period of 1960–2016, the mean was 10,292,310 people with a relative standard deviation of 2.5%). In the applied dataset of World Bank, Hungarian GDP data are not available be- fore 1991, similarly to other PS countries. Among the four curves of Figure 1, the tertiary enrolment ratio increased the most considering the entire period of
Figure 1. GDP and enrolment ratios of Hungary, 1971–2014
1971–2014, mostly after the change in the regime. According to Mihályi (2017), the reason for over-education experienced in the PS countries could be their uni- versities’ low tuition fees.
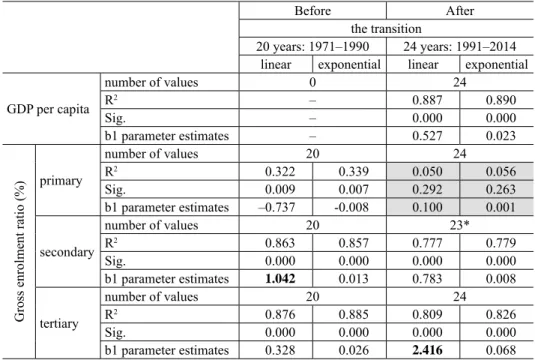
Based on the R2 values of Table 2, Hungary’s per capita GDP time-series after the transition is well described with a linear trend (R2=0.887) and exponential trend (R2=0.890), too. The b1 parameters of these trends mean that during period 1991–2014 Hungarian GDP increased by an annual average of 0.527 LCU, i.e.
1.023 times. After the transition, the tertiary enrolment ratios signed the most sig- nificant annual average increase among the enrolment rates. Comparing the two bold numbers of Table 2, it can be stated that the largest rise before transition was in secondary enrolment rate (annual average of 1.042 percentage points), but af- ter transition, it was in tertiary rate (annual average of 2.416 percentage points).
All these motivated the formulation of our research question: does the socialist past of a country relate to the relationship between education and GDP? Our two
Table 2. Trends of GDP and enrolment ratios of Hungary, before and after the transition
Before After
the transition
20 years: 1971–1990 24 years: 1991–2014
linear exponential linear exponential
GDP per capita
number of values 0 24
R2 – 0.887 0.890
Sig. – 0.000 0.000
b1 parameter estimates – 0.527 0.023
Gross enrolment ratio (%)
primary
number of values 20 24
R2 0.322 0.339 0.050 0.056
Sig. 0.009 0.007 0.292 0.263
b1 parameter estimates –0.737 -0.008 0.100 0.001
secondary
number of values 20 23*
R2 0.863 0.857 0.777 0.779
Sig. 0.000 0.000 0.000 0.000
b1 parameter estimates 1.042 0.013 0.783 0.008
tertiary
number of values 20 24
R2 0.876 0.885 0.809 0.826
Sig. 0.000 0.000 0.000 0.000
b1 parameter estimates 0.328 0.026 2.416 0.068 Notes:* data of year 1993 are missing. The largest annual average increases before and after the transition are in bold.
Not significant at level 0.05.
Source: Authors’ calculations.
associated hypotheses are: in the PS countries the relationship between GDP per capita and tertiary education’s enrolment rate is stronger
1. … than in DME countries.
2. … than the relationship between GDP per capita and enrolment in any other (primary, secondary) level of education.
4. DATABASE
As the first step, World Bank’s (2017a) GDP per capita (PPP, constant 2011 in- ternational $) and gross enrolment ratios in primary, secondary and tertiary edu- cation data were collected for all years (1960–2015). The analysis focused on Europe (to the eastern border of Russia). It is more efficient to compare countries with similar cultures. For example, Ethiopia is a PS country, like Hungary, but their comparability is not evident. Selection of years for the analysis was influ- enced by the fact that data are not available for the PS countries before the year 1990, neither in the dataset of World Bank nor in data of any other international organisation, e.g. Eurostat or OECD. At the time of writing this paper, the educa- tion data of the year 2015 have not been published yet. Because of these circum- stances, 24 years (1991–2014) were examined. Kosovo was ignored because their education data were missing.
In summary, the basis for investigations includes data on 24 years (1991–2014) of 34 (18 PS and 16 other) countries about the following:
– post-socialist past (Dummy variable: DME=0, PS=1), – GDP per capita (PPP, constant 2011 international $), – gross enrolment rates in primary education (%), – gross enrolment rates in secondary education (%), and – gross enrolment rates in tertiary education (%).
5. RESULTS
To determine the relationship between education and economic wealth, correla- tion analyses were carried out. More complex econometric models were carried out in many studies, but – according to our best knowledge – the relationship has not been studied yet in case of the whole European group of the PS coun- tries. Thus, the examination of our research question is related to initial analyses, namely the comparisons of correlations between indicators that were described in the hypotheses.
During the examination, one-year data of a country was considered as a case.
Table 3 summarises the significant linear Rvalues between GDP per capita and the three levels of education’s enrolment rates by countries. Cells marked with dashes represent non-significant outcomes at the 0.05 level.
The columns of Table 3 consider tertiary education as suitable for examining our first hypothesis, i.e. “in the PS countries the relationship between GDP per capita and tertiary education’s enrolment rate is stronger than in DME countries”.
All of the related R values are positive (higher GDP per capita is associated with a higher tertiary enrolment rate) and significant at level 0.001. All of the following statements confirm the first hypothesis.
Table 3. Linear correlation (R) between GDP per capita and education’s enrolment rates, 1991-2014
PS countries R of GDP & education
DME countries R of GDP & education
Pri. Sec. Ter. Pri. Sec. Ter.
1. Albania – 0.755 0.922 1. Austria –0.750 –0.799 0.777
2. Belarus – 0.916 0.972 2. Belgium 0.667 – 0.884
3. Bosnia and
Herzegovina – – 0.925 3. Denmark – 0.632 0.941
4. Bulgaria – – 0.879 4. Finland – – 0.954
5. Croatia 0.555 0.943 0.853 5. France – – 0.826
6. Czech Rep. – 0.671 0.983 6. Germany – – 0.941
7. Estonia – 0.793 0.904 7. Greece 0.630 – 0.678
8. Hungary – 0.781 0.974 8. Ireland 0.930 0.479 0.901
9. Latvia 0.568 0.907 0.791 9. Italy 0.773 0.793 0.830
10. Lithuania – 0.703 0.848 10. Netherlands 0.528 – 0.862
11. Macedonia –0.920 0.605 0.926 11. Norway – – 0.961
12. Moldova –0.601 0.828 0.701 12. Portugal – 0.544 0.887
13. Poland – 0.526 0.958 13. Spain – 0.514 0.814
14. Romania 0.427 0.888 0.950 14. Sweden – – 0.848
15. Serbia –0.686 – 0.941 15. Switzerland 0.582 – 0.959
16. Slovak Rep. – 0.693 0.986 16. UK – – 0.825
17. Slovenia – – 0.974
18. Ukraine –0.451 –0.581 0.630 Rate of
non-significant R 61% 22% 0% 56% 63% 0%
In absolute terms:
Mean 0.601 0.756 0.895 0.694 0.627 0.868
Median 0.568 0.768 0.926 0.667 0.588 0.873
Notes: The highest absolute value of R by country. Abbreviations: GDP: GDP per capita, Pri.: Primary, Sec.:
Secondary, Ter.: Tertiary. -: non-significant outcomes at the 0.05 level.
Source: Authors’ calculations.
The mean and median of individual countries’ absolute R values are bigger in case of PS countries than DMEs. (see the last rows of Table 3)
Considering the distribution of countries by the value of their absolute R, the percentage of countries with absolute R values more than 0.9 is bigger between PS countries (67%, i.e. 12 countries out of 18) than other countries (38%, i.e. six countries out of 16).
The second hypothesis is: “in the PS countries the relationship between GDP per capita and tertiary education’s enrolment rate is stronger than the relationship between GDP per capita and enrolment in any other (primary, secondary) level of education”. It could be examined from PS columns of Table 3. The grey cells highlight the level of education which correlates the strongest with economic growth. Following observations confirm the second hypothesis.
For most PS countries (15 out of 18), the tertiary enrolment rate correlates most with GDP per capita. There are three exceptions: Croatia, Latvia and Moldova, where the secondary enrolment rates have the most robust rela- tions with GDP per capita.
The non-significant results also favour the second hypothesis, since all cor- relations are significant between GDP per capita and tertiary education, but in case of the primary level, there are 11 non-significant results. Further- more, it can also be observed in 4 countries considering secondary level.
The mean and median of absolute R values of the PS countries (see the last rows of Table 3) support the second hypothesis, too, since tertiary education shows the most significant values in both descriptive statistics.
Though the second hypothesis deals with only PS countries, Table 3 shows a similar result for DMEs in the sense that only tertiary education enrolment rates are related to GDP significantly in each DME country. The correlations among GDP per capita and primary education are not significant in 9 countries. The en- rolment rates in secondary level and GDP per capita do not correlate significantly in 10 countries.
The average annual multiplier in indicators’ time-series was examined, too.
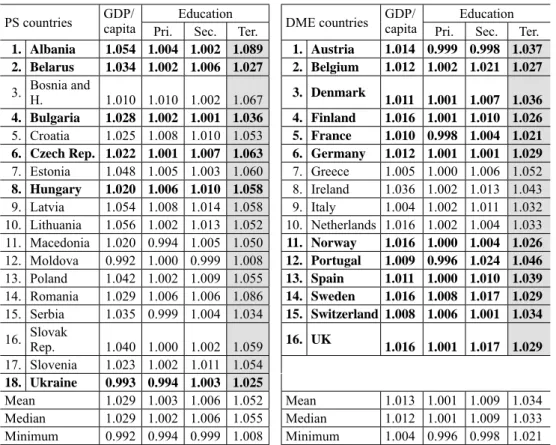
Table 4 shows these changes in average annual; i.e. how many times the variables have changed on average per year. For example, in Hungary, the annual average increase from 1991 to 2014 was 2 per cent in GDP per capita, 0.6 per cent in pri- mary enrolment rate, 1 per cent in secondary enrolment rate and 5.8 per cent in tertiary enrolment rate.
The grey cells of Table 4 highlight indicators which have the highest multiplier.
Among the four indicators, the enrolment rates of tertiary education increased the most on an annual average basis, in each country. There are only two countries (Moldova and Ukraine) where annual average of GDP per capita dropped, while the tertiary enrolment rate increased.
The examinations so far confirmed the hypotheses. The reason for this could be the fact that in the initial year of time interval of 1991–2014, the GDP per cap- ita was lower in PS economies than in DMEs. Figure 2 illustrates this. The hori- zontal axis measures initial development; the vertical axes measure the growth of four variables, i.e. the multipliers of Table 4. Focusing on the horizontal axis, it is spectacularly evident that the initial GDP per capita is lower in PS countries than DMEs. Figure 2.A represents that GDP per capita of the PS countries – which had lower initial development – increased on annual average more (1.029 times) than DME (1.013). Figure 2.B shows PS countries’ prosperous evolution in tertiary enrolment rate.
Table 4. Annual average multipliers of indicator’s time-series data PS countries GDP/
capita Education
DME countries GDP/
capita Education
Pri. Sec. Ter. Pri. Sec. Ter.
1. Albania 1.054 1.004 1.002 1.089 1. Austria 1.014 0.999 0.998 1.037 2. Belarus 1.034 1.002 1.006 1.027 2. Belgium 1.012 1.002 1.021 1.027 3. Bosnia and
H. 1.010 1.010 1.002 1.067 3. Denmark
1.011 1.001 1.007 1.036 4. Bulgaria 1.028 1.002 1.001 1.036 4. Finland 1.016 1.001 1.010 1.026 5. Croatia 1.025 1.008 1.010 1.053 5. France 1.010 0.998 1.004 1.021 6. Czech Rep. 1.022 1.001 1.007 1.063 6. Germany 1.012 1.001 1.001 1.029 7. Estonia 1.048 1.005 1.003 1.060 7. Greece 1.005 1.000 1.006 1.052 8. Hungary 1.020 1.006 1.010 1.058 8. Ireland 1.036 1.002 1.013 1.043 9. Latvia 1.054 1.008 1.014 1.058 9. Italy 1.004 1.002 1.011 1.032 10. Lithuania 1.056 1.002 1.013 1.052 10. Netherlands 1.016 1.002 1.004 1.033 11. Macedonia 1.020 0.994 1.005 1.050 11. Norway 1.016 1.000 1.004 1.026 12. Moldova 0.992 1.000 0.999 1.008 12. Portugal 1.009 0.996 1.024 1.046 13. Poland 1.042 1.002 1.009 1.055 13. Spain 1.011 1.000 1.010 1.039 14. Romania 1.029 1.006 1.006 1.086 14. Sweden 1.016 1.008 1.017 1.029 15. Serbia 1.035 0.999 1.004 1.034 15. Switzerland 1.008 1.006 1.001 1.034 16. Slovak
Rep. 1.040 1.000 1.002 1.059 16. UK
1.016 1.001 1.017 1.029 17. Slovenia 1.023 1.002 1.011 1.054
18. Ukraine 0.993 0.994 1.003 1.025
Mean 1.029 1.003 1.006 1.052 Mean 1.013 1.001 1.009 1.034
Median 1.029 1.002 1.006 1.055 Median 1.012 1.001 1.009 1.033 Minimum 0.992 0.994 0.999 1.008 Minimum 1.004 0.996 0.998 1.021 Notes: The highest multiplier by country. Bold means that data of years 1991 and 2014 are available, too.
Source: Authors’ calculations.
In the strict sense, only those countries of Table 4 could be compared for which the multipliers are based on the same years. The bold lines show the countries for which the first (1991) and the last (2014) year data of the researched time interval were available, too. Figure 3 shows countries of these years, considering GDP per capita and tertiary education’s enrolment (%). The PS countries’ GDP per capita was lower not only in the initial year but also in 2014.
Figure 2. Countries’ growth considering their initial development, 1991–2014
Figure 3. Countries’ GDP and tertiary enrolment rate, 1991 and 2014
In Figure 3.A, a vertical line can be drawn to separate the PS countries from the DMEs. It means that in 1991 there was a sharp boundary between the PS and the DME countries’ GDP per capita. In part B – exploring the year 2014 – only Portugal was the outlier among the DMEs based on their GDP per capita. Con- sidering the vertical axis, an important statement can be formulated. The scale of the vertical axis greatly changed. While in 1991 the tertiary enrolment rates were under 50% (see part A of Figure 3), by 2014 it rose to 40–90%. It means that the PS countries’ lag has declined. In summary, although GDP per capita in the PS countries was still lower than the same in the DME’s in 2014, their performance in the rate of tertiary enrolment almost approached that of the DME’s.
6. CONCLUSIONS
About the relationship between economic wealth and education, extensive litera- ture exists, but there are no works which compare the patterns of that relationship between the PS countries and the DMEs. Our aim was to fill in this gap. The study examined 34 European countries (from which 18 are PS) over the period of 1990–2014. We have shown that there is a significant difference in the pattern of the relationship between GDP per capita and enrolment rates for the two groups of countries. It is generally accepted that tertiary education is a key economic growth factor in the DMEs. In the PS countries the relationship is really strong.
Table 5. U21 ranking of the sample countries
Rank 2012 2017 Rank 2012 2017
1 Sweden Switzerland 15 Spain Czech Republic
2 Finland United Kingdom 16 Ukraine Portugal
3 Denmark Denmark 17 Czech Republic Italy
4 Switzerland Sweden 18 Poland Slovenia
5 Norway Netherlands 19 Slovenia Hungary
6 Netherlands Finland 20 Greece Poland
7 United Kingdom Austria 21 Italy Greece
8 Austria Belgium 22 Bulgaria Ukraine
9 Belgium Norway 23 Romania Slovakia
10 France Germany 24 Hungary Serbia*
11 Ireland Israel 25 Slovakia Croatia
12 Germany France 26 Croatia Romania
13 Israel Ireland 27 Bulgaria
14 Portugal Spain
Note: DMEs. Serbia have not been examined yet in 2012.
Source: Authors’ compilation based on Williams et al. (2012, 2017).
Still, based on our findings, and taking into consideration that we investigated a transitional period, it would be too early to claim that tertiary education already has the same role in the PS countries as in the DMEs. The significant markers are interesting and call for further investigation.
As a continuation of this study, several possible future research directions could be mentioned. One of these relates to the place of the PS countries in higher edu- cation rankings. There are not only university rankings (for example Academic Ranking of World Universities, The Times Higher Education World University Rankings and Quacquarelli Symonds World University Rankings), but also there is a ranking by countries’ whole higher education systems, e.g. the ranking of Universitas 21 (U21). It is based on numerous indicators from the field of higher education and was published for 48 countries at first in 2012, and it covers 50 by 2017. Table 5 shows the U21 ranking of the countries which are incorporated in our study.
It is interesting to note that the DMEs (with grey background) are at the top of the list, and the PS countries are at the end of it. This observation also suggests that it is worth considering countries with a post-socialist past separately in the analyses of higher education itself and its relationships to other social spheres.
REFERENCES
Akhmat, G. – Zaman, K – Shukui, T. – Javed, Y. – Khan, M. M. (2014): Relationship between Educational Indicators and Research Outcomes in a Panel of Top Twenty Nations: Windows of Opportunity. Journal of Informetrics, 8(2): 349–361.
Balogh, T. – Streeten, P. P. (1967): Tudatlanságunk koeffi ciense (The Coeffi cient of Our Ignorance).
In: Szakolczai, Gy. (ed.): A gazdasági növekedés feltételei (Conditions for Economic Growth).
Budapest: Közgazdasági és Jogi Könyvkiadó, pp, 364–372.
Barro, R. J. (2005): A gazdasági növekedést meghatározó tényezők (Determinants of Economic Growth). Budapest: Nemzeti Tankönyvkiadó Rt.
Barro, R. J. (2013): Education and Economic Growth. Annals of Economics and Finance, Society for AEF, 14(2): 301–328.
Bergh, A. – Fink, G. (2008): Higher Education Policy, Enrollment, and Income Inequality. Social Science Quarterly, 89(1): 217–235.
Burja, C. – Burja, V. (2013): Education’s Contribution to Sustainable Economic Growth in Romania . Procedia – Social and Behavioral Sciences, 81: 147–151.
Denison, E. F. (1985): Trends in American Economic Growth. Washington, D.C: The Brookings Institution.
Domar, E. D. (1947): Expansion and Employment. American Economic Review, 37(1): 34–55.
Dombi, Á. (2013): The Sources of Economic Growth and Relative Backwardness in the Central Eastern European Countries between 1995 and 2007. Post-Communist Economies, 25(4): 425–
447.
Dragoescu, R. M. (2015): Education as a Determinant of the Economic Growth. The Case of Ro- mania. Procedia – Social and Behavioral Sciences, 197: 404–412.
Filmer, D. – Pritchett, L. (1999): The Effect of Household Wealth on Educational Attainment: Evi- dence from 35 Countries. Population and Development Review, 25(1): 85–120.
Gerber, T. P. – Cheung, S. Y. (2008): Horizontal Stratifi cation in Postsecondary Education: Forms, Explanations, and Implications. Annual Review of Sociology, 34: 299–318.
Hanushek, E. A. (2016): Will More Higher Education Improve Economic Growth? Oxford Review of Economic Policy, 32(4): 538–552.
Hanushek, E. A. – Woessmann, L. (2010): Education and Economic Growth. In: Peterson, P. – Baker, E. – McGaw, B. (eds): International Encyclopedia of Education. Oxford: Elsevier, pp.
245–252.
Hanushek, E. A. – Woessmann, L. (2012): Do Better Schools Lead to More Growth? Cognitive Skills, Economic Outcomes, and Causation. Journal of Economic Growth, 17(4): 267–321.
Hare, P. – Lugachev, M. (1999): Higher Education in Transition to a Market Economy: Two Case Studies. Europe Asia Studies, 51(1): 101–122.
Harrod, R. F. (1948): Towards a Dynamic Economics. London: MacMillan.
Hicks, N. L. (1980): Economic Growth and Human Resources. World Bank Staff Working Paper, No. 408, Washington D. C.
Jalil, A. – Idrees, M. (2013): Modeling the Impact of Education on Economic Growth: Evidence from Aggregated and Disaggregated Time Series Data of Pakistan. Economic Modelling, 31:
383-388.
Jánossy, F. (1966): A gazdasági fejlődés trendvonala és a helyreállítási periódusok (Trend of Eco- nomic Development and Recovery Periods). Budapest: Közgazdasági és Jogi Könyvkiadó.
Keller, K. R. I. (2006): Investment in Primary, Secondary, and Higher Education and the Effects on Economic Growth. Contemporary Economic Policy, 24(1): 18–34.
KSH (2017): Hungary’s Gross Domestic Product (1960-1960 = 100). http://www.ksh.hu/docs/hun/
xstadat/xstadat_hosszu/h_qpt001.html
Landau, D. (1986): Government and Economic Growth in the Less Developed Countries: An Em- pirical Study for 1960–1980. Economic Development and Cultural Change, 35(1): 35–75.
Maddison, A. (1995): Monitoring the World Economy. Paris: OECD.
Malešević Perović, L. – Golem, S. – Mihaljević Kosor, M. (2018): The Impact of Education Ex- penditures on Growth in the EU28 – A Spatial Econometric Perspective. Acta Oeconomica, 68(2): 271–294.
Mankiw, N. G. – Romer, D. – Weil, D. E. (1992): A Contribution to the Empirics of Economic Growth. Quarterly Journal of Economics, 107(2): 407–437.
Mihályi, P. (2017): Learning, as a Wonder Weapon of Endogenous Growth? Discussion Papers of MTA KRTK KTI, No. MT-DP 2017/27. http://econ.core.hu/fi le/download/mtdp/MTDP1727.pdf Mingat, A. – Tan, J. P. (1996): The Full Social Returns to Education: Estimates Based on Countries’
Economic Growth Performance. Human Capital Development Working Papers, World Bank.
Ogunmuyiwa, M. S. – Okuneye, B. A. (2015): Does Tertiary Enrolment Cause Growth in Nigeria?
A Vector Auto Regression Mechanism. International Journal of Economics and Finance, 7(7):
131–137.
O’Neill, D. (1995): Education and Income Growth: Implications for Cross-Country Inequality.
Journal of Political Economy, 103(6): 1289–1301.
Psacharopoulos, G. (1985): Returns to Education: A Further International Update and Implications.
Journal of Human Resources, 20(4): 583–604.
Psacharopoulos, G. (1994): Returns to Investment in Education: A Global Update. World Develop- ment, 22(9): 1325–1343.
Psacharopoulos, G. – Patrinos, H. A. (2004): Returns to Investment in Education: A Further Update.
Education Economics, 12(2):111–134.
Pereira, J. – St. Aubyn, M. (2009): What Level of Education Matters Most for Growth? Evidence from Portugal. Economics of Education Review, 29: 67–73.
Petrakis, P. E. – Stamatakis, D. (2002): Growth and Educational Levels: A Comparative Analysis.
Economics of Education Review, 21: 513–521.
Petty, W. (1676): Political Arithmetic. In: Hull, C. (ed.): The Economic Writings of Sir William Petty. Vol. 1, Cambridge: Cambridge University Press, 1899.
Popescu, M. – Crenicean, L. C. (2012): Innovation and Change in Education – Economic Growth Goal in Romania in the Context of Knowledge-Based Economy. Procedia – Social and Behav- ioral Sciences, 46: 3982–3988.
Schultz, T. W. (1961): Education and Economic Growth. In: 60th Yearbook of the National Society for the Study of Education. Part II. Chicago: Univ. of Chicago Press, pp. 46–88.
Schumpeter, J. A. (1980): A gazdasági fejlődés elmélete (The Theory of Economic Development).
Budapest: Közgazdasági és Jogi Könyvkiadó.
Self, S. – Grabowski, R. (2004): Does Education at All Levels Cause Growth? India, a Case-Study.
Economics of Education Review, 23: 47–55.
Smith, A. (1776): An Inquiry into the Nature and Causes of the Wealth of Nations. London: Methuen and Co., Ltd.
Solow, R. M. (1956): A Contribution to the Theory of Economic Growth. Quarterly Journal of Economics, 70(1): 65–94.
Swan, T. W. (1956): Economic Growth and Capital Accumulation. Economic Record, 66: 334–
361.
Tomusk, V. (2004): The Open World and Closed Societies: Essays on Higher Education Policies
“in Transition”. New York & Basingstoke: Palgrave Macmillan.
Varga, J. (1998): Oktatás-gazdaságtan (Education-Economics). Budapest: Közgazdasági Szemle Alapítvány.
Vu, T. B. – Hammes, D. L. – Iksoon Im, E. (2012): Vocational or University Education? A New Look at Their Effects on Economic Growth. Economics Letters, 117: 426–428.
Wheeler, D. (1980): Human Resources Development and Economic Growth in Developing Coun- tries: A Simultaneous Model. World Bank Staff Working Paper, No. 407. Washington, D. C.
Williams, R. – Leahy, A. – Jensen, P. (2017): U21 Ranking of National Higher Education Sys- tems. Institute of Applied Economic and Social Research, University of Melbourne. http://www.
universitas21 .com/article/projects/details/153/executive-summary-and-full-2017-report Williams, R. – Rassenfosse, G. – Jensen, P. – Marginson, S. (2012): U21 Ranking of National
Higher Education Systems. Institute of Applied Economic and Social Research, University of Melbourne. http://www.universitas21.com/article/projects/details/190/2012-rankings
World Bank (2017a): World Development Indicators. http://databank.worldbank.org/data/reports.
aspx?source=world-development-indicators
World Bank (2017b): Gross Enrolment Ratio, Tertiary, Both Sexes (%), Details. http://data.
worldbank .org/indicator/SE.TER.ENRR