10/18/2018
Monitoring,
controlling and
analysing production processes from the
aspect of Industry 4.0
Thesis Booklet 2018
Attila Gludovátz
Supervisor: László Bacsárdi, PhD.
Cziráki József Doctoral School
Simonyi Karoly Faculty of Engineering, Wood Sciences and Applied Arts
Institute of Informatics and Economics
1
1. Introduction, motivations, the main questions of my research
The main goal is the effectiveness at a company, which works in the industrial sector. I supported to reach the management its target numbers in the way, that I solved problems in the production. I digitalized, automatized and optimized a multinational wood industrial company’s processes during my research, because the development of the production processes always needs the use of new and unique solutions. The given furniture company’s improvement was helped with using of different production management systems.
One of my main motivations was that I wanted to give useable results for the community of the computer and wood science too. This is an interdisciplinary area, which is unidentified for the researchers and there is not any dissertation in this science field. As a certified business informatics person one of my goals was, my work and my research have a direct impact on the life of the manufacturing company. The experts of the chosen firm can also confirm that the presented researches in my dissertation made more effective the operation of the chosen industrial firm. The completed optimization methodologies and steps, which I implemented in industrial environment bring concrete economic benefits to a company that plays a prominent role in innovation worldwide.
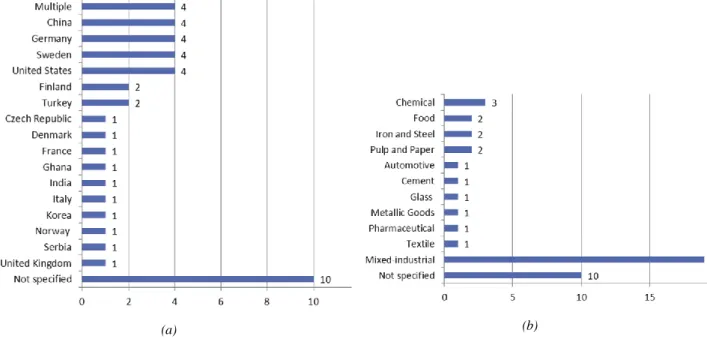
One of my other motivation was that a German-Swedish research team collected the publications from 1979 to 2014 in this subject and they determined that 44 scientific publications, which are related to the “energy management in the industry”, none of them related to the Hungarian Industry or the wood / furniture industry subject. The source of Figure 1 is available in that paper. On the left side of the figure can be found the number of publications by countries, on the left side of the figure, there are the publications by industrial sectors. Therefore, my research fills gaps in these scientific and industrial fields [1][2][3].
(a) (b)
Figure 1. The studies’ focuses from the viewpoint of countries (a) and industrial sectors (b) (1974-2014). (Source: [4])
2
In my dissertation, my solutions, results and methodology can be applied in another wood or furniture industrial companies. I’m able to accomplish further optimizations at another company with my research experiences.
First, I did the digitalization, automatization of the manufacturing processes, which connect to an integrated system of quality management. The core of the system is the smart camera, which works as a data source. It services the most important data about the quality measure of the shaved timber boards. In this section, first, I examined the natural colour of the wooden material, then the effects, which can modify the colour parameters of wood.
Regarding effectiveness of the production progress, I focused on the whole process of the production. Nowadays, the smart manufacturing is widespread. One of the main elements is the energy management subject. I had to know the hardware and software environment of the company for supporting the implementation of this unique energy management system. After that, the censors were put to the firm’s equipment, and the censors’ network works in the reliable way.
I’m collecting the energy consumption data into my designed database structure continuously.
Before the analysis, I initialize connection points between the energy consumption and the production data. The experts can define analysis plans with this cyber-physical integrated system. I support the decision-making progress with the assays, results and conclusions.
All in all, the company can reach a faster production process and a better quality of the products with the using of the system. Accordingly, the manufacturing will get more and more optimized and efficient. My main tasks and goals were the following:
1. To optimize the production process of a selected company with IoT1 tools.
2. To plan and implement an energy management and a building supervisory system in the company-level.
3. To determine the relationship between the production’s data and the energy consumption with the analysis in the given firm.
2. Research methodology
My methodology is based on the following parts and steps:
1. 1 The first and most important thing is that the company’s management makes a strategic decision, which contains the next answers for these questions: “In what do we want better than others?”, or “What process do we want develop and optimize?”
2. We have to get to know the selected process in-depth with data collecting:
a. To implement the data collectors (sensors) to the equipment OR in a special way, with the help of a smart camera, which delivers the signals, which can be transformed to digital data.
1 Internet of Things
3
b. To make a connection between the sensors and centre.
c. To store the incoming data into the database.
d. To gain the data from other source systems (optional step).
3. To analyse the raw data with visualization applications.
a. To discover the problems.
b. To correct the problems.
4. To analyse the data with mathematical, statistical, time-series and data mining techniques.
5. To present the results to the decision makers.
6. To make a decision for optimization.
7. To operate the system and supervise, control, analyse the processes all time.
I support these steps of my methodology with IT toolkits and techniques, besides, I introduced several examinations, which are connecting to the image- and video processing surveys. To gain the results, I applied mathematical, statistical and trend analysis methods. I used mathematical calculations to the raw data, when the calculated data are more useful than the original versions. In addition, the mathematical conversions were good to the data preparation process, in this way, I complemented the incomplete datarows. I applied the statistical methods to search and find correlation between the energy consumption and the production data. I wanted to discover problems by manufacturing process of a product or a machine in a selected time segment. In addition, I used the exponential regression technique to determine the trends behind the time- series data, and I made a forecast: a machine is consuming more and more energy time and time again. This process predicts that the machine will be faulty.
3. New results
3.1. Supporting quality management with automated processes
The wood industry is a typically traditional industrial sector, it contains lots of manual jobs and human resources. However, it will be able to change because of the digitalization of the industry. In these days, the Hungarian wood industry is very “fragmented”, and it has a lot of areas: sawmilling, furniture industry, builders’ joinery and carpentry services [5]. The percentages of the digitalization and automatization are very high in the wood industry of Western Europe. The process of the introduction of Industry 4.0 has already begun there. The sustainability of the competitiveness is very difficult in Hungary, because of the companies’ incomes are based on their export actions, thus the catch-up process is necessary in the field of Industry 4.0. The determination of the timber board’s colour is the most important step of the wood material processing. It decides the later processing steps and their additional materials, because the light and dark timber boards must be handled in different ways. Added to this the furniture companies’ high-quality guarantee.
The first important thing of the research is the consistent handling of the colour measuring by the smart camera system. I had to add some describing data to the colour data (e.g., date, time, supplier, shift etc.).
4
In the beginning, I had to know the base system at the company (see on the left side of Figure 3).
This system contains a lot of defects. There were only two-colour types of timber boards. There was no decision support process, and the configuration of machines was very difficult. Now, a system with those disadvantages cannot be useable, therefore, a new extended system has to be implemented.
The goal was that the timber batches can be controlled all the time during the production process.
I defined the process, with which the controller person can modify the processing parameters and the process description data will be stored in the database. After this phase, the collected data can be analysed locally with the management information system’s report generator subsystem. There is the process of the quality measuring of timber boards (see Figure 2) in the extended system, on the right side of Figure 3, we can see the extended system’s architecture.
Figure 2. The timber boards’ processing and quality controlling tasks before and after the shaving. (Translation of the figure:
1. Reading barcode, 2a. Getting the identifier of delivery, 2b. Getting the type wood, 3. Pre-shaving, 4. Colour measuring, 5. Barrier signal, 6. Printing, 7. Selection)
I upload the data into the database, these data are collected by the extended system. After that, I can begin to make analysis in my integrated system. In details, first, the signals are measured, then I collect the converted data, which come from heterogeneous sources. After the conversion, there are the cleaning process of raw data, it means, that the noizes and the gaps are gone. The managers of the company are interested in the ranking of suppliers. Besides, I made several examinations with data, for example, the sets of colours or frequency, and I made simulations related to the random failures etc.
In the following years, a need has been appeared at the company, that was the changing of the software core of the smart camera. This solution analysed the colour of the wood material.
Therefore, I get to know the natural colour of woods, and their influential factors [6][7][8][9][10].
5
In the following, I got to know such applications, with which help the progress of computer vision, image and video processing in real time. My choice was the OpenCV library, which is an open source programmable function set [11]. With this library, I defined my methodology, so I terminated the colour of the timber boards in pictures, then in videos. My dissertation contains every image processing analysis, which are related to the wood colours and failures. My statement was the following: the colour processing results are the same in the cases of image and video, thus my software’s colour measuring is consistent and reliable. There was no necessary in the case of video, to that I had to determine the precise colour values of timber boards, because the most important thing was that the proportions had the same in every cases of woods (image colour value / video colour value). The dark wood materials always have to be dark, and the light wood materials always have to be light, this was the main requirement. I have proved this statement in my dissertation with three sample wood materials’ images and videos (see Table 1). On the base of my results, my software and hardware system’s video processing solution can work in another industrial company’s environment.
Table 1. An overview about the colour analysis (image and video processing) of timber boards
Results of image processing (RGB and %) Results of video processing (RGB and %) Image 1. Image 2. Image 3. Video 1. Video 2. Video 3.
141,36 150,46 139,23 66,22 70,08 63,38
Colour ratio (image/video %): 46,84% 46,58% 45,52%
Total: 431,05 and the ratio values: Total: 199,68 and the ratio values:
32,79% 34,91% 32,30% 33,16% 35,10% 31,74%
Thesisgroup 1. According to my own researches, the industrial development has made more efficient the shaving as a production sub-process at the given furniture company. The developments are well adapted in the operation of other manufacturing companies.
Figure 3. The base- (left) and the extended systems’ (right) elements
6
Thesis 1.1. During the research I established a framework that supports the real production process using the standards and recommendations of Industry 4.0. The framework is capable to solve control, optimization and other decision support tasks in the furniture industry environment.
Thesis 1.2. Applying industrial digitalization solutions, I have successfully established the framework to the examination of the shaving quality. The efficiency of production has proven increased to the effect of the automated quality control process that was formed by the result of the development.
Thesis 1.3. With the help of collected data from the production processes, I made analysis about the color of the wood, which helped to establish the supplier selection strategy.
Related publications2:
Journal article(s) in English: [J1].
Conference article(s) in English (abstracts, presentations, papers): [C1], [C2], [C3], [C4].
Conference article(s) in Hungarian (abstracts, presentations, papers): [C7].
3.2. Integration of the energy consumption and the production data
The analysis of this section was taken at the same furniture industrial company, then the earlier quality measuring examinations. Without the success of this cooperation, I would not have been any chance to make such a big process development. In this section, I demonstrate a solution of a problem, which is cross-departments at the company. With the help of my integrated systems, I guarantee a secure access to the data, which come from different sources, but they are consistent and valid. I designed a database structure, which can store lots of data types, for example, energy consumption data, temperature data, because they are numerical data and their descriptions (equipment, parameters, measures) can be configured. If the company’s experts want to store new data, they do not have any programming tasks, but only data rows’ initialization tasks. When I established the base of my system, I checked its performance parameters, so that the queries’
execution time do not take too long. That’s way, I used several query-optimization techniques. From the viewpoint of the security, my system and its services are running in the company’s own network (I’m not using external or cloud services), so the availability and the safety are supported by the company’s IT professionals.
First, I got to know the company’s base processes, hardware and software environment to do any kind of development in the company’s life. The energy consumption of the production machines could be broadly constant, but it needs to be considered that the firm produces approximately 1500 products.
I introduced a general production process through the manufacture of a veneered product. I assigned to the part processes that which production machine does it. I got a line on the data, which were measured in connection with production at the company. In brief, before the installation of my framework the company knew only one data in reference to the energy consumption daily.
When the framework was designed a set of machines was selected, which they wanted to measure definitely at the company, but at the same time this set of machines was different volume in terms
2 C = Conference abstract, presentation or full paper; J = Journal article; The references can be found in the section 6.
7
of consumption. The manufacturing machines were equipped with smart measuring instruments, with which the energy consumption was measured.
The measuring instruments were installed into a new computer subnet at the company, so that they cannot disturb the other communications. The data can be tracked and traced with the help of the applied supervisory system at the company, however there was no possibilities to drill down in the dataset at a deeper level. Because of it the measured parameters (for example: the machines’
energy consumption) were saved in an external database with the help of periodical incremental backups. In this database I designed a universal data structure, in which any numerical data can be stored with their descriptive parameters. At the same time, I got to know and selected the data, which were required from the company’s ERP3 system.
The goal was that these production data had to been joined the energy consumption data. The connection points were the fact data’s timestamps and the identifiers of machines. At the beginning of the research, I defined a 10-minute time period when the data had to measure and come. So, one energy data row generated in every 10 minutes to every examined machine, that process was an incremental saving. But the frequencies of production data were different: there were more data row in a 10-minute period. To join these datasets, I had to make several summarizing (production) and rounding (production and energy consumption) transformations on the datasets. The joins of datasets were made by a business intelligence tool (with SQL scripts). In this way, the necessary joined datasets (production and energy consumption data) are available for monitoring and analysing. The configuration of the system is well-manageable, there is no need high level IT knowledge. Since the installation of the system, the company’s specialists did not only measure the electricity energy consumption, but the company’s thermal and water energy requirements. In the next figure (Figure 4) can be seen the cyber-physical system, with which the production and energy consumption data can be measured and stored. The figure shows the signals’ and data flows bottom-up approach.
Thesisgroup 2. I configured a universally applicable database structure to store the energy consumption data, which were collected in the firm, furthermore I made it possible that these data series are joined with the production data.
Thesis 2.1. I created a universally usable database structure, in which can be loaded the consumption data from any sensors. I planned and implemented the physical and software environment of my self-developed framework. With this innovation I achieved that there is no need for further IT development tasks to store new data.
Thesis 2.2. I joined the energy management data with the production data of the company (product, produced quantities, shift data, machine settings). This established system was capable for I could consistently analyse the collected and interconnected data sets.
3 Enterprise Resource Planning system
8
Figure 4. Cyber-physical framework’s architecture and dataflows.
Related publications:
Journal article(s) in English: [J2], [J3].
Conference article(s) in English (abstracts, presentations, papers): [C5].
Conference article(s) in Hungarian (abstracts, presentations, papers): [C8].
3.3. Energy efficiency analysis
In this section, I represent the capabilities of my system, which I introduced in the latest subsection.
The manager of this system is able to support the decision-making processes of the production and thereby the company can reach more effective levels in its operation. For optimal decision supporting there is indispensable that I have to get valuable results from data, so I get answers for my earlier questions or hypothesis. The problem types or questions can be divided into two different sets. The first group focuses on the manufacturing machines and their energy consumption and productivity. The second group focuses on the other equipment of the factory and their energy consumption. In the first group, I analysed the relationships and correlations of those data, in the second group, I examined the forecasting and prediction of the time-series data. In the journal papers of this scientific theme, I did not find any paper, which analyses the connection of the energy management and the production productivity. Most of the papers are concentrating only to the industrial energy management. I’m interested in that question, when the machines’ idle time statuses were and how they could get to a lower level. To answer this question, I reviewed the machines’ possible statuses and identified those ones which were useless. It would be important to eliminate these statuses. For this reason, I had to create reports, which represent the machines’
productivity and energy consumption in a given term.
9
Figure 5. The performance of the shaving machine via my system: the dates of the economy year can be seen on the horizontal axis, the kWh energy consumptions are on the left vertical axis (green columns = useful, red columns = useless energy consumption), the
numbers of manufactured products are on the right vertical axis (blue line series).
Regarding the shaving (or plant) machine can be determined that it got into the sets of measured equipment group, and it works in the level of relatively good effectiveness (Figure 5). With the help of the two types of vertical axes the energy consumption and the produced number of pieces have been assigned within a chart.
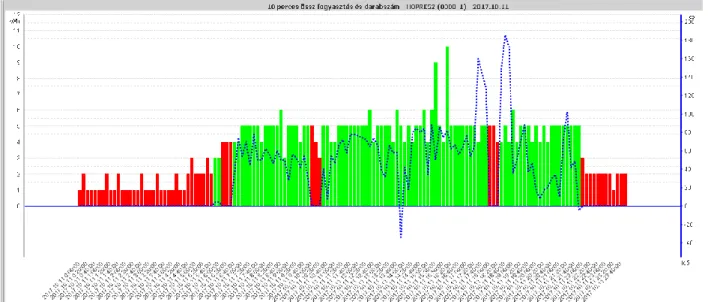
In the detailed chart (Figure 6) we can see that the machine was left in standby mode during the night, and the machine consumed 1-2 kWh every 10 minutes. At the beginning of the morning shift some workpiece were made with the machine, and during this shift the workers continuously produced, but they had a break (from 10:00 to 10:20) when they stopped the production. We can see that they did not put the machine in standby mode to consume less, they just left it during its operation.
Figure 6. The daily performance of the manufacturing machines (heat press) on 11/11/2017: on the horizontal axis we can see the 10 minutes of the day. The left vertical axis shows the kWh consumption (the green bar chart shows the useful energy consumption and the red bars or partial bars show the useless energy consumption). The chart shows the produced number of pieces on the right
vertical axis, this belongs to the blue line diagram.
10
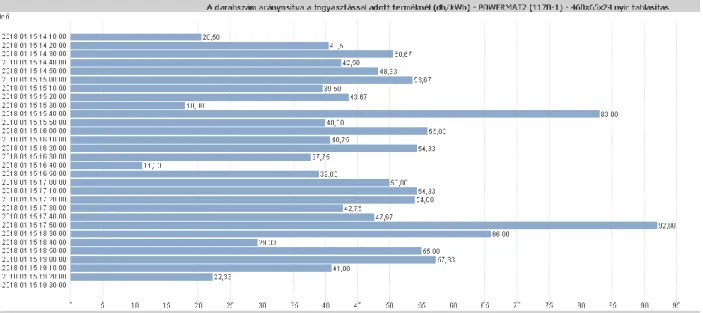
We can see that the production output was variable at the machine next to the energy consumption and because of it I refer to the next figure that shows a key indicator, the “Comparison 1. (number of pieces/kWh)”. This indicator shows after the consumption of given kWh, how many production numbers can be produced by the machine (Figure 7).
Figure 7. Production efficiency of a given product and machine. The horizontal axis shows the values of “Comparison 1. (number of pieces/kWh)”. The vertical axis shows the dates when the given product has been produced.
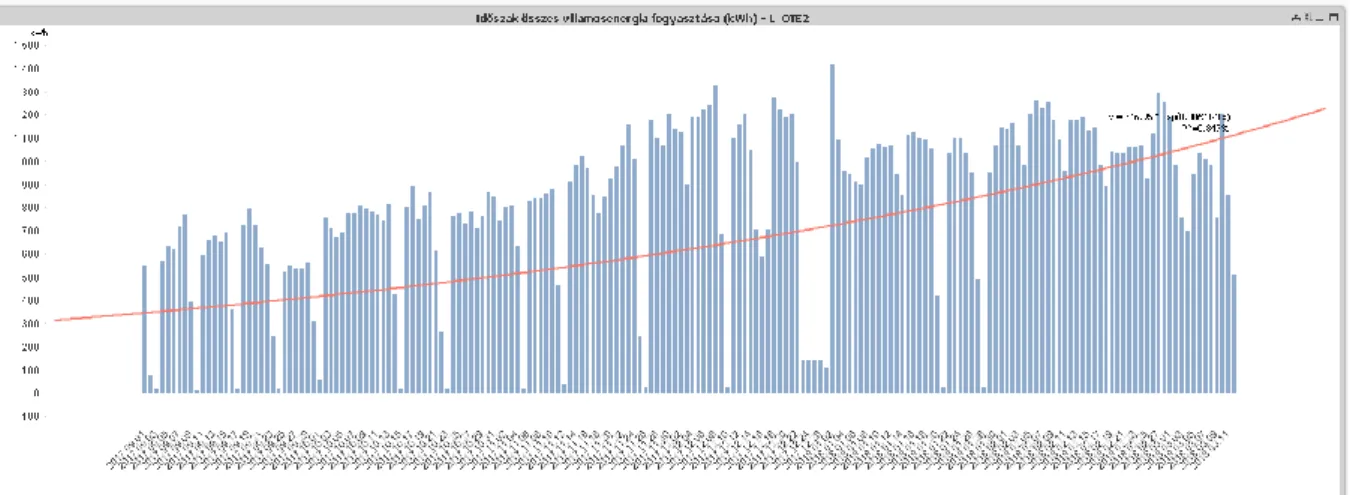
I was curious during the searching of relationships and investigations that I can predict the breakdown of a given machine. I defined the process of the breakdown that an examined machine takes up more energy to the transmission of the same power. During the monitoring I found out that the OTE2 compressor consumed more kWh electricity energy during the operation of my framework as time goes by. I performed the trend calculation with the help of exponential regression. The number of monitoring in the regression statistic was 26 666 [12]. I did not find any shortage during the fitting shortage test, that’s why I can continue my work with the calculation of the determinant coefficients. From my calculation I got as a result R2=0,84731, which points a high- level connection, because the value of R2 is had a negative influence by the increase of the sample size according to the experiences. I highlight, that the ~0,85 value is more than perfect in case of such a big data set. After that, the “best” equation of the regression parabola is the following: 𝑦̂ = 346,95 ∗ 0,006262𝑥. As my example illustrate in practice on the horizontal axis there is a daily rating, because of it the energy consumption of the machine increases by 0,62% a day (see Figure 8).
11
Figure 8. OTE2 equipment’s daily energy consumption data and its trendline from September to March (2017-2018)
Thesisgroup 3. I created a valuable business intelligence system with the analysis of the energy management data, which is capable to make more accurate budget plans and it can plan the future maintenance works and required developments.
Thesis 3.1. I made energy efficiency examinations with the help of the retrieval data from the industrial environment. I proposed using the results of the analysis that what kind of machine settings need to reach the optimum operation in the production.
Thesis 3.2. I facilitated with the usage of data collecting and processing that the company can create more accurate annual budget plans.
Related publications:
Journal article(s) in English: [J4].
Conference article(s) in English (abstracts, presentations, papers): [C6].
4. The applicability’s possibilities of my new results
In this section, I examined the thesis groups and their parts’ expediency in many ways.
Expedience of Thesisgroup 1. (Thesis 1.1., 1.2., 1.3.)
During my researches I got in touch with several wood industrial companies and I experienced that their IT applications were primitive (Microsoft Excel).
It was typical of all of them that the company’s managers did not know some important information in connection with the process data of the firm. They could get information only about the input and output. That’s why it is definitely justified to install a new and more developed system that can digitize and automate the firm’s production processes. Before my researches and our cooperation, the management could not afford the development (because of the time and costs).
Wood is a special material in terms of color and its treatment. In may cases the companies needed a color analysis application with which can analyse the wood materials, but this application was
12
missing in their software and hardware environment too. In my opinion it would be necessary to install a product tracking system at the firms considering the opportunities of Industry 4.0.
Expedience of Thesisgroup 2. (Thesis 2.1., 2.2.)
The above-mentioned installation of systems would be useful not only the wood industry companies, but other industrial and manufacturing companies.
To compare the production data with the energy consumption data would be indispensable for every manufacturing company.
I presented a general process that is required for the mentioned new system via a cyber-physical infrastructure. It can be applicable at other companies even if they have different machines or manager softwares.
Expedience of Thesisgroup 3. (Thesis 3.1., 3.2.)
Data-based information and knowledge retrieval could be practically a potential solution for the internal problems of every small and medium-sized enterprises.
The management decision-making has become easier because of the result of the analysis and it can operate similarly in case of other companies. It can bring a number of advantages for a producing company if they can analyse and collect data from the internal processes and the management can compare them with other processes and with the external market conditions.
5. Conclusion
I configured a framework at a furniture manufacturing company with its help I could implement the production control and management. For this, first I got to know the physical and software toolkit of the firm because the company would like to use only its own software tools to reach more efficient operation. Because of it I implemented an extended solution compared to basic system that the company used. With this configuration the data collection, correction and their analysis were becoming possible.
One of the parts of the framework is the image and video processing application which needed development, that’s why I learned the natural color of the wood materials and what kind of factors influence them. After it I created an image and video processing application, which can define the color of the wood - mainly related to each other - and the wood anomalies. I tested the image analysis software in different operating system environment because of achieving faster response time.
In the following, I laid the foundation of the whole energy management of the industrial company.
To do this, I needed to know the conceptual designing and deficiency of the currently operating system, and I had to identify those areas where the development can be feasible. At the beginning I assessed the equipment set required for the tests in the firms, and I reviewed a typical manufacturing process in connection with the machines within the firm. The next step was to install
13
the physical toolkit for the equipments with the help of the smart measuring tools. It was important to expand the network topology in the firms in order to be available every measuring tools in terms of data collection. After switching on the network, it became possible to define and start using the data collection and rescue process of the supervisory system. After the data transmission the data got into the universal database I created, in which many different numerical data can be stored that the production managers want to measure in connection with manufacturing. Beside this I used the supervisory system as a data source and I collected from it the important production data, for example which machine how many quantities could produce from each product. After the data joins the production managers can get information from the business intelligence application about the state of production in forms of different reports. In the future the expansion of the system will no need IT knowledge, the production controllers can expand the system if it is necessary.
I made different analysis, their reports and statements with the help of business intelligence system beside the live system when it has already delivered the data into my database. All of them contained important information for the company’s management and they could make more effective decisions in connection of production management.
I had to prepare the system for the changes which can appear during the task in the factory, for example, when the version of the supervisory system was updated (including its internal data tables and columns too). The development is continuous, but the production managers can make more optimal and efficient decisions with the help of the framework I developed at the given company.
6. List of publications
Journal articles in English
[J1] A. Gludovátz, L. Bacsárdi: „IT Challenges of a Production System”, SEFBIS JOURNAL 2016 (10), pp. 32-40.
[J2] Z. Pödör, A. Gludovátz, L. Bacsárdi, I. Erdei, F. N. Janky: „Industrial IoT techniques and solutions in wood industrial manufactures”, Infocommunications Journal, Volume IX, Issue 4, 2017, pp. 24-30.
[J3] A. Gludovátz, L. Bacsárdi: „Industry 4.0 projects’ background: Experiences at the wood industrial manufactories”, SEFBIS JOURNAL 2017 (11), pp. 34-41.
[J4] A. Gludovátz, L. Bacsárdi: „The connection of the production and the energy usage in a smart factory”, SEFBIS JOURNAL 2018 (12), pp. 60-69.
Conference articles in English (abstracts, presentations, papers)
[C1] G. Bencsik, A. Gludovátz, L. Jereb: „Adaptation of analysis framework to industry related economic problems”, The Impact of Urbanization, Industrial and Agricultural Technologies on the Natural Environment: International Scientific Conference on Sustainable Development and Ecological Footprint, Sopron, 2012, pp. 6.
[C2] G. Bencsik, A. Gludovátz: „Adaptation of a universal decision support system in forestry”, Implementation of DSS tools into the forestry practise, Zvolen, Szlovákia, 2013. pp. 37-49.
14
[C3] A. Gludovátz, G. Bencsik, L. Bacsárdi: „IT Challenges of a Production System”, Országos Gazdaságinformatikai Konferencia, Veszprém, 2015, pp. 31.
[C4] A. Gludovátz, L. Bacsárdi: „Production Related IT Solutions in the Operation of Factories”, 17th IEEE International Symposium on Computational Intelligence and Informatics, 17-19. November 2016, Budapest, Hungary, pp. 187-191.
[C5] A. Gludovátz, L. Bacsárdi: „The 4th industrial revolution's challenges at the wood industrial manufactories”, XIII. OGIK Gazdaságinformatikai Konferencia, Dunaújváros, 2016, pp. 15-17.
[C6] A. Gludovátz, L. Bacsárdi: „The connection of the production and the energy usage in a smart factory”, OGIK'2017 Országos Gazdaságinformatikai Konferencia, Sopron, 2017, pp. 40-42.
Conference articles in Hungarian (papers)
[C7] Gludovátz A., Bacsárdi L.: „Termelésinformatikai eszközök hazai gyárak működésében”, Informatika a felsőoktatásban 2014. konferencia, Debrecen, 2014, pp. 278-286.
[C8] Gludovátz A., Bacsárdi L.: „Ipar 4.0 ajánlásait támogató mintarendszer kiépítése egy bútoripari vállalatnál”, Informatika a felsőoktatásban konferencia, Debrecen, 2017. augusztus 29-31., pp. 341- 352.
Other publications
[C9] Gludovátz A., Bencsik G.: „Egy felsőoktatási képzés Balanced Scorecard alapú mintarendszer működésének demonstrálása”, 5. Nemzetközi Gazdaságinformatikai Konferencia (ISBIS'2007), Magyarország, 2007.11.09-10. Győr: p. 88.
[C10] Gludovátz A.: „Erdészeti döntéstámogatás Magyarországon”, NyME FMK doktoranduszi minikonferencia, 2010 június 4.
[C11] A. Gludovátz, M. Edelényi, G. Bencsik: „Adaptation possibilities of knowledge management tools in higher education”, Szellemi tőke, mint versenyelőny avagy A tudásmenedzsment szerepe a versenyképességben, Komarno, Szlovákia, 2010, pp. 883-897.
[C12] Bencsik G., Gludovátz A., Bacsárdi L.: „Tudásmenedzsment módszerek faipari alkalmazása”, Inno Lignum kiállítás, Sopron, 2010.
[C13] Gludovátz A.: „Integrált informatikai elemző keretrendszer alkalmazása interdiszciplináris környezetben”, Doktoranduszi konferencia, absztrakt, Sopron, 2011.
[C14] Bencsik G., Gludovátz A., Jereb L.: „Integrált informatikai elemző keretrendszer alkalmazása a magyar felsőoktatásban”, Informatika a felsőoktatásban 2011 konferencia, Debrecen, pp. 1040- 1047.
[C15] Gludovátz A., Jereb L.: „Univerzális elemző keretrendszer gazdasági alkalmazása”, Doktoranduszi konferencia, Sopron, 2012.
[C16] G. Bencsik, A. Gludovátz, L. Jereb: „Decision support framework with wood industrial application”, Eight International PhD & DLA Symposium: Architectural, engineering and information sciences, Pécs, 2012, pp. 30.
[C17] G. Bencsik, A. Gludovátz: „Experience with universal data analyses”, Umeå, Svédország, előadás, 2013.
15
7. References
[1] E. Cagno, A. Trianni: „Exploring drivers for energy efficiency within small- and medium-sized enterprises: First evidences from Italian manufacturing enterprises”, Applied Energy, Volume 104, 2013, pp. 276-285, ISSN 0306-2619.
[2] L. B. Christoffersen, A. Larsen, M. Togeby: „Empirical analysis of energy management in Danish industry”, Journal of Cleaner Production 14, 2006, pp. 516-526.
[3] P. Thollander, M. Ottosson: „Energy management practices in Swedish energy-intensive industries”, Journal of Cleaner Production 18, 2010, pp. 1125-1133.
[4] M. Schulze, H. Nehler, M. Ottosson, P. Thollander: „Energy management in industry - a systematic review of previous findings and an integrative conceptual framework”, Journal of Cleaner Production 112, 2016, pp. 3692-3708.
[5] Alpár T.: „Gyártásszervezés támogatása a faiparban”, IOT4U konferencia előadás, Budapest, 2016. december 6.
[6] Tolvaj L.: A faanyag optikai tulajdonságai. Nyugat-magyarországi Egyetem Kiadó, Sopron, 2013.
[7] Molnár S.: „Faanyagismeret”, Mezőgazdasági Szaktudás Kiadó, Budapest, 1999.
[8] Németh K.: „A faanyag degradációja”, Mezőgazdasági Szaktudás Kiadó, 1998.
[9] Ábrahám Gy., Wenzelné Gerőfy K., Antal Á., Kovács G.: „Műszaki optika”, BME MOGI Kiadó, 2015.
[10] Persze L.: „A fotodegradációs folyamat színváltoztató hatása a bútoriparban felhasználható faanyagoknál”, doktori disszertáció, Sopron, 2014.
[11] G. Bradski, A. Kaehler: „Learning OpenCV: Computer vision with the OpenCV library”, O’Reilly Media Inc., 2008.
[12] Lukács O.: „Matematikai statisztika”, Műszaki Könyvkiadó, Budapest, 1996.