DOI: 10.32565/aarms.2019.2.10
Experimental Investigation and Statistical Analysis for Spallation Characteristics of Ballistic
Penetration
1József GYARMATI
2– Péter ZENTAY
3– György GÁVAY
4– Ferenc HAJDÚ
5The paper discusses a new experimental investigation and analysis method conducted in the field of terminal ballistics based on shooting experiments. The shooting was performed with the aim of determining the geometry of the spall cone caused by the spallation on both sides of the target armour plate when a bullet is penetrating through it. During the measurement, armour plates made of different materials with different thickness were shot through using different bullets. The influence of the armour material type and its thickness on the spall generation was examined.
Keywords: armour penetration, armour piercing bullet, spall cone geometry, experimental terminal ballistics, statistical analysis
Introduction
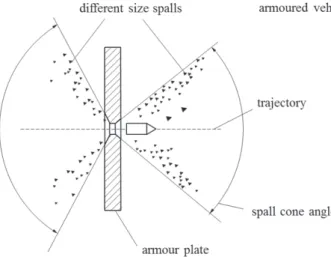
A bullet penetrating through the armour plate brakes out spalls (small material fragments) from the plate. The shape, size and quantity of the spalls depend on the material and thickness of the plate, as well as the material, construction and velocity of the bullet. [1] [2]
When a bullet is shot through the armour plate, a spall cone is created on both sides of the plate. (Figure 1.) This cone mainly consists of the material of the armour plate. [3] [4]
1 This research was supported by the Defense Economic Office, Ministry of Defense of Hungary.
2 Associate Professor, National University of Public Service; e-mail: gyarmati.jozsef@uni-nke.hu; ORCID:
0000-0001-7594-2383
3 Associate Professor, Budapest University of Technology and Economics; e-mail: zentay@manuf.bme.hu;
ORCID: 0000-0001-7594-2383
4 Assistant, National University of Public Service; e-mail: gavay.gyorgy@uni-nke.hu; ORCID: 0000-0003- 0632-5650
5 Lecturer, National University of Public Service; e-mail: hajdu.ferenc@uni-nke.hu; ORCID: 0000-0003-0449-
Figure 1. Spall cone.
[Edited by the authors.]
Spall liners are used inside some modern fighting vehicles to protect the crew or to decrease the injury caused by these spalls. [5] The spalls can injure the personnel inside the vehicle, but can also harm persons that are outside. To protect the personnel against this phenomenon, it is necessary to know the characteristics of the spall cone, including the description of the geometry and spall distribution.
This paper presents a method for determining the geometry of spall cones for two different armour plates shot with two different types of bullets. Spall cones have already been investigated with a high speed video camera [6] and X-ray [4] but a different method was chosen in this paper. With this method, the path of every spall can be determined.
The basic arrangement of the test is that a cardboard box is attached to the armour plate on which the spalls pierce holes. From this, coordinates of the holes and the angles of the spall paths can be calculated.
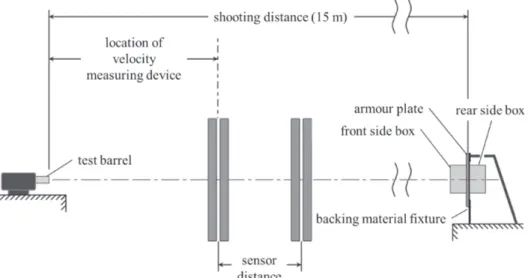
The schematic of the setup of the experiment is illustrated in Figure 2. The principle of the test is not entirely new, paper [7] describes a similar method for determining the fragment mass distribution of an explosive charge using witness plates.
Figure 2. Schematic setup of the experimental shooting.
(Based on the test range configuration of the Ballistic resistance of body armour NIJ Standard 0101.06 [8].)
The shooting was carried out in an indoor shooting range. The distance between the armour plates and the muzzle of the ballistic test barrels was constant during the whole test. The velocities of the bullets were measured by an electro-optical measuring system. During the research, the following values and distribution was measured and calculated: (according to Figure 3) the angles of spalls perpendicular to the armour (α) and their distribution, and the angles of spalls parallel to the armour (in the plain of the armour) (φ) and their distribution.
The measurements were performed on both sides of the armour plate.
The shooting was performed in three, five-shot series. To measure the spall path, two cardboard boxes were attached on both sides of the armour plate.
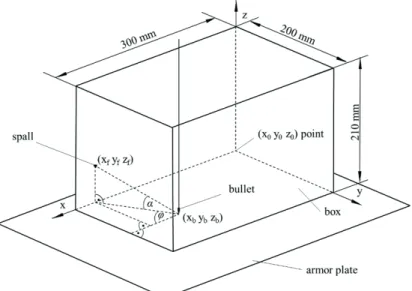
The boxes were of uniform size. The spalls break out from both sides of the armour plate and penetrate the cardboard boxes which provides a pattern. From this pattern the dimension of the spall cone and the distribution of the spalls can be determined. (Figure 3.)
Figure 3. The dimensions of the test-box and the interpretation of measured parameters for determining the spall cone.
[Edited by the authors.]
In the experiment every bullet penetrated the armour plate. The data of the shooting series is shown in Table 1. Two different bullet types and two different armour plates were investigated in the test (see Table 1). In the case of the bullet: 7.62 × 39 BZ, only the thinner armour plate with less hardness and tensile strength was tested. It is due to our experience from previous tests, that this type of bullet usually does not penetrate the thicker plates having stronger mechanical properties. This experiment cannot be used with 7.62 × 54R B32 bullets because the test showed that the explosion caused by the armour-piercing bullet destroyed the cardboard boxes.
Table 1. Summarised data of the setup of the experiment.
[Edited by the authors.]
Ammunition
Number of shots
Plate
Type Mean velocity
[m/s] Thickness
[mm]
Tensile strength [N/mm2]
Hardness [HB]
5.56 AP M9956 1041 5 6.5 1670 410
5.56 AP M995 1039 5 11.4 1700 550
7.62 × 39 BZ7 737 5 6.5 1670 410
For every shot in the experiment new boxes were attached to both sides of the plate.
Altogether five front- and five rear boxes were used in each shot series.
6 Armour Piercing cartridge with tungsten core.
7 Armour Piercing cartridge with hard steel core.
Processing the Data
Recording and processing the data
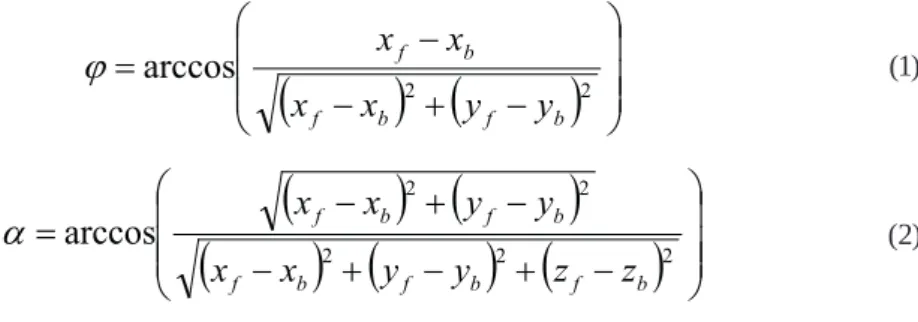
The surfaces of the boxes were digitalized and the coordinates of the holes were determined from these digitalized pictures using the coordinate system shown in Figure 3. Different sizes of the spalls were measured. From this data it was possible to represent the spall dimension distribution. Coordinates belonging to the spalls were transformed into two angle values. The values are calculated with equations (1) and (2) according to Figure 3.
( ) ( )
− +
−
= −
2
arccos
2b f b
f
b f
y y x
x
x
ϕ x
(1)( ) ( )
( ) ( ) ( )
− +
− +
−
− +
= −
2 2
2
2 2
arccos
b f b f b
f
b f b
f
z z y y x
x
y y x
α x
(2)where:
xf, yf, zf, are the coordinates of the spall impact;
xb, yb, zb are the coordinates of the bullet impact.
Results of descriptive statistics
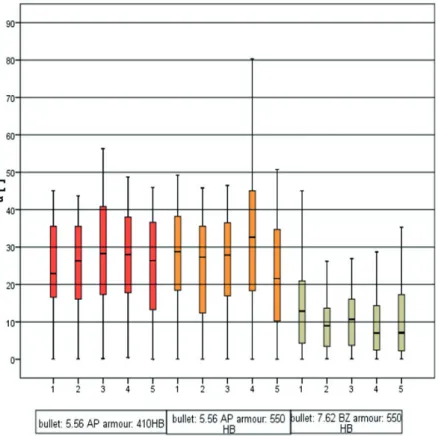
Figure 4 and Table 2 shows the box plot analysis and descriptive statistics of the α angles on the entry side of the armour (according to Figure 3). According to Table 2, the average number of spalls in a test shot are 492. The average α angle in case of the 5.56 AP bullet is higher in both armour plates (around 30°), while for the 7.62 BZ bullet this angle is much smaller (around 12°). According to Figure 4, 50% of the spalls in case of the 5.56 AP bullet fall between the angles 15° to 38°, while this value is between 5–15° in case of the 7.62 BZ bullets.
From these facts, it can be deduced that the properties of the bullets have more effect on the spall cone angles (taken perpendicular to the armour plate) than the material properties of the armour plate. There are some further differences within each test series. These differences were further evaluated with mathematical statistical methods and the results are shown in the next chapter.
Figure 5 and Table 3 show the results of the box plot analysis and the descriptive analysis of the α angles on the exit side. Comparing this value on both the entry and exit sides, it is noted that there are significantly less spalls on the exit side. According to Figure 5, differences could not be distinguished between the series. For the number of spalls, it can be established that in case of the 5.56 AP bullet shot on the 550 HB armour plate much less spalls were generated than when shot on the much softer 410 HB armour plate.
Figure 4. The box plot analysis of α angles on the entry side of the armour plate.
[Edited by the authors.]
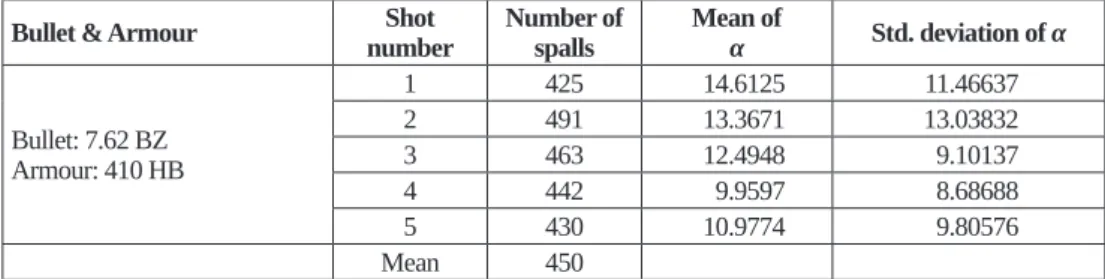
Table 2. Descriptive statistics of α angles on the entry side of the armour plate.
[Edited by the authors.]
Bullet & Armour Shot
number Number of
spalls Mean of
α Std. deviation of α
Bullet: 5.56 AP Armour: 410 HB
1 513 29.6655 14.95771
2 525 29.8425 15.16661
3 452 30.5936 16.74509
4 496 31.1918 15.63944
5 560 31.8773 18.66885
Mean 509
Bullet: 5.56 AP Armour: 550 HB
1 575 35.9743 18.72027
2 554 31.7685 19.11498
3 540 32.3503 18.15251
4 425 31.9133 18.88183
5 493 28.0345 19.79391
Mean 517
Bullet & Armour Shot
number Number of
spalls Mean of
α Std. deviation of α
Bullet: 7.62 BZ Armour: 410 HB
1 425 14.6125 11.46637
2 491 13.3671 13.03832
3 463 12.4948 9.10137
4 442 9.9597 8.68688
5 430 10.9774 9.80576
Mean 450
Considering the type of the bullet it was found that the 7.62 BZ, when shot on the same hardness (410 HB) armour plate, tore much less spalls from the exit side of the plate than the 5.56 AP bullet. Furthermore, it can be stated that there are much bigger differences on the exit side of the plates than on the entry side within the test series. (Figure 4.) This can be explained by the fact that the entry angles of the bullet can be considered the same in all test cases, because the shots were fired on the same kind of armour plate and the fixture of the plate was identical in all cases. During penetration, this angle differs because of the inhomogeneity of the armour plate, thus effecting the large distribution of the spall cones on the exit sides.
Figure 5. The box plot analysis of α angles on the exit side of the armour plate.
[Edited by the authors.]
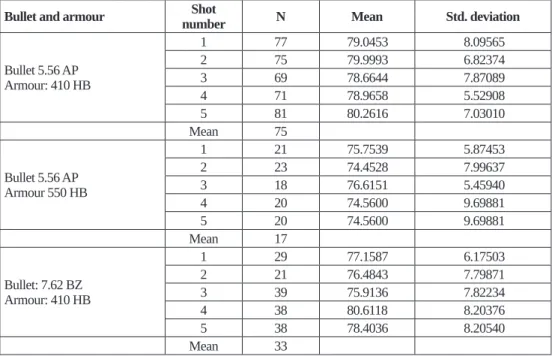
Table 3. Descriptive statistic of α angles on the exit side of the armour plate.
[Edited by the authors.]
Bullet and armour Shot
number N Mean Std. deviation
Bullet 5.56 AP Armour: 410 HB
1 77 79.0453 8.09565
2 75 79.9993 6.82374
3 69 78.6644 7.87089
4 71 78.9658 5.52908
5 81 80.2616 7.03010
Mean 75
Bullet 5.56 AP Armour 550 HB
1 21 75.7539 5.87453
2 23 74.4528 7.99637
3 18 76.6151 5.45940
4 20 74.5600 9.69881
5 20 74.5600 9.69881
Mean 17
Bullet: 7.62 BZ Armour: 410 HB
1 29 77.1587 6.17503
2 21 76.4843 7.79871
3 39 75.9136 7.82234
4 38 80.6118 8.20376
5 38 78.4036 8.20540
Mean 33
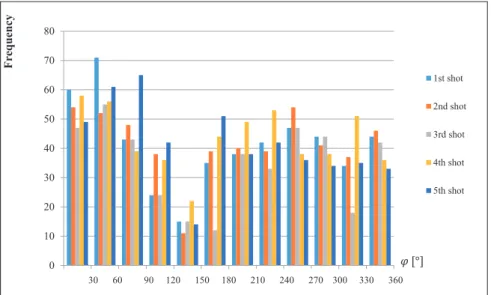
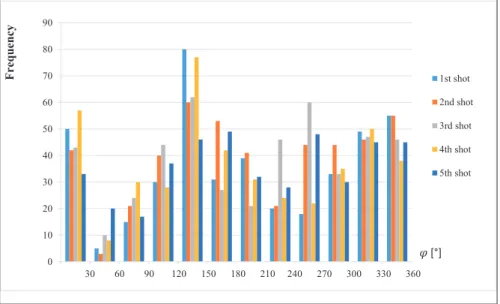
The parallel projections to the armour plate of the outcoming spall angles were investigated with frequency diagrams because of their near uniform distribution. In Figure 6, Figure 7 and Figure 8 frequency histograms of the φ angles for the entry side are represented.
Uniform distribution in a relatively long range can be seen in Figure 6. The frequency values decrease significantly in a very short range between 120° and 150°. In case of all the samples, this phenomenon can be observed almost to the same extent but in different disposition.
0 10 20 30 40 50 60 70 80
1st shot 2nd shot 3rd shot 4th shot 5th shot
Frequency
[°]
30 60 90 120 150 180 210 240 270 300 330 360
Figure 6. Distribution of the angles φ bullet: 5.56 armour: 410 HB.
[Edited by the authors.]
Figure 7 shows a different distribution. Within the series, the first shot differs significantly and basically shows uniform distribution, while in case of the other ones, there is no wide angle range where uniform distribution can be seen. In case of the second, third, fourth and fifth shots, the distributions show great similarity; in the short range of 0°~120° the frequency values are small and they increase significantly in the angle range of 120°~210°.
0 10 20 30 40 50 60 70 80 90 100
1st shot 2nd shot 3rd shot 4th shot 5th shot
Frequency
[°]
30 60 90 120 150 180 210 240 270 300 330 360
Figure 7. Distribution of the angles φ bullet: 5.56 AP armour: 550 HB.
[Edited by the authors.]
0 10 20 30 40 50 60 70 80 90
Frequency
1st shot 2nd shot 3rd shot 4th shot 5th shot
30 60 90 120 150 180 210 240 270 300 330 360
[°]
Figure 8. Distribution of the angles φ bullet:7.62 BZ armour: 550 HB.
[Edited by the authors.]
Angle distributions of φ in case of bullet 7.62 BZ can be seen in Figure 8. Shots inside the series show great similarity to each other. It can be stated for every series that the spall scattered in the plane of the armour plate in the entire 360° angle range. The spall distribution at this angle is non-uniform.
The similarity of the distributions of the angle φ within the series could be caused by the same impact angle because one series was shot on the same plate in an identical arrangement. It can be assumed that the uniform distribution of the angle φ for the spalls in the plane of the armour plate can be expected in case of a total perpendicular impact.
During the tests, the number of spalls formed on the exit side of the plate was too small, which was not suitable for further examination. For this reason, the distribution of the angle φ for the exit side is not presented. Although it can be stated that the distribution of the angle φ for the exit side is non-uniform, similarly to the entry side.
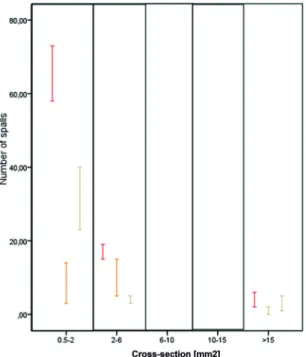
Figure 9 illustrates the distribution of the spall size on the entry side. Likewise, the distribution of the spall size on the exit side can be seen in Figure 10. In these figures, the imension mm2 is related to the size, (i.e. the cross-section) of the spall piercing the box.
It is easily recognizable from Figure 9 that 90% of the spalls are very small, with sizes between 0.5~2 mm2 on the entry side. There is no significant difference in size distribution among the three plates made of different material and thickness on the entry side.
The size distribution significantly differs on the exit sides; the quantity of the spalls is much less. While approximately 500 spalls were observable on the entry side, their number was not more than 90 on the exit side. (Figure 10.) Deviations can be observed on the exit side of the three different plates. In the case of the 5.56 AP bullet and 550 HB armour, a different distribution can be observed; the number of the spalls, with a cross-section 0.5–2 mm2 is much lower. In the cases of bullet 5.56 AP, armour 410 HB much more spalls can be observed.
These deviations can be explained by the different kinds of materials and bullets.
Figure 9. Spall size distribution on the entry side.
[Edited by the authors.]
Figure 10. Spall size distribution on the exit side.
[Edited by the authors.]
Statistical Examinations
The first step of the analysis was the normality test. The aim of the statistics analysis was to decide whether the specimen belonging to a series may originate from the same population.
In the case of normal distribution of the specimen, this can be decided with the ANOVA (Analysis of Variance) test, in the case of non-normal distribution, a non-parametric (Kruskal-Wallis) test can be used. The statistical analysis was made on the α angles of the entry side.
Analysis of the distribution was started with a normality test. The normal distribution of the sample data was checked using One-Sample Kolmogorov-Smirnov test [10] using SPSS.
The null hypothesis is that the data has normal distribution. The null hypothesis had to be rejected because p < 0.001 was found in all cases. Consequently, the angle between the spall path and the armour plate (α) does not have a normal distribution.
The aim of the next statistical investigation was to examine whether the samples have the same distribution, because the same distribution implies same parameters (the expected value and the standard deviation). In the case of a population with a normal distribution, the check can be done using the ANOVA test. However, ANOVA requires a population characterized by a normal distribution, and this condition was not met here. This was the reason why the only tool for checking equality was a non-parametric test. [10]
The Kruskal-Wallis test is the non-parametric equivalent of the ANOVA test. Population having normal distribution is not a condition of its application. Using this test, it is possible to check whether the samples have the same distribution or not. The null hypothesis of the test is that the distributions of the samples are the same. The test was also carried out with SPSS. The calculated values of significances are presented in Table 4. The table shows the values of p, in the first series p = 0.129, but in other cases p < 0.0001, therefore, the Kruskal-Wallis test rejected the null hypothesis in case of the last two series. Within these series, unequal distribution of samples and unequal expected value and standard deviation need to be assumed.
Table 4. Summarised data of the Kruskal-Wallis test according to the whole series.
[Edited by the authors.]
Series Bullet: 5.56 AP
Armour: 410 HB Bullet: 5.56 AP
Armour: 550 HB Bullet: 7.62 BZ Armour: 410 HB
p 0.129 0.000 0.000
For the detailed analysis of whether the samples are belonging to the same population, the values of α were analysed in pairs with the Two-Samples Kolmogorov-Smirnov Test.
Samples that had the same distributions could be selected from the five sample series according to the results of the two parameter tests. Based on this result, subgroups were selected on which the Kruskal-Wallis test was repeated. The results are shown in Table 5.
Table 5. Summarised data of the Kruskal-Wallis test according to the parts of the series.
[Edited by the authors.]
Series Bullet: 5.56 AP Armour: 410 HB Shots: 1, 2, 3, 4, 5
Bullet: 5.56 AP Armour: 550 HB Shots: 2, 3, 4
Bullet: 7.62 BZ Armour: 410 HB
Shots: 2, 3
Bullet: 7.62 BZ Armour: 410 HB
Shots: 4, 5
p 0.129 0.853 0.322 0.332
Table 5 contains the result of the statistical analysis, where all the five shots fired on the 410 HB armour plate with 5.56 AP type bullet show the same distribution in the spall angle components perpendicular to the armour plate (α angles).
In case of the identical bullet type shot on the 550 HB plate, the same distribution, however, is only valid for test series two, three and four. In case of the 7.62 BZ bullet, the distribution of the α angles for the second and third and also fourth and fifth shots are the same. It follows that more than one distribution can be identified in the last two series. The reason can be the dispersion of bullet velocity and the inhomogeneity of the material of the armour plate.
The distribution of alpha angles was verified with MS Excel and SPSS software. The tests excluded all of the following distributions: Normal, Uniform, Poisson, Exponential, Weibull and Lognormal.
Table 6. Curve estimation of the relative frequency of α angles.
[Edited by the authors.]
R2 Equation Bullet: 5.56 AP
Armour: 410 HB Shots: 1, 2, 3, 4, 5
Bullet: 5.56 AP Armour: 550 HB Shots: 2, 3, 4
Bullet: 7.62 BZ Armour: 410 HB
Shots: 2, 3
Bullet: 7.62 BZ Armour: 410 HB
Shots: 4, 5
Linear 0.581 0.539 0.693 0.645
Logarithmic 0.254 0.282 0.908 0.929
Inverse 0.044 0.106 0.813 0.938
Quadratic 0.816 0.753 0.951 0.951
Cubic 0.956 0.791 0.968 0.999
Compound 0.691 0.659 0 0
Power 0.356 0.361 0 0
S 0.114 0.141 0 0
Growth 0.691 0.659 0 0
Exponential 0.691 0.659 0 0
Logistic 0.691 0.659 0 0
Next, various functions were fitted using regression to the values of the relative frequencies of the alpha angles with the SPSS program. The results are shown in Table 6. Based on the results, it can be stated that the probability density functions of alpha angles can be best approximated by a third-degree polynomial, since in this case the correlation coefficient (R2) is the largest. Furthermore, it can be stated that in case of a higher polynomial, the correlation is further increased.
The problem of multiple penetration of spalls through the pierced holes on the sides of the cardboard boxes has already been mentioned in the introduction. The theoretical
likeliness of a smaller spall flying through a hole made by a larger spall is possible and this could distort the described experienced distribution. The probability for this situation can be calculated on a geometric basis. The probability of a spall flying through a hole pierced by another spall can be calculated by the following formula:
T
p= R (3)
where R is the mean surface area covered by the spalls calculated according to the values of Figure 9 and T is the surface of the box described in Figure 3. The expected value of the two spalls passing through the same hole is:
49 . 1
=
⋅
=n p
M (4)
where: n is the number of spalls. This means that less than two spalls will pass through a hole pierced by another spall from the average 500 spalls in a shot. The number of punctured holes on the box provides sufficient samples for the dispersion of spalls, and for determining the geometric parameters of the spall cone.
Evaluation
According to the results of our experiments (and of Figure 4), it can be stated that the spall angle on the entry side of the armour plate is near 180°. 50% of the spalls flying out of the armour plate fall into a relatively narrow zone with an angle between 10–20°. A spall free zone can also develop between the angles 60–120° (see Figure 10).
The parameters of the bullet (velocity, bullet core) had more effect on the formation of the spall cone parameters (see Figure 11) than the mechanical properties of the armour plate. Spall clouds caused by slower moving and softer core bullets have larger cone angles and concentrate the spalls in a narrower zone.
Figure 11. Spall cone parameters on the entry side.
[Edited by the authors.]
On the entry side, in an individual series, the distribution of the α angles (perpendicular to the armour plate, responsible for creating the spall cone angles) was identical for the five shots made by the 5.56 AP bullet on the 410 HB hardness armour plate. This cannot be stated for the other test series, but between the series shots could be identified that had the same α distribution and with it also the same expected value and dispersion. The density functions associated with the distribution of α angles can be best approximated by a polynomial of a minimum of third degree. The spall cone can be identified with this method on the entry side of the armour plate.
The spall angle projections parallel to the armour plate (φ angles) differs from the uniform distribution. (Figures 6, 7 and 8) Spall cone parameters on the entry side.. The difference can be caused by the slight difference from the perpendicular (90°) impact. The shots belonging to a series were fired on the same armour plate. This way, the angle between the plane of the armour plate and the tangent of the bullet trajectory were almost identical (considering the inevitable accidental small displacements). This could be the reason for the evident similarity in a series.
On the exit side, (according to Figure 5), the distribution of α angles show a great difference. The reason for the difference is that the trajectory of the bullet deviates during the penetration. The magnitude and the direction of the deviation is different from shot to shot, thus the bullet exits the armour in different directions (angles) after penetration. This is the reason the α angles have different distributions in one series. The exit spall cone angle thus cannot be identified by our method, only the extreme values of the measure values can be described. The maximal angle of the spall cone is around ~126°. (Figure 12).
Figure 12. Spall cone parameters on the exit side.
[Edited by the authors.]
The number of spalls on the entry side were between 450–517 pieces, while on the exit side the number were significantly less 15–75 pieces.
Regarding the size distribution of the spalls it can be stated that there is a great similarity in both distribution and spall numbers on the entry side of the shot. 80–90% of the spalls are of small size with a cross section of 0.5–2 mm.
However, a great difference in the size distribution and the number of spalls between each series can be observed on the exit side of the armour plate. It concludes that the spall
cone is much narrower on the exit side than on the entry side of the armour plate. The spall cone angle, the size distribution and the spall number are much more sensitive on the parameters of the bullet and the armour material.
Conclusion
Based on the results of the tests, it can be concluded that the geometry of the spall cloud created by a bullet penetrating an armour plate can be determined with the method presented in this paper.
The mechanism of spallation depends on the material and the kinetic energy of the bullet core, and on the material characteristics of the armour plate (its hardness and ultimate tensile strength).
During the research, two parameters had been identified that had a significant effect on the spall cone. On the front side, it was the bullet core hardness and velocity. In this case bullets with higher speed and greater hardness caused smaller cone angles than the lowest ones considering identical armour plates. The geometry of the spall cones, the size distributions of the spalls and their numbers show a significant difference between the entry and the exit side of the armour plate. Similarities among the test series on the entry side of the armour plate can be observed, that is not specific for the exit sides.
References
[1] GÁVAY Gy. – GYARMATI J. – SZAKÁL Z. – KALÁCSKA G.: Evaluation of bullet resistance of different steel alloys in army application. Proceedings of the International Scientific Conference on Advances in Mechanical Engineering. Debrecen, University of Debrecen Faculty of Engineering, 2014. 34–42.
[2] FARRAND, T. G.: Various Target Material Failure Mechanisms Observed for Ballistic Penetrations. Technical Report BRL-TR-3255. Maryland, US Army Ballistic Research Laboratory, 1991.
[3] KRIVTSOV, A. M.: Computer Simulation of Spall Crack Formation Structural Dynamics.
EURODYN ’99. Rotterdam, Balkema, 1999. 475–477.
[4] WERNER, A. – WOLFGANG, P.: Behind Armour Debris Investigation and Their Application into a New Vulnerability Model. International Journal of Impact Engineering, 26 1–10 (2001), 21–32. DOI: https://doi.org/10.1016/s0734-743x(01)00071-9
[5] ERBIL, Y. – EKŞI, A. K. – BIRCAN, D. A.: Spall Liner: From Fiber to Protection. 6th International Advanced Technologies Symposium. IATS ’11. Elazığ, 2011. 378–382.
[6] Security and Safety. Armour protection. Rijswijk, TNO Defence, (s.a.) www.tno.nl/
media/1654/defind_land_ballistischebescherming_armour-protection.pdf (Downloaded:
12.10.2018)
[7] ARNOLD, W. – ROTTENKOLBER, E.: Fragment mass distribution of metal cased explosive charges. International Journal of Impact Engineering, 35 12 (2008), 1393–1398.
DOI: https://doi.org/10.1016/j.ijimpeng.2008.07.049
[8] Ballistic Resistance of Body Armor NIJ Standard-0101.06. NIJ Standards. Washington, D.C., U.S. Department of Justice, National Institute of Justice, 2008. www.ncjrs.gov/
pdffiles1/nij/223054.pdf (Downloaded: 10.10.2018)
[9] SZAKÁL Z. – GÁVAY Gy. – KALÁCSKA G. – GYARMATI J.: Failure of different steel alloys in army application. Mechanical Engineering Letters: R and D: Research And Development, 11 (2014), 143–150.
[10] WAYNE, D. W.: Applied Nonparametric Statistics. 2nd edition. Boston, PWS-Kent, 1990.