LETTER
Imitate or innovate: Competition of strategy updating attitudes in spatial social dilemma games
To cite this article: Zsuzsa Danku et al 2018 EPL 121 18002
View the article online for updates and enhancements.
doi: 10.1209/0295-5075/121/18002
Imitate or innovate: Competition of strategy updating attitudes in spatial social dilemma games
Zsuzsa Danku1, Zhen Wang2 andAttila Szolnoki3
1 Institute of Mathematics and Informatics, University of Ny´ıregyh´aza - Ny´ıregyh´aza, Hungary
2 School of Cyberspace, Hangzhou Dianzi University - Hangzhou 310018, China
3 Institute of Technical Physics and Materials Science, Centre for Energy Research, Hungarian Academy of Sciences P.O. Box 49, H-1525 Budapest, Hungary
received 20 December 2017; accepted in final form 16 February 2018 published online 7 March 2018
PACS 87.23.Kg– Dynamics of evolution
PACS 87.23.Cc– Population dynamics and ecological pattern formation
PACS 89.65.-s– Social and economic systems
Abstract– Evolution is based on the assumption that competing players update their strategies to increase their individual payoffs. However, while the applied updating method can be different, most of previous works proposed uniform models where players use identical way to revise their strategies. In this work we explore how imitation-based or learning attitude and innovation-based or myopic best-response attitude compete for space in a complex model where both attitudes are available. In the absence of additional cost the best response trait practically dominates the whole snow-drift game parameter space which is in agreement with the average payoff difference of basic models. When additional cost is involved then the imitation attitude can gradually invade the whole parameter space but this transition happens in a highly nontrivial way. However, the role of competing attitudes is reversed in the stag-hunt parameter space where imitation is more successful in general. Interestingly, a four-state solution can be observed for the latter game which is a consequence of an emerging cyclic dominance between possible states. These phenomena can be understood by analyzing the microscopic invasion processes, which reveals the unequal propagation velocities of strategies and attitudes.
Copyright cEPLA, 2018
To imitate a more successful strategy is a frequently applied microscopic rule within the framework of evolu- tionary game theoretical models which focus on the funda- mental conflict of individual and community benefits [1,2].
This assumption is partly motivated by biological systems where payoff is interpreted as fitness or reproductive suc- cess [3]. Considering more sophisticated human systems, where similar social dilemmas are on stage, there are other alternative suggestions for strategy updating rules that take account of cognitive skills of competitors. During the last decades theoretical models have raised several ways how to update strategies including myopic best re- sponse [4–8], learning, or reinforcement learning strate- gies [9–17]. In parallel, a huge number of experimental works have been published, but sometimes their conclu- sions are conflicting which make difficult the comparison with theoretical predictions [18–21].
One of the possible reasons of contradicting experimen- tal results could be that we cannot be fully sure what is the microscopic motivation of individual competitors when they update their strategies. Furthermore the simul- taneous presence of different updating traits or attitudes cannot be excluded, which makes the evaluation of dif- ferent external conditions even harder. Interestingly, this fact has been largely ignored by theoretical works because most of them assume uniform players in the sense that they all apply the same method or attitude to revise their present states. In this letter we consider a simple model where two conceptually different attitudes are available for individuals who try to reach a higher payoff. These strategy updating methods are based on imitation or in- novation and players are using one of them during a micro- scopic step. Beside heterogeneous attitudes we also extend the basic models by considering the fact that applying
Zsuzsa Dankuet al.
a certain attitude may be costly. For example, innovation requires additional investment from a player or imitation assumes a permanent effort to monitor others’ activity and score their success. These effects can be modeled by con- sidering an additional cost to a specific attitude [22–26].
As we will show, even a very simple model can provide a highly complex behavior and the viability of a certain attitude or strategy updating method depends sensitively on the model parameters. Furthermore, their relation may change repeatedly by varying only a single parameter, but without changing the original character of a certain social dilemma.
We consider pairwise social games where mutual coop- eration provides the rewardR= 1, mutual defection leads to punishment P = 0. The remaining two payoff values are free parameters of our model to navigate among differ- ent dilemma situations. These are the sucker’s payoffS of a cooperator against a defector and the temptation value T for the latter player. For simplicity we assume that players are distributed on a square lattice with periodic boundaries where every player interacts with four nearest neighbors when total payoff is calculated. Nevertheless, we stress that our main findings remain unchanged if we use different interaction topologies including triangle and hexagonal lattices or random network.
In addition to the mentionedCandDstrategies players are also characterized by a special attitude or trait which determines how they revise their strategies. If a playerxis described by the trait imitation (IM) then she adopts the strategysyfrom a neighboringyplayer with a probability W(sx→sy) = (1 + exp[(Πx−Πy)/K])−1, (1) where Π denotes the accumulated payoff values gained from two-player games with nearest neighbors. This sum is reduced by an attitude-specific cost of focal player. In particular, an imitating player bears an additional IM
cost, while a player who uses (myopic) best response (BR) to update her strategy should bear BR. The remaining parameterK determines the noise level of the imitation process. In the alternative case, when thexplayer’s atti- tude is characterized by (myopic) best response to update her strategy, then she changes hersx strategy to sx with a probability
Γ(sx→sx) = (1 + exp[(Πx−Πx)/K])−1, (2) where Πxand Πxare the income of playerxwhen playing sx and sx for the given neighborhood. For simplicity we applied the same noise level as for the above-described imitation process.
Since our principal interest to explore how different at- titudes compete we also allow the individual attitude to change. When this microscopic process is executed, which is independent of the previously specified strategy update, we assume that a playery forces her attitude or individ- ual trait upon a neighboring playerxwith the probability defined by eq. (1). Technically we thus have a four-state
0.0 0.2 0.4 0.6 0.8 1.0
S
1.0 1.1 1.2 1.3
T
0.0 0.2 0.4 0.6 0.8 1.0
S
1.0 1.1 1.2 1.3
T
0.01 0.1 0.15
0.01 0.1
a) 0.15 b)
IM BR IM BR
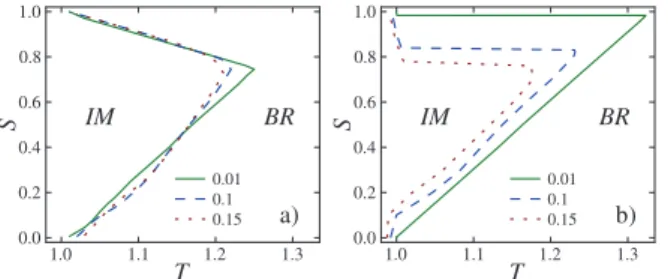
Fig. 1: (Color online) Border lines on the T-S plane of the snow-drift game separating the regions where either imitation (IM) or best-response (BR) attitude dominates. Panel (a) shows the borders calculated from the payoff differences of basic models where either imitation or best-response strategy update is used exclusively. Panel (b) denotes the phase bound- aries resulted from the complex model where both attitudes are present in the initial states. BR=IM = 0 are used for both panels. The appliedK noise levels are denoted in the legend.
model, where strategy and individual attitude coevolve during the evolutionary process.
We have performed Monte Carlo simulations and mon- itored the fractions of strategies and attitudes. If players’
attitudes reached a uniform state we terminated the sim- ulation because the system becomes equivalent to a basic model where either imitation or best-response rule is used exclusively to update individual strategies [7]. Similarly, if the strategy distribution becomes uniform because ei- ther C or D strategy goes extinct then we also stopped simulation. In the latter case further evolution becomes uninteresting because in the absence of different strategies the competition of attitudes is determined by their addi- tional costs or, if these are equal, the dynamics resembles to the voter-model–like dynamics [27,28]. This explains why we only consider snow-drift and stag-hunt games and leave prisoner’s dilemma game out. Namely, in the latter case the system practically terminates onto a full defec- tion state and this destination can only be avoided if we assume additional mechanisms [29–31]. But the scope of the present work is to explore the possible consequence of simultaneous attitudes hence we keep the original basic model without considering further mechanisms.
First we summarize our observations obtained for the snow-drift game when no additional costs of attitudes are considered. Figure 1(b) highlights that if the T value is close to 1, which means that the temptation to defect is small, then the imitation attitude will spread in the whole system during the coevolutionary process. But for high T temptation values the evolutionary outcome is reversed and the best response attitude crowds out the alternative trait. This observation is in close agreement with the pre- diction based on the comparison of average payoff values of basic models where only uniform attitude is applied.
This comparison is plotted in fig. 1(a) where higher payoff can be reached by applying imitation dynamics at lowT values, but the best-response attitude offers a higher gen- eral payoff for individuals when we increase the temptation
0.0 0.1 0.2 0.3
Differenceofinvasions
0.0 0.2 0.4 0.6 0.8 1.0
S
-0.15 -0.1 -0.05 0.0 0.05
IM-BR
0.0 0.2 0.4 0.6 0.8 1.0
S
BC IC
BC ID
ID BD
IC BD
a)
b)
BR IM BR
Fig. 2: (Color online) Efficiency of microscopic invasion pro- cesses between different states in dependence on S at fixed T = 1.1 forK= 0.1 when no additional costs are considered (IM =BR = 0). Only those steps are shown which modify the fractions of competing attitudes. The borders of different phases are marked by dashed vertical lines. While panel (a) shows the details of specific elementary invasions as described by the legend, panel (b) shows their accumulated values which determine the final outcome of competition. For better clarity we have usedI for IM and B for BR players in the legend where elementary invasion processes are specified.
value. Interestingly, the payoff difference is practically in- dependent of the applied noise value, but the latter has a significant impact on the phase boundary when atti- tudes properly compete. As fig. 1(b) shows the higher the noise value the smaller the parameter space where imita- tion can dominate. This phenomenon can be understood if we consider that the error in imitation will always de- stroy the efficiency of homogeneous cooperator domains, while this error has no real impact on the role-separating arrangement ofC-Dpairs when the best-response attitude is at work.
Figure 1(b) also shows that there is a reentrant phase transition from BR to IM to the BR phase as we in- crease theSvalue at specific fixedT values. This behavior is a straightforward consequence of the relation of coop- erator players having different attitudes. At high S the payoff of a cooperator using the best response becomes competitive with the payoff of defectors hence the former BCplayer can resist the invasion of the imitation attitude.
Similarly, a small positive S value also provides a stable support to BC players to maintain the checkerboard-like pattern of the best-response phase. They can resist the in- vasion ofICimitator cooperators whose low density in the IMphase makes them vulnerable. Between these extreme cases the relatively high S provides a competitive payoff forIC players whose higher density makes the wholeIM phase strong. To confirm this argument in fig. 2(a) we have plotted the differences of elementary invasion steps for all cases where players invade a neighboring site that was occupied previously by a different attitude. This panel shows clearly the non-monotonous change betweenICand BC states which is mainly responsible for the observed reentrant transition.
From fig. 1(b) we can conclude that the best-response attitude can practically dominate the majority of the snow-drift quadrant because the emerging role-separating
0.0 0.2 0.4 0.6 0.8 1.0
S
1.0 1.2 1.4 1.6 1.8 2.0
T
0.0 0.2 0.4 0.6 0.8 1.0
S
1.0 1.2 1.4 1.6 1.8 2.0
T
0.0 0.2 0.4 0.6 0.8 1.0
S
1.0 1.2 1.4 1.6 1.8 2.0
T
0.0 0.2 0.4 0.6 0.8 1.0
S
1.0 1.2 1.4 1.6 1.8 2.0
T
IM BR IM BR
IM BR IM BR
c) d)
a) b)
Fig. 3: (Color online) Phase diagrams on the T-S plane for different cost values of the best-response update rule while the cost of imitation strategy update remained IM = 0. The former cost is BR = 0,0.05,0.1, and 0.25 for panel (a) to panel (d), respectively. Here orange (green) denotes the pa- rameter area where imitation (myopic best response) attitude prevails as a result of the coevolutionary process. The noise value isK= 0.1 for all cases.
pattern makes it viable. One may expect that if we increase the BR cost of this attitude then the imitation attitude can gradually invade the whole parameter space.
This expectation is justified but in a highly nontrivial way.
Figure 3 illustrates that the area of theIMphase expands asBRis increased but the shape of the phase separating border could be tangled at intermediate cost values. For example, atBR= 0.1, S= 0.8 we can observe three con- secutive phase transitions fromIM →BR→IM →BR phase by changing only the value of temptationT.
In the latter case the explanation of these transitions is more subtle because it cannot be confirmed by com- paring only a single pair of competing states. As earlier, in fig. 4 we have recorded the successful elementary inva- sion steps at three representativeS values in dependence onT. The explanation of the three transitions at highS value, shown in the top row, is the following. If we start increasing temptation fromT = 1 thenID becomes more powerful and simultaneously IC weakens. At the same timeBC remains intact in theBR domain becauseS re- mains high. As a result, IC weakens against BC which involves the decay of theIM phase against theBRphase.
Indeed,ID becomes also stronger againstBC, but the for- mer effect is more substantial, as fig. 4(b) panel illustrates.
IncreasingT further the average cooperation level does not change relevantly. (This plateau was illustrated in fig. 4(c) of ref. [7] where the basicIM model was studied.) How- ever, the further increase of T makes ID even powerful.
As a result, ID can invade BC more intensively, which
Zsuzsa Dankuet al.
0.0 0.1 0.2 0.3 0.4
Differenceofinvasions
1.0 1.2 1.4 1.6 1.8 2.0
T
0.0 0.04 0.08 0.12
IM-BR
1.0 1.2 1.4 1.6 1.8 2.0
T
0.0 0.1 0.2 0.3 0.4
Differenceofinvasions
1.0 1.2 1.4 1.6 1.8 2.0
T
0.0 0.04 0.08 0.12
IM-BR
1.0 1.2 1.4 1.6 1.8 2.0
T
0.0 0.1 0.2 0.3 0.4
Differenceofinvasions
1.0 1.2 1.4 1.6 1.8 2.0
T
0.0 0.08 0.16 0.24
IM-BR
1.0 1.2 1.4 1.6 1.8 2.0
T
BC IC BC ID ID BD IC BD BC IC BC ID ID BD IC BD BC IC BC ID ID BD IC BD
a) b)
c) d)
e) f)
IM BR IM BR
IM BR
IM BR IM BR
Fig. 4: (Color online) The success of elementary invasion steps between competing attitudes for different values of fixedS in dependence on temptation T. Top row shows the results for S= 0.8, middle row forS= 0.5, and bottom row forS= 0.2.
As for fig. 2, left column shows the full details of invasion, while right column summarizes their impacts on the direction of inva- sion between competing solutions. As earlier, the criticalTval- ues of phase transition points are marked by dashed vertical lines. Other parameters areK= 0.1, BR= 0.1,andIM= 0.
will reverse the direction of propagation betweenBR and IM phases. The last transition can be explained by the relation ofBD andID players, which becomes important for this parameter region. While the former remains fit amongBCplayers the latter cannot utilize highTbecause the density ofIC players decays rapidly. This is whyBD
will beat ID more frequently which causes the victory of theBR phase again.
At intermediateS value, shown in middle row of fig. 4, the previously mentioned plateau of the basicIM model disappears, henceIDplayers are unable to utilize the con- stant support ofIC neighbors. Consequently, we can ob- serve only a single transition from theIM to BR phase.
At smallerS value, however, we face a new situation be- cause smallScannot maintainICplayers in theIM phase for higher T values. This is illustrated by the invasion rates shown in the bottom row of fig. 4 where the invasion success of BC against IC diminishes for T > 1.5. Here BC cannot beatIC players anymore and the advantage of theBR phase over the IM solution disappears. Instead, a pureID phase competes with the previously mentioned checkerboard-like pattern of theBRphase. HereIDplay- ers can utilize their advantage overBDplayers who have to bear the extraBR= 0.1 cost. As a result, theIM phase
strikes back when temptation exceedsT = 1.5 value. As we increaseT further, the disadvantage of additional cost becomes marginal and the stable support ofBCneighbors will provide a competitive payoff for BD players, which explains why theBRphase can win again.
The comparative plots of fig. 5 provide a deeper insight into the consecutive phase transitions as we increase the temptation value. Here we first separated the lattice into two parts where the solutions of basic models evolved independently due to the applied parameter values. More precisely, players using the best-response attitude were closed in the central domain where this subsystem relaxed to the BR phase, while players using the imitation atti- tude were in the surrounding space where the IM phase evolved. In other words, neither strategy nor attitude transfer was allowed across the separating borders which are marked by dashed white lines. These final states of the relaxation, which are the initial states of attitude competitions, are plotted in the top row of fig. 5. After we removed the borders, the starting strategy and attitude transfer resulted in a complete success of one of the basic solutions. We note that the final states are not shown here, but can be read out from the top row of fig. 4. Instead, we have recorded the “trace” of invasion steps for every cases.
More precisely in the bottom row of fig. 5 we colored those lattice sites where invasion happened during the whole competition until soleIM orBR state was reached. The applied colors, which are plotted in the bottom of the figure, mark the last invasion process at a given position.
Figure 5(a) demonstrates that at a smallTvalue theIM state is full ofIC players who can support each other ef- fectively and collect a high payoff value. As a consequence, theIM phase can easily invade the BRphase at this pa- rameter region. The corresponding fig. 5(e) illustrates that in this case the most typical change between the compet- ing states is when the previously mention strongICplayer invades the weaker member of theBRphase, which is the BC player. As we increase the temptation value, shown in fig. 5(b), the density ofIC players decays which weak- ens them significantly. At the same timeID cannot gain enough power because theT value is still moderate. As a result, the direction of invasion turns back andBRstarts propagating. Indeed, the related fig. 5(f) demonstrates that theBD→IDandBD→ICtransitions become dom- inant. As we already noted, by increasingT further the density ofICplayers does not change relevantly due to the high value ofS. This is clearly visible in fig. 5(c), where theIM phase before the competition remained practically unchanged. It means that ID players can enjoy undis- turbed support from IC neighbors but the former is al- ready armed by a higherT payoff. That explains why the IM phase can invade again because theID→BC transi- tion, marked by light orange, becomes relevant. Lastly, if we increase the temptation value T further then ID
becomes too successful within the IM phase, hence the density of IC players decays drastically, as is shown in fig. 5(d). Consequently,IDplayers are unable to enjoy the
IC ID BC BD
BC IC BC ID ID BD ID BD
a) b) c) d)
e) f) g) h)
Fig. 5: (Color online) Competition of attitudes for different temptation values forT = 1.15,1.45,1.7, and 1.9 (from left to right). The other parameters, S = 0.8, IM = 0, BR = 0.1, K = 0.1 andL = 80, are fixed for all cases. The top row shows the initial separation of the lattice where the composition of best-response players is surrounded by players who apply the imitation-based strategy update rule. First, invasion across the vertical phase separating lines is forbidden, hence subsystem solutions are relaxed to the characteristic states which are determined byT, S, and K values. When competition starts by removing the border between them then eitherIM orBRphase prevails depending on theT value (not shown). The bottom row illustrates the trace of elementary processes during the invasion. To distinguish them we used the same color coding as for fig. 2 and fig. 4.
support of neighboringIC players when they fight against the external BR phase. BD players of the latter phase, however, can still enjoy the solid support of BC neigh- bors due to the checkerboard-like pattern of this phase.
That explains whyBD players can beat ID players, and theBDphase invades theIMphase no matter the former attitude should still bear an extra cost. This phenomenon is nicely illustrated in fig. 5(h) where dark green pixels emerged more frequently. To summarize the surprisingly different outcomes of evolution processes we have provided an animation (see ref. [32]), where all discussed cases are shown simultaneously using the sameS = 0.8, BR= 0.1 values and the only difference is the temptation value as is described by fig. 5.
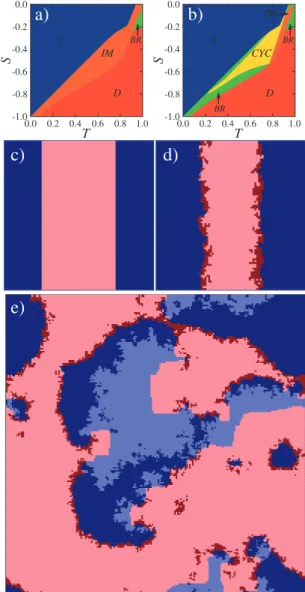
In the rest of this work we present our observations ob- tained for the stag-hunt game, whereR > T > P > Srank characterizes the dilemma. The most fundamental differ- ence from the above-discussed snow-drift dilemma is that the best-response attitude cannot provide a checkerboard- like pattern here, hence homogeneous solutions compete for space [8]. In this situation imitation is more effective when both attitudes are free from additional cost, because theIMattitude can extend the fullCstate to a larger area on the T-S plane. This is illustrated in fig. 6(a), where we plotted the phase diagram usingIM =BR= 0 cost values at K = 0.1. If T is too small then defectors die out very early and both basic models terminate into a full cooperator state. IncreasingT the best-response attitude does better and invades the whole space. This state is marked byIM, but we note that the full cooperator state
is still maintained. Increasing temptation further there is a sharp transition into the full D state that is in agree- ment with the basic models where uniform attitudes are assumed [7].
The invasion of theIM phase into theBRphase reveals an interesting phenomenon that is based on the unequal propagation speeds of strategy and attitude. To illustrate it in fig. 6(c) we start the evolution from an initial state where two stable solutions of basic models are present at T = 0.35, S=−0.7. More preciselyBD players, who are in the middle of this panel are fighting againstIC players who surround them. When evolution starts BD players at the frontier change their attitude first and becomeID
players. This new state, which is not present in the initial state, is marked by dark red color in fig. 6(d). The whole propagation process can be followed in an animation we provided as supplementary information in ref. [33]. It is important to note that this new state has a special role on the propagation ofIC players. On the one hand,ID can- not be utilized byMDplayers, but on the other hand the former could be more successful than the latter since they enjoy the vicinity of IC players. This explains why ID
(dark red) propagates in the sea of BD (light red). In- terestingly, the triumph of ID is just temporary because they are immediately invaded by IC players. The latter process ensures a thin protecting skin aroundIC domain in a self-regulating way. Put differently, ID helps IC to invade theBR phase and after, fulfilling its job,ID goes extinct. This is the so-called “the Moor has done his duty, the Moor may go” effect which was previously observed in
Zsuzsa Dankuet al.
-1.0 -0.8 -0.6 -0.4 -0.2 0.0
S
0.0 0.2 0.4 0.6 0.8 1.0
T
-1.0 -0.8 -0.6 -0.4 -0.2 0.0
S
0.0 0.2 0.4 0.6 0.8 1.0
T
C
D IM
BR C
D CYC
BR
BR
a) b)
IMc) d)
e)
Fig. 6: (Color online) Panel (a): phase diagram on the T-S plane of the stag-hunt game forBR =IM = 0 at K = 0.1.
C(D) denotes the phase where defectors (cooperators) die out very early. WhenIM imitation attitude prevails, the system evolves into a full cooperator state. Panel (b) shows the phase diagram when IM = 0.02 is applied for imitation attitude.
HereCY Cdenotes a solution where all available states coexist due to cyclic dominance. Panel (c) shows the initial state of competition when stable solutions of basic models (fullICand full BD) start competing at T = 0.35, S =−0.7, andIM = BR = 0. Panel (d) illustrates a representative intermediate state of invasion before imitation attitude invades the whole system. During the invasion a new state, ID, emerges which highlights the unequal invasion speeds of attitude and strategy.
Panel (e) illustrates the cyclic dominance betweenIC→BD→ BC →IC states atT = 0.7, S =−0.5, and IM = 0.02. The color codes of microscopic states are identical to those we used in the top row of fig. 5.
a completely different system where punishing strategies were involved in a public goods game [34].
Naturally, if we apply a significant cost for the imita- tion attitude then it looses its advantage and players using the best-response attitude will dominate. As a result, the
area of fullCstate shrinks on theT-Splane and its border shifts to theS=T−1 line in the zero noise limit, which characterizes theBRbasic model. Interestingly, a moder- ateIM cost allows a new kind of solution to emerge. To illustrate it we present a phase diagram plotted in fig. 6(b) where IM = 0.02 was applied. This diagram suggests that at some parameter values all competing states can survive and coexist. This coexistence is based on a cyclic dominance between microscopic states and a typical spa- tial pattern is plotted in fig. 6(e). As the pattern suggests IC (dark blue) invades BD (light red) with the help of ID (dark red) players. Here the role of ID is the same as we described above. However,BC (light blue) invades IC (dark blue) because the former should bear an extra cost. Lastly, BD (light red) invades BC (light blue) be- cause the best-response basic model dictates a fullDstate at thisT-S parameter values. For clarity we also provided an animation where the dynamics of this states can be followed (see ref. [35]).
The above description of cyclic dominance explains why we cannot observe coexistence for too highIM values. In the latter case the vicinity of IC cannot compensate the high cost value ofID, henceIDcannot invade theBDdo- main anymore. As a result, the cyclic chain of invasions is broken and the system terminates into a state where the population is described by a homogeneous state. This behavior is in close agreement with our general under- standing about the positive role of cyclic dominance to maintain the diversity of microscopic states [36–45].
To sum up, we have shown that the success of differ- ent strategy updating traits or attitudes may depend sen- sitively on the actual payoff values which characterize a social dilemma. In most of the parameter regions we de- tected homogeneous populations but we can observe sev- eral transitions between an imitation dominant state to a population which is described by the best-response at- titude. Our key finding is attitudes and strategies may propagate with different speeds which makes it possible for several interesting pattern formations to emerge. For example, consecutive re-entrant phase transitions are de- tected by only changing a single parameter without mod- ifying the fundamental character of a social dilemma. We have also shown that cyclic dominance can emerge be- tween microscopic states no matter there are only two ma- jor C and D strategies. Indeed, it was previously found that a two-strategy system can produce similar cyclic dom- inance in spatial systems [46], but the mentioned exam- ple assumed diverse timescales during the evolution. Our present observations emphasize that the microscopic ori- gin of diversity has just a second-order importance because every type of microscopical diversity could be a source of cyclical dominance among competing states.
We note that all the presented results are robust to re- placing lattice-type interaction topology by random graph, and can be observed also for other parameter values. We conclude that considering the simultaneous presence of dif- ferent strategy updating or learning attitudes might be
a new research avenue for modeling human behavior in social dilemmas more realistically.
∗ ∗ ∗
This research was supported by the Hungarian Na- tional Research Fund (Grant K-101490) and Natural Science Foundation of Zhejiang Province (Grant Nos.
LY18F030007 and LY18F020017).
REFERENCES
[1] Nowak M. A.andHighfield R.,SuperCooperators: Al- truism, Evolution, and Why We Need Each Other to Suc- ceed(Free Press, New York) 2011.
[2] Sigmund K.,The Calculus of Selfishness(Princeton Uni- versity Press, Princeton, NJ) 2010.
[3] Maynard Smith J.,Evolution and the Theory of Games (Cambridge University Press, Cambridge, UK) 1982.
[4] Matsui A.,J. Econ. Theory,57(1992) 343.
[5] Blume L. E.,Games Econ. Behav.,5(1993) 387.
[6] Roca C. P., Cuesta J. A.andS´anchez A.,Eur. Phys.
J. B,71(2009) 587.
[7] Szab´o G., Szolnoki A., Varga M.andHanusovszky L.,Phys. Rev. E,80(2010) 026110.
[8] Szab´o G.andSzolnoki A.,J. Theor. Biol.,299(2012) 81.
[9] Macy M. W. and Flache A., Proc. Natl. Acad. Sci.
U.S.A.,99(2002) 7229.
[10] Izquierdo L. R., Izquierdo S. S., Gotts N. M.and Polhill J. G.,Games Econ. Behav.,61(2007) 259.
[11] Masuda N. and Nakamura M., J. Theor. Biol., 278 (2011) 55.
[12] Cimini G. and S´anchez A., J. R. Soc. Interface, 11 (2017) 20131186.
[13] Li K., Cong R. andWang L.,EPL,114(2016) 58001.
[14] Horita Y., Takezawa M., Inukai K., Kita T. and Masuda N.,Sci. Rep.,7(2017) 39275.
[15] Stivala A., Kashima Y.andKirley M.,Phys. Rev. E, 94(2016) 032303.
[16] Broere J., Buskens V., Weesie J.andStoof H.,Sci.
Rep.,7(2017) 17016.
[17] Takesue H., Ozawa A. and Morikawa S., EPL, 118 (2017) 48002.
[18] Traulsen A., Semmann D., Sommerfeld R. D., Krambeck H.-J. and Milinski M., Proc. Natl. Acad.
Sci. U.S.A.,107(2010) 2962.
[19] Gracia-L´azaro C., Ferrer A., Ruiz G., Taranc´on A., Cuesta J., S´anchez A.andMoreno Y.,Proc. Natl.
Acad. Sci. U.S.A.,109(2012) 12922.
[20] Rand D. G., Nowak M. A., Fowler J. H. and Christakis N. A., Proc. Natl. Acad. Sci. U.S.A., 111 (2014) 17093.
[21] Tingh¨og G., Andersson D., Bonn C., B¨ottiger H., Josephson C., Lundgren G., V¨astfj¨all D., Kirch- ler M.andJohannesson M.,Nature,498(2013) E1.
[22] Rustagi D., Engel S.and Kosfeld M., Science, 330 (2010) 961.
[23] Brede M.,PLoS ONE,8(2013) e67056.
[24] Antonioni A., Cacault M. P., Lalive R. and Tomassini M.,PLoS ONE,9(2014) e110788.
[25] Szolnoki A. and Perc M., New J. Phys., 16 (2014) 113003.
[26] Bertran F. J. L.and Turner J. L., J. Econ. Behav.
Organ.,137(2017) 457.
[27] Cox J. T.and Griffeath D.,Ann. Probab.,11(1983) 876.
[28] Dornic I., Chat´e H., Chave J. and Hinrichsen H., Phys. Rev. Lett.,87(2001) 045701.
[29] Santos F. C.andPacheco J. M.,Phys. Rev. Lett.,95 (2005) 098104.
[30] Szolnoki A.andSzab´o G.,EPL,77(2007) 30004.
[31] Perc M. and Szolnoki A., Phys. Rev. E, 77 (2008) 011904.
[32] http://figshare.com/articles/Competition of imitation and innovation for different temptation values/5715682.
[33] http://figshare.com/articles/ the Moor has done his duty the Moor may go effect/5715691.
[34] Szolnoki A., Szab´o G. and Czak´o L., Phys. Rev. E, 84(2011) 046106.
[35] http://figshare.com/articles/Cyclic dominance between microscopic states/5715697.
[36] Kerr B., Riley M. A., Feldman M. W. and Bohannan B. J. M.,Nature,418(2002) 171.
[37] Szolnoki A., Mobilia M., Jiang L.-L., Szczesny B., Rucklidge A. M.andPerc M.,J. R. Soc. Interface,11 (2014) 20140735.
[38] Rulquin C.andArenzon J. J.,Phys. Rev. E,89(2014) 032133.
[39] Reichenbach T., Mobilia M. and Frey E., Nature, 448(2007) 1046.
[40] Avelino P. P., Bazeia D., Losano L., Menezes J.and de Oliveira B. F.,Phys. Rev. E,89(2014) 042710.
[41] Roman A., Dasgupta D.andPleimling M.,J. Theor.
Biol.,403(2016) 10.
[42] P´erez T., Klemm K.and Egu´ıluz V. M.,Sci. Rep.,6 (2016) 21128.
[43] L¨utz A. F., Cazaubiel A.andArenzon J. J.,Games, 8(2017) 10.
[44] Bazeia D., Menezes J., de Oliveira B. F.andRamos J. G. G. S.,EPL,119(2017) 58003.
[45] Dobramysl U., Mobilia M., Pleimling M. and T¨auber U.,J. Phys. A: Math. Theor.,51(2018) 063001.
[46] Szolnoki A., Wang Z., Wang J. and Zhu X., Phys.
Rev. E,82(2010) 036110.