S1
Supporting information
Quantitative tracking of the oxidation of black phosphorus in the few- layers regime
Juan Gómez-Pérez1, Balázs Barna1, Ildikó Y. Tóth1,2, Zoltán Kónya1,3, Ákos Kukovecz1,2*
1 Department of Applied and Environmental Chemistry, University of Szeged, H-6720 Szeged, Rerrich Béla tér 1, Hungary.
2 SZTE "Lendület" Porous Nanocomposites Research Group, H-6720 Szeged, Rerrich Béla tér 1, Hungary.
3 MTA-SZTE Reaction Kinetics and Surface Chemistry Research Group, H-6720 Szeged, Rerrich Béla tér 1, Hungary.
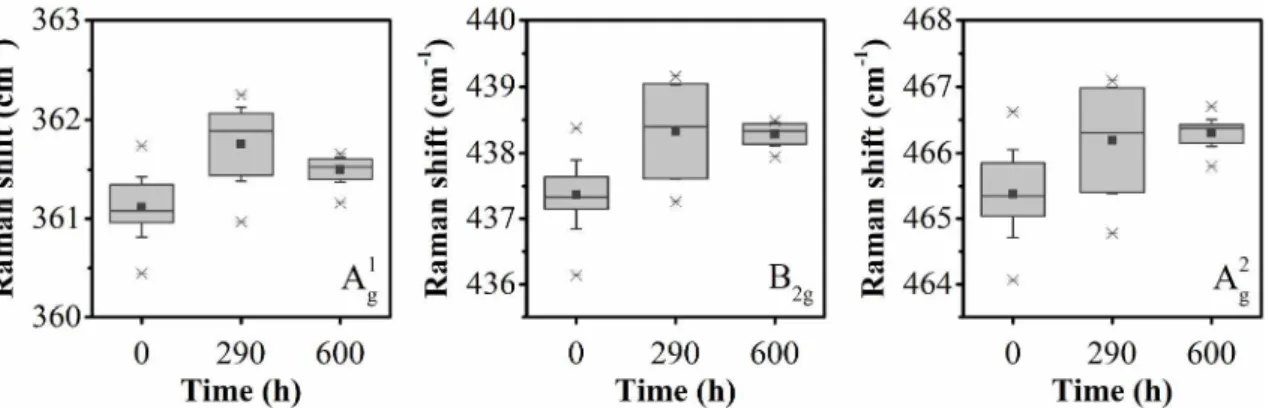
A sample BP2S acetone was drop casted on a silicon wafer and slight blueshift of the Raman signal was again observed during 600 hours of air oxidation (Figure S1).
Figure S1. Raman shift aging for a sample (BP2S acetone) drop casted on a silicon wafer for each vibrational mode.
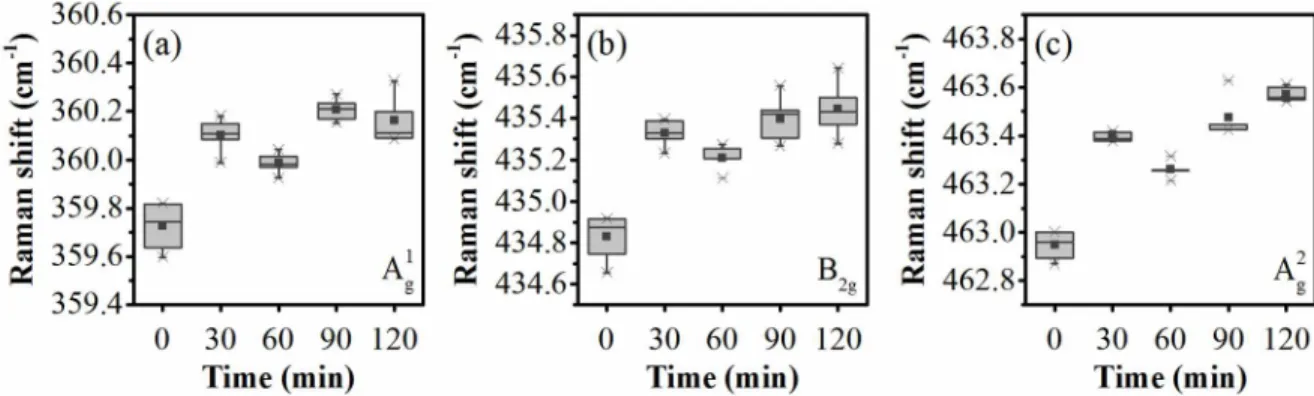
A second sample was drop casted on glass and placed into the temperature- controlled probe stage (HFS600E, Linkam). The stage was tightly closed and heated up to 100 °C in argon atmosphere (200 mL/min) as pretreatment. After 5 minutes pretreatment, the argon flow was interrupted and the oxygen flow was set to 10 mL/min. The Raman shift was measured every 30 min (Raman Senterra II, λ= 532 nm, nominal power = 12.5 mW) after the argon flow was interrupted and the results are shown in Figure S2. The measured
S2 blueshift followed a similar trend as seen for air oxidized samples A1g < B2g < A2g but the slopes from the linear fit were approximately 120 times larger for the samples measured in O2 atmosphere at 100 °C than for the air oxidized samples.
Figure S2. In situ Raman shift in oxygen atmosphere at 100 °C. A1g (a), B2g (b) and A2g (c) vibrational modes. Linear fitting slopes for the mean values: 0.195 cm-1/h, 0.2586 cm-1/h and 0.2652 cm-1/h for the A1g, B2g and A2g vibrational modes, respectively. The boxes enclose the median between the 25th and 75th percentiles. The square represents the mean value and asterisk represent the max. and min. values.
The blueshift was almost two times larger for the B2g and A2g modes than for A1g. We attributed these differences to the position of the dangling and bridging oxygen on the few- layers black phosphorus as it has a bonding preference over the zigzag ridge at 44.5° away from the phosphorene surface1,2. The linear fitting slopes for the mean values during oxidation at 100 °C with 2 h oxygen exposition were 0.195 cm-1/h, 0.2586 cm-1/h and 0.2652 cm-1/h for the A1g, B2g and A2g vibrational modes, respectively. The fact that the blueshift was not visible in every analyzed sample might be attributed with differences in the number of oxygen atoms per unit cell prior the measurements were taken and the calculations showing that oxygen-poor compounds are almost similar to the pristine counterpart3.
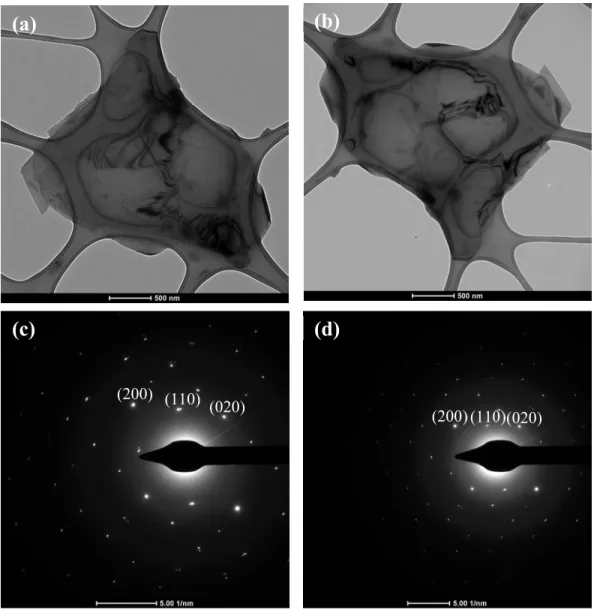
Several flakes were studied in TEM before and after exposition to pure oxygen gas in a controlled atmosphere at 70 °C. Electron diffractions were collected to compare the lattice parameters. In Figure S3 one flake is shown before and after oxygen exposition for 2 hours at 70 °C. The lattice parameters were calculated from the electron diffraction
S3 patterns. No significant change was recorded in the lattice constants (a and b) in agreement with previous results4.
Figure S3. Lattice constants comparison. TEM image of a flake before (a) and after (b) pure oxygen exposition at 70 °C. Electron diffractions from the flake in (a-b) before (c) and after (d) oxygen exposition.
XRD patterns were collected from samples casted on a silicon wafer in order to examine the lattice distances perpendicular to the surface. The plane (004) was selected to evaluate the lattice distance in the stacking direction as there are no peaks interfering from the silicon wafer substrate. XRD patterns are shown in Figure S4, and the peak corresponding to the plane (004) was visible at the same 2-theta position after consecutive
(200) (110) (020)
(200)(110)(020)
(a) (b)
(c) (d)
S4 heating (up to 250 °C, heating rate 10 °C/min) and cooling cycles (room temperature).
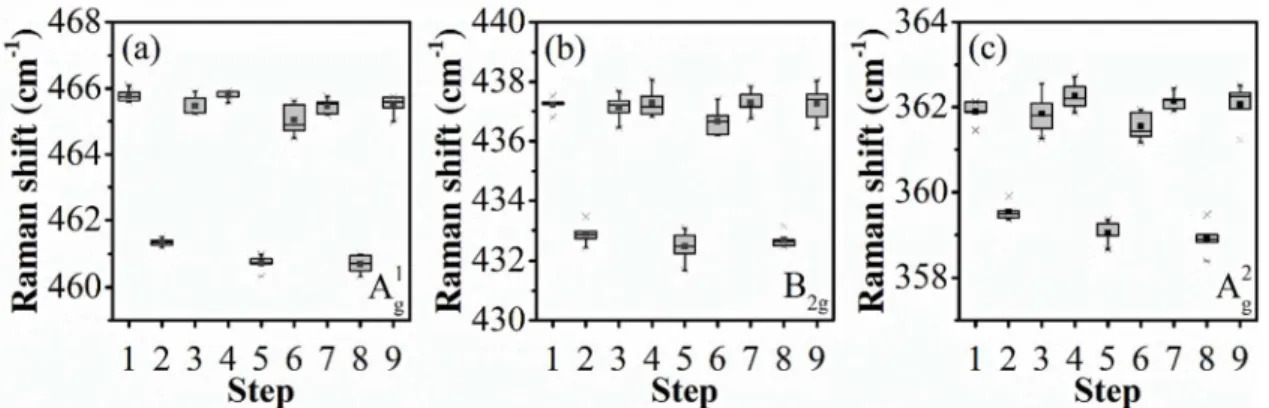
Raman spectra were collected at 100 °C and 250 °C during the heating-cooling cycles and the results are shown in Figure S5. These results confirm the reversibility of the thermal process described in the main text and discard major distortions in the stacking direction for the unit cell. From the XRD pattern, the monolayer thickness is calculated to be 5.4 Å in agreement with literature review5,6 for pristine materials. In complement with the results from Figure S3, the lattice constants calculated for the exfoliated materials are a: 3.3 Å, b:
4.3 Å and c: 10.8 Å.
Figure S4. XRD patterns taken at room temperature from acetone-exfoliated black phosphorus (BP2S) casted on silicon wafer. Between each consecutive cycle, the sample was heated up to 250 °C and cooled down to room temperature. CuKα; λ: 1.54 Å
Figure S5. Raman shift temperature dependence on cyclic temperature sweep. Raman shift spectra from steps 1, 3, 4, 6, 7 and 9 were taken at 100 °C. spectra from steps 2, 5 and 8 were taken at 250 °C. Vibrational modes A1g, B2g and A2g are depicted in figure a, b and c,
S5 respectively. The boxes enclose the median between the 25th and 75th percentiles. The square represents the mean value and asterisk represent the max. and min. values.
During the Raman shift temperature dependence measurements, 4 repetitions were collected at each temperature, as detailed in Figure S6 for the temperature range 300 K to 400 K. The variation in the peak center position is dominated by the stage temperature while the fluctuations caused by the laser local heating are less significant.
Figure S6. Detail for the Raman spectra dispersion in the temperature range 300 K to 400
K. (A1g mode) (a), zigzag direction (B2g mode) (b) and armchair direction (A2g mode) (c).
Figure S7 shows a repetition of the Raman shift temperature dependence with an independent sample from the Fig. 5 in the main document. As for the main document an anomalous behavior is detected at approx. 500 K but exclusively in the stacking direction (A1g mode). This is evidence that the processes detected in the thermal analysis is located perpendicular to the surface.
Figure S7. Raman shift temperature dependence for the sample BP4S acetone. Calculated lattice constants of black phosphorus as a function of temperature (black)7. Reciprocal of the Raman shift (peak position) for each vibrational mode (blue). Raman shift temperature
S6 dependence in the stacking direction (A1g mode) (a), zigzag direction (B2g mode) (b) and armchair direction (A2g mode) (c) of the BP unit cell.
References
1. Wang C-X, Zhang C, Jiang J-W, Rabczuk T. The Effects of Vacancy and Oxidation on Black Phosphorus Nanoresonators. Nanotechnology. 2017,28,135202.
2. Ziletti A, Carvalho A, Campbell DK, Coker DF, Castro Neto AH. Oxygen defects in phosphorene. Phys Rev Lett. 2015,114(4),26–9.
3. Malyi OI, Sopiha K V., Draxl C, Persson C. Stability and electronic properties of phosphorene oxides: from 0-dimensional to amorphous 2-dimensional structures.
Nanoscale. 2017,9(7),2428–35.
4. Gómez-Pérez J, Kónya Z, Kukovecz Á. Acetone improves the topographical homogeneity of liquid phase exfoliated few-layer black phosphorus flakes.
Nanotechnology. 2018,29(365303),0–15.
5. Favron A, Gaufres E, Fossard F, Phaneuf-L’Heureux A-L, Tang NY-W, Levesque PL, et al. Photooxidation and quantum confinement effects in exfoliated black phosphorus. Nat Mater. 2015,14(8),826–32.
6. Castellanos-Gomez A, Vicarelli L, Prada E, Island JO, Narasimha-Acharya KL, Blanter SI, et al. Isolation and characterization of few-layer black phosphorus. 2D Mater. 2014,1(2),025001.
7. Villegas CEP, Rocha AR, Marini A. Anomalous Temperature Dependence of the Band Gap in Black Phosphorus. Nano Lett. 2016,16(8),5095–101.