CERS-IE WORKING PAPERS | KRTK-KTI MŰHELYTANULMÁNYOK
INSTITUTE OF ECONOMICS, CENTRE FOR ECONOMIC AND REGIONAL STUDIES, BUDAPEST, 2020
Does the unemployment rate moderate the well-being disadvantage of the unemployed? Within-region estimates
from the European Social Survey
GÁBOR HAJDU – TAMÁS HAJDU
CERS-IE WP – 2020/35
September 2020
https://www.mtakti.hu/wp-content/uploads/2020/09/CERSIEWP202035.pdf
CERS-IE Working Papers are circulated to promote discussion and provoque comments, they have not been peer-reviewed.
Any references to discussion papers should clearly state that the paper is preliminary.
Materials published in this series may be subject to further publication.
ABSTRACT
Using eight waves of the European Social Survey, we analysed how the local unemployment rate influences the well-being disadvantages of the unemployed. We estimate region fixed effects and slopes models that, unlike the standard region fixed effects approach, provide an unbiased estimate of the cross-level interaction term (the term between being unemployed and the unemployment rate). We find that the satisfaction of unemployed people (relative to employed people) is lower when the unemployment rate is higher. The results are similar for the depression scores, but the differences are smaller and insignificant regarding the happiness scores. Our results do not support the “social norm of unemployment” hypothesis that states that the negative impacts of unemployment are smaller if the unemployment rate is higher. In contrast, these results are in line with the argument that worse re-employment perspectives in high-unemployment regions may be particularly harmful to unemployed people. We note that these results do not contradict the claim that, in regions with a weaker social norm to work, unemployed people may be more satisfied.
Instead, the results suggest that the unemployment rate is not a good proxy for the social norm to work.
JEL codes: I31, J64
Keywords: unemployment; subjective well-being; unemployment rate; life satisfaction; happiness; European Social Survey
Gábor Hajdu
Institute for Sociology, Centre for Social Sciences, 1097 Budapest, Tóth Kálmán u. 4, Hungary
e-mail: hajdu.gabor@tk.mta.hu Tamás Hajdu
Institute of Economics, Centre for Economic and Regional Studies, 1097 Budapest, Tóth Kálmán u. 4, Hungary
e-mail: hajdu.tamas@krtk.mta.hu
Módosítja-e a munkanélküliségi ráta a munkanélküliek jólléti hátrányát?
Régiószintű becslések a European Social Survey adatain HAJDU GÁBOR – HAJDU TAMÁS
ÖSSZEFOGLALÓ
A European Social Survey nyolc hullámát felhasználva azt vizsgáljuk, hogy hogyan befolyásolja a helyi munkanélküliségi ráta a munkanélküliek jólléti hátrányát. Régió fix hatásokat és a munkanélküli státusz hatásának régió-specifikus eltéréseit figyelembe vevő modelleket használunk, amelyek a sztenderd régió FE modellekkel ellentétben torzítatlanul becsülik az egyéni munkanélküli státusz és a munkanélküliségi ráta közti interakció együtthatóját. Eredményeink szerint a munkanélküliek (foglalkoztatottakhoz viszonyított) élettel való elégedettsége annál alacsonyabb, minél magasabb a helyi munkanélküliségi ráta. Az eredmények hasonlóak, ha függő változóként a depresszió tüneteit mérő pontszámot használjuk, de a különbségek kisebbek és inszignifikánsak a boldogság esetében. Eredményeink nem támasztják alá a „munkanélküliség társadalmi normája” hipotézist, ami azt feltételezi, hogy a munkanélküliség negatív hatása kisebb, ha a munkanélküliségi ráta magasabb.
Ezzel éppen ellentétben az eredmények azzal az értelmezéssel vannak összhangban, ami azt hangsúlyozza, hogy a rosszabb elhelyezkedési lehetőségek miatt a magas munkanélküliségi ráta különösen negatívan érintheti a munkanélkülieket.
Megjegyezzük, hogy az eredmények nem mondanak ellent annak a feltételezésnek, hogy azokban a régiókban, ahol a munkavégzésre vonatkozó társadalmi norma gyengébb, a munkanélküliek elégedettebbek lehetnek. Ezzel szemben arra utalnak, hogy a munkanélküliségi ráta nem jó proxy-ja a munkavégzésre vonatkozó társadalmi normának.
JEL: I31, J64
Kulcsszavak: munkanélküliség; szubjektív jóllét; munkanélküliségi ráta; élettel való
elégedettség; boldogság; European Social Survey
1
Does the unemployment rate moderate the well-being disadvantage of the unemployed? Within-region estimates from the European Social Survey
Gábor Hajdua,*, Tamás Hajdub
a Institute for Sociology, Centre for Social Sciences, Hungary, ORDIC: 0000-0002-7943-1668
b Institute of Economics, Centre for Economic and Regional Studies, Hungary, ORCID: 0000-0002-9533-7727
*corresponding author, e-mail: hajdu.gabor@tk.mta.hu
Abstract
Using eight waves of the European Social Survey, we analysed how the local unemployment rate influences the well-being disadvantages of the unemployed. We estimate region fixed effects and slopes models that, unlike the standard region fixed effects approach, provide an unbiased estimate of the cross-level interaction term (the term between being unemployed and the unemployment rate). We find that the satisfaction of unemployed people (relative to employed people) is lower when the unemployment rate is higher. The results are similar for the depression scores, but the differences are smaller and insignificant regarding the happiness scores. Our results do not support the “social norm of unemployment” hypothesis that states that the negative impacts of unemployment are smaller if the unemployment rate is higher. In contrast, these results are in line with the argument that worse re-employment perspectives in high-unemployment regions may be particularly harmful to unemployed people. We note that these results do not contradict the claim that, in regions with a weaker social norm to work, unemployed people may be more satisfied. Instead, the results suggest that the unemployment rate is not a good proxy for the social norm to work.
Keywords: unemployment; subjective well-being; unemployment rate; life satisfaction; happiness; ESS
Funding
This work was supported by the MTA Cooperation of Excellences Program: Mobility Research Center. Gábor Hajdu was supported by the János Bolyai Research Scholarship of the Hungarian Academy of Sciences. The funders had no role in study design, data collection and analysis, decision to publish, or preparation of the manuscript.
Conflict of interest
The authors declare that they have no conflict of interest.
2
1. Introduction
Unemployment is a traumatic life experience that decreases well-being (Frey & Stutzer, 2002a;
Kassenboehmer & Haisken-DeNew, 2009; Winkelmann & Winkelmann, 1998). However, its effect is hypothesized to be substantially influenced by the social context. The “social norm of unemployment”
hypothesis states that the negative impacts of unemployment are smaller if the local unemployment rate is higher (Clark, 2003; Clark & Oswald, 1994). This argument is based on the idea that, when the unemployment rate is high, the social norm to work is weaker. Therefore, unemployed people suffer less severely from a negative reputation because the social costs of unemployment are lower (Clark, 2003; Frey & Stutzer, 2002b). Additionally, because people evaluate their own situation relative to others, when the unemployment rate is high and people observe more jobless people around them, they may think that being unemployed is not (or not only) their own fault but that it is the result of external causes beyond their control (e.g., the general state of the economy) (Frey & Stutzer, 2002b).
Contrary to the “social norm of unemployment” hypothesis, another argument states that the local unemployment rate is negatively correlated with the well-being of the unemployed. The rationale for this argument is that the shortage of jobs in high-unemployment regions is particularly harmful because the labour market perspectives of unemployed individuals are worse than in other regions with lower unemployment rates and higher numbers of available jobs. Furthermore, the high unemployment rate may have a demoralizing effect on unemployed people and their job search behaviours (Oesch & Lipps, 2013).
Results regarding the “social norm of unemployment” hypothesis are mixed. Although the first studies supporting the “social norm of unemployment” hypothesis (Clark, 2003; Clark & Oswald, 1994) are highly cited and have also been (at least partially) replicated by other studies (Clark et al., 2010;
Gathergood, 2013; Stam et al., 2016), several other studies have demonstrated no support for the hypothesis (Buffel et al., 2017; Chadi, 2014; Drydakis, 2015; Eichhorn, 2013; Heggebø & Elstad, 2018;
Oesch & Lipps, 2013; Stavrova et al., 2011). These conflicting results may be explained as being the result of methodological issues and data limitations. Specifically, the conclusions from these studies are often based on data from a single country or from two countries, which may limit the generalizability of the results. Other studies used data from cross-sectional surveys; therefore, they estimated between-country effects instead of within-country effects. In these settings, omitted variable biases may be more pronounced. Most importantly, even studies that estimated within- country effects may estimate biased cross-level interactions (the interaction term that shows the relationship between the well-being of the unemployed individuals and the unemployment rate). As Gieselmann and Schmidt-Catran (2019) demonstrated, standard country fixed effects models can yield biased coefficients on cross-level interactions if correlated country-level moderators are unspecified.
This indicates that answering the question about the relationship between the unemployment rate and the satisfaction of unemployed people requires models that are suitable for the analysis of repeated cross-sectional surveys and cross-level interactions.
In this paper, we analyse the relationship between the regional unemployment rate and the subjective well-being of the unemployed by using eight waves of the European Social Survey (ESS). The ESS covers 16 years (2002-2017), which provides a large within-region variation of the unemployment rate over time. This enables us to estimate within-region effects instead of between-region differences. Our main research question is whether the effects of unemployment on subjective well-being decrease or increase when the unemployment rate is higher.
We contribute to the literature in four ways. First, we use repeated cross-national surveys that cover 28 countries, 213 regions, and 16 years, which means that we can estimate the effects of the unemployment rate from within-region changes. Second, we use region fixed effects and slopes
3
models when estimating the association between the well-being effect of being unemployed and the unemployment rate. This is an important feature of our study because we show that the empirical method affects the conclusions of the analysis. Third, we use both life satisfaction and happiness as outcome variables. Previous studies are not consistent in the dependent variable used. Moreover, labour force status may be more strongly related to life satisfaction than to happiness (Helliwell &
Putnam, 2004; Knabe et al., 2010, 2016). Therefore, an examination of the two dependent variables may yield interesting explanations for the mixed results of the previous studies. Last, in addition to conducting the region-level analysis, we also use country-level data as a robustness test. Previous papers conducted either country-level or region-level analyses; however, it is possible that national and local macro-level variables can influence individual well-being in different ways.
2. Theoretical background
2.1. Previous literature
Two possible mechanisms may link the local unemployment rate to the well-being of unemployed people. The “social norm of unemployment” hypothesis states that the detrimental effects of being unemployed are lower when the local unemployment rate is higher (Clark, 2003; Clark & Oswald, 1994). It has been argued that, when the social norm to work is weaker, the unemployed experience less social pressure from other people, i.e., they suffer less from a negative reputation (Clark, 2003;
Frey & Stutzer, 2002b). The most important element of this hypothesis is that the level of unemployment is a good proxy for the social norm to work. Another aspect of this hypothesis is that people compare themselves to others; when the unemployment rate is higher, they observe more jobless people around themselves. Therefore, their own state of joblessness may seem to be less of their own fault than that of the general state of the economy (Frey & Stutzer, 2002b). Additionally, according to Falk and Knell (2004), people themselves choose their reference groups (to some extent) and tend to compare themselves to other similar individuals. This means that the reference group of the unemployed may more likely consist of other people who are out of work; i.e., their relative position may be only slightly changed.
In contrast to the “social norm of unemployment” hypothesis, one can argue that the unemployment rate may be negatively correlated with the happiness of the unemployed. A higher unemployment rate means that unemployed people will compete with more people for the available jobs, which reduces their likelihood of being hired. Additionally, this may have an additional demoralizing effect on the unemployed and their job search behaviours (Oesch & Lipps, 2013).
The first studies that formulated the “social norm of unemployment” hypothesis were the Clark and Oswald study (1994) and the Clark study (2003). Clark and Oswald (1994) analysed the first wave of the British Household Panel Study (BHPS) and observed that mental distress is slightly, but not significantly, higher among unemployed individuals in low-unemployment areas than among unemployed individuals in high-unemployment areas. Clark (2003), with the use of the seven waves of the BHPS, observed that the mental distress gap between the employed and the unemployed individuals is smaller in regions with higher levels of unemployment. However, in fixed effects models, a positive correlation between the well-being of the unemployed individuals and the regional unemployment rate was found only for men.
Recent studies have demonstrated (partial) support for these results. Gathergood (2013), similarly to Clark and Oswald (1994) and Clark (2003), used the BHPS data and indicators of psychological health as outcome variables. He found that the impact of unemployment on individual mental health problems are negatively related to the local unemployment rate. Clark et al. (2010), by using German data (23 waves of the German Socio-Economic Panel) and life satisfaction as the outcome variable,
4
found some support for the “social norm of unemployment” hypothesis for men but not for women.
Using cross-sectional Australian data, Shields et al. (2009) found that the life satisfaction levels of unemployed men are higher if they reside in areas with high unemployment rates; however, they observed no such effects for women. Susanlı (2018), using Turkish cross-sectional data, reported a positive effect of the local unemployment rate on the life satisfaction levels of unemployed females and a negative, but insignificant, effect on the satisfaction levels of unemployed males.
In contrast to these results, other studies have concluded that the higher the local unemployment rate, the more severe the burden of being unemployed is. Oesch and Lipps (2013) found that German unemployed women suffer more when the ambient unemployment rate is high. However, for German men and Swiss women and men, they observed no similar effects. When the unemployment rate was high, a higher negative effect of unemployment was observed in Germany (Chadi, 2014) and in Greece (Drydakis, 2015). In addition, Buffel et al. (2017), Eichhorn (2013), and Stavrova et al. (2011) found that the unemployment rate did not moderate the detrimental effects of unemployment.
Heggebø and Elstad (2018) examined the relationship between country-level unemployment rates and the effects of unemployment on self-rated health. Although they found that the negative health effects of unemployment are more pronounced in low-unemployment countries, their results suggest that compositional changes could be the main reason for this pattern. This means that when the unemployment rate is higher, highly skilled workers with relatively good health may also lose their jobs, which may explain why the self-rated health of the unemployed is better in high-unemployment countries.
In summary, the empirical results of previous studies are mixed, which suggests that the local unemployment rate is not a good proxy for the social norm to work. This claim is supported by the fact that some studies have reported a positive correlation between the unemployment rate and the social norm to work (Stam et al., 2016; Stavrova et al., 2011).1
2.2 Methodological considerations
The mixed results regarding the effects of the unemployment rate on the well-being of unemployed people may be the result of methodological issues and data limitations. Most of the studies that have demonstrated support for the “social norm of unemployment” hypothesis were based on data from a single country, which indicates that the external validity (generalizability) of the results may be somewhat limited. However, it is worth noting that conflicting results have also emerged with the use of data from the same country (Chadi, 2014; Clark et al., 2010; Oesch & Lipps, 2013). Other studies have used data from cross-sectional surveys, i.e., they estimate between-country effects instead of within-country effects, which may result in more pronounced omitted variable bias.
For the analysis of the effects of a macro-level variable, a more suitable approach would be to use large repeated cross-national surveys and region (or country) fixed effects (FE) models, wherein the effect is identified from within-region (within-country) variation over time (for a general overview, see Gangl (2010)). Importantly, even the models that estimate within-region effects may lead to biased coefficients if cross-level interactions are in the focus of the research. As the study from Giesselmann and Schmidt-Catran (2019) demonstrated, region FE models can provide biased estimations of coefficients on cross-level interactions if correlated macro-level moderators are unspecified or unobserved.
1 It is worth noting that papers using direct measures of social norm to work tend to support the “social norm of unemployment” hypothesis (Eichhorn, 2013; Stavrova et al., 2011; Stutzer & Lalive, 2004).
5
The conclusions from this study indicate several things relevant to our investigation. For example, the standard approach of the analysis of how the unemployment rate moderates the well-being effect of unemployment is the estimation of a region FE model. However, in this specification, the interaction term between unemployment and unemployment rate may be biased if the effect of being unemployed differs between regions for reasons other than the varying unemployment rates. For example, Clark (2003, p. 335) noted that “regional differences in labour market policies […] may make unemployment more attractive in one area than another” (see also Lalive et al., 2006, 2011; Voßemer et al., 2018). However, the region dummies pick up only those differences in labour market policies that equally affect all people (the employed and the unemployed individuals). Specifically, in a simple region FE model, if differences in labour market policies (or any other unobserved macro-level factors) affect the well-being of the unemployed and the employed individuals in a different manner, then the interaction term we are interested in (being unemployed × the unemployment rate) will pick up the effects of the differences in these factors as well. In other words, if the unemployment rate is correlated with other (unobserved) macro-level variables that influence the effects of being unemployed, then the interaction term between being unemployed and the unemployment rate will not only reflect the moderating effect of the unemployment rate but will also reflect other differences in the unobserved macro-level variables between the regions. To control for the region-specific effects of unemployment, interaction terms between the region dummies and the (individual) unemployment variable must be included in the model.2 (See Giesselmann and Schmidt-Catran (2019) for a detailed discussion.)
In summary, answering the question about the relationship between the unemployment rate and the satisfaction of the unemployed requires regression models that are suitable for the analysis of repeated cross-sectional surveys and cross-level interactions.3
3. Data and methods
3.1. Data
We use eight waves of the European Social Survey. This dataset covers 16 years (2002-2017), 28 countries, and 213 regions4 where we have data for unemployment rates. We use the data of countries and regions participating in at least five waves5. We restrict our sample to respondents aged between 18 and 65 years who were employed or unemployed. Respondents with missing life satisfaction, happiness, or labour force status are excluded. We also exclude respondents with missing demographic characteristics (age and sex) or with a missing interview date. The final sample size is 130,264 for the region-level analysis (137 regions from 19 countries).
We have two outcome variables: life satisfaction and happiness. Life satisfaction is measured by the question “All things considered, how satisfied are you with your life as a whole nowadays?”, with
2 With a similar logic, if the individual-level unemployment variable is correlated with (unobserved) macro-level variables that influence the effect of the unemployment rate, then the interaction terms between the region dummies and the unemployment rate must be included in the model to control for the effect heterogeneity in the unemployment rate.
However, as Giesselmann and Schmidt-Catran (2019, p. 211) noted, controlling for the macro-level effect heterogeneity in the individual level variable may be sufficient because the correlation between the micro-level variable (in this case, being unemployed) and an unobserved macro-level variable that moderates the effect of the macro-level variable of interest is low in most cases.
3 We know of only one paper that used multilevel random-intercept-and-slope models (Stavrova et al., 2011). This empirical approach is similar to the within-country estimator that is suitable for repeated cross-sectional surveys and cross-level interactions; however, as Giesselmann and Schmidt-Catran (2019) noted, controlling for the effect heterogeneity by using random slopes may be insufficient to partial out unobserved moderation effects. Moreover, this paper was based on only two waves of the World Values Survey, i.e., it calculated within-country variation as the difference between two time points.
This empirical approach provided only small changes over a short time period.
4 We used NUTS2 regions where they were available. For three countries, NUTS1 regions were used.
5 Regions with less than 15 observations (individuals) in a given wave were excluded.
6
answers ranging from 0 (extremely dissatisfied) to 10 (extremely satisfied). Happiness is measured by the question “Taking all things together, how happy would you say you are?”, with answers ranging from 0 (extremely unhappy) to 10 (extremely happy).
Regarding their labour force status, respondents were asked “Which of these descriptions applies to what you have been doing for the last 7 days?”, with categories “in paid work”, “unemployed and actively looking for a job”, “unemployed, wanting a job but not actively looking for a job”, and other categories (e.g., “in education”, “permanently sick or disabled”, “retired”, “doing housework, looking after children or other persons”). For the main analysis, we use the data of individuals who were in paid work or who were unemployed. We group the two unemployed categories into a single
“unemployed” variable. Overall, approximately one-tenth of the respondents (9.4%) are unemployed in the main sample. The regional unemployment rates are derived from the Eurostat database. We use yearly region-level unemployment rates for individuals aged 25 years or over6. The region-level unemployment rate varies between 1.4 per cent and 33.4 per cent, whereas the average within-region range is 7.02 per cent. The summary statistics of the main variables are provided in Table A1.
3.2. Empirical strategy
We estimate the effect of unemployment, unemployment rate, and their interaction by applying region fixed effects and slopes model, as proposed by Giesselmann and Schmidt-Catran (2019). In this specification, the region-specific effects of unemployment are controlled for. Specifically, we estimate the following equation via ordinary least squares:
0 1 2 3
irt irt rt irt rt irt rt r y m r irt irt
Y U UR U UR X M U
where Yict denotes the subjective well-being of individual i, who lives in region r at time t (year y, month m). Uirt is an indicator variable that takes the value 1 if the respondent is unemployed and the value 0 if the respondent is employed. URrt is the unemployment rate in region r at time t. Xirt is a vector of the personal characteristics of individual i, and Mrt is a vector of the control variables of region r. Region FE (
r) controls for the time-invariant region characteristics, year FE (y) controls for the changes over time that similarly affected every region, and month FE (
m) accounts for time- invariant seasonal differences. The interaction terms between the region dummies and the indicator variable for being unemployed (
rUirt) control for unobserved heterogeneity in the effects of Uirt across the regions.We use post-stratification weights in combination with another weight variable that sets the sample size of every country to be equal. The standard errors are robust to heteroskedasticity and clustered at the regional level.
The key coefficient is
3, which captures how the unemployment rate moderates the well-being effect of being unemployed. A positive point estimation of
3 would support the social norm of unemployment hypothesis, i.e., that the well-being disadvantage of the unemployed is lower when the unemployment rate is higher7. A negative point estimation of
3 would support the alternative6 bit.ly/unemp_rate_regional (database code: lfst_r_lfu3rt)
7 In other words, a positive 3 would demonstrate that the well-being of the unemployed (relative to those of the employed) is higher when the unemployment rate is higher.
7
theory that states that the well-being disadvantage of the unemployed is higher when the unemployment rate is higher.
4. Results
The results are shown in Table 1. Panel A reports the results for life satisfaction, and Panel B reports the results for happiness. First, we estimate a standard region FE model, where only an interaction term between being unemployed and the unemployment rate is included, whereas the interaction terms between the region dummies and the variables of the interaction term we are interested in (unemployment and unemployment rate) are not included (Panel A, Column 1). The unemployed are 1.2 points less satisfied than the employed, whereas the main effect of the unemployment rate is
−0.040. This indicates that a 10 percentage point increase in the unemployment rate is associated with a decrease of 0.4 points in life satisfaction. The coefficient of the interaction term between being unemployed and the unemployment rate is close to zero. The next model controls for heterogeneity in the effect of unemployment between regions. In Column 2, the coefficients of being unemployed and the unemployment rate are similar to those in Column 1. However, the size of the coefficient of the interaction term is considerably larger (−0.020) and significant at the 5 percent level. This model shows that the unemployed are less satisfied with their life when the unemployment rate is higher. A 10 percentage point increase in the unemployment rate is associated with a 0.2 points (or 16.2 per cent) increase in the negative effects of being unemployed. Therefore, our preferred specification (Column 3) controls for the heterogeneity in the effect of unemployment between regions and includes additional controls for region-level characteristics and a rich set of individual-level control variables (including income). This model shows that being unemployed is associated with an almost 1 point lower satisfaction, even if household income and relative income are controlled for. Moreover, the coefficient of the interaction term is −0.026 and is significant at the 1 percent level, which indicates that when the unemployment rate is 10 percentage points higher, the unemployed are 0.26 points less satisfied. (This corresponds to 26.5 per cent of the negative effects of being unemployed.)
Panel B in Table 1 shows a similar picture regarding happiness. Previous studies have suggested that unemployment affects life satisfaction more strongly than affective well-being (Helliwell & Putnam, 2004; Knabe et al., 2010, 2016). In line with these findings, the coefficients in Panel B are usually smaller than those in Panel A. In Column 1, the coefficient of the interaction term is positive and significant (p=0.025). One interpretation for this result could be that being unemployed is less detrimental when there are more fellow unemployed individuals in the region. However, if the heterogeneity of the effect of being unemployed between regions is controlled for, the coefficient of the interaction term is zero (Column 2). The results of the full model (Column 3) suggest that when the unemployment rate is higher, the happiness of the unemployed is lower (-0.008), but this coefficient is insignificant (p=0.318).
In summary, the models that are more likely to provide unbiased estimates of the interaction between being unemployed and the unemployment rate do not support the “social norm of unemployment”
hypothesis. In contrast, the life satisfaction of unemployed people is higher when the unemployment rate is higher, whereas their happiness seems to be less closely related to the unemployment rate.
8
Table 1: Unemployment rate and subjective well-being; results from OLS regressions.
(1) (2) (3)
Standard region FE + Region ×
Unemployed Full controls (A) Life satisfaction
Unemployed -1.191 -1.263 -0.969
(0.054) (0.007) (0.014)
[0.000] [0.000] [0.000]
Unemployment rate -0.040 -0.038 -0.030
(0.005) (0.005) (0.005)
[0.000] [0.000] [0.000]
Unemployed × Unemp. rate -0.004 -0.020 -0.026
(0.006) (0.010) (0.009)
[0.492] [0.039] [0.006]
N 130264 130264 130264
Adj. R-Square 0.181 0.184 0.237
(B) Happiness
Unemployed -0.865 -0.900 -0.648
(0.036) (0.006) (0.011)
[0.000] [0.000] [0.000]
Unemployment rate -0.028 -0.027 -0.022
(0.005) (0.005) (0.005)
[0.000] [0.000] [0.000]
Unemployed × Unemp. rate 0.010 -0.002 -0.008
(0.005) (0.008) (0.008)
[0.025] [0.849] [0.318]
N 130264 130264 130264
Adj. R-Square 0.118 0.121 0.193
Individual controls Yes Yes Yes
Region controls No No Yes
Additional individual controls No No Yes
Income controls No No Yes
Region FE, Year FE, Month FE Yes Yes Yes
Region × Unemployed No Yes Yes
Robust standard errors clustered at the regional level are in parentheses, and p-values are in brackets. Individual controls:
age, squared age, sex, education, settlement, minority, born in the country. Region controls: log GDP, log population, education (25-64-year-olds with tertiary education), life expectancy, at-risk-of-poverty rate, inflation rate (country-level, monthly, with 4 lags). Additional individual controls: legal marital status, living with a partner, meeting with friends, activity limitation, household size, religiousness, frequency of attending religious services. Income controls: log equivalent household income, relative income (as percentage of the country-level average income).
4.1. Robustness
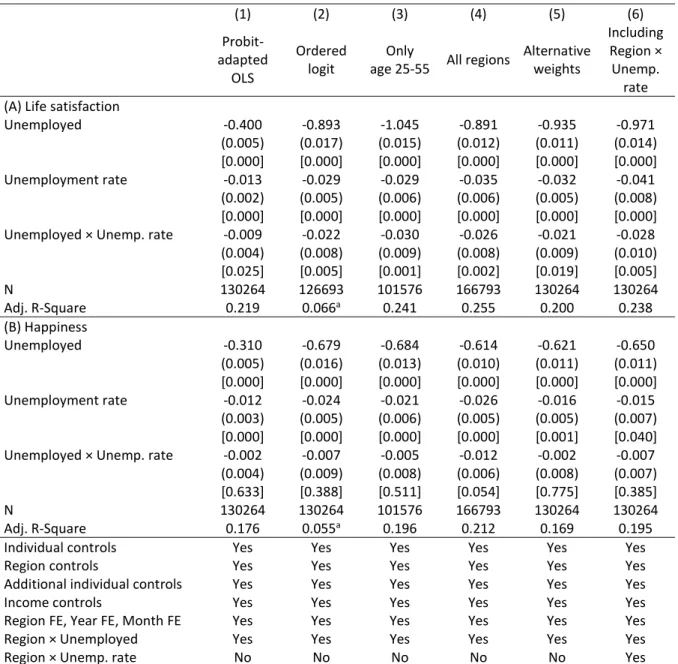
We test the robustness of our preferred specification (Column 3 in Table 1) by using alternative estimation methods, by changing the sample, by using alternative specifications, and by allowing a non-linear relationship between subjective well-being and the unemployment rate.
First, we use probit-adapted OLS regression (van Praag & Ferrer-i-Carbonell, 2008) that cardinalizes the discrete life satisfaction variable (measured on the 0-10-point scale) by assuming that satisfaction is normally distributed. Using this cardinalized satisfaction variable, a standard OLS estimation can be applied. Next, we estimate an ordered logit model rather than OLS. Using these models does not change the conclusions (Column 1 and Column 2 in Table 2).
9
Next, we restrict the sample to respondents between the ages of 25 and 55. We also use a sample in which every country and every region are included, regardless of how many waves they had participated in. These results are shown in Column 3 and Column 4 in Table 2. Neither of these changes alters the results.
We also use an alternative weighting method. We multiplied the post-stratification weights with the population size weights provided by the ESS. Using this combination of weights, we ensure that each country is represented in proportion to its population size. The alternative weights do not change the results (Column 5 in Table 2).
In Column 6, we use a “full” region FE and slopes model by controlling for the effect heterogeneity in the unemployment rate; i.e., we include interaction terms between the region dummies and the unemployment rate. As we expected in advance, based on Giesselmann and Schmidt-Catran (2019), controlling only for the macro-level effect heterogeneity in the individual-level variable is sufficient because controlling for the unobserved heterogeneity in the effect of the unemployment rate does not provide different results compared to those presented in Column 3 in Table 1.
Last, we re-estimate our model using different functional forms for the unemployment rate. In our baseline specification, it is entered linearly. For the re-estimation, we use categorical unemployment rates and a quadratic specification. These results are depicted in Figure A1. The estimated relationships are similar to the results of the linear specifications.
National and local macro-variables may influence individual well-being in different ways (Pittau et al., 2010). Hence, we also use country-level data.8 In this analysis, we include countries that participated in at least five waves of the ESS. The sample size is 147,128 (19 countries). The results, which are shown in Table A2, are similar to those of the region-level analysis. Thus, we can conclude that the choice of the macro-level variable does not considerably affect the conclusions.
In an additional analysis, we experiment with an alternative outcome variable. Three waves of the ESS consisted of the 8-item Center for Epidemiologic Studies Depression Scale (CES-D).9 It is a valid, reliable, and widely used measure of symptoms of depression (Huppert et al., 2009; Radloff, 1977; Steffick, 2000). Respondents were asked about their experiences of positive and negative emotions in the past week using 1-4 Likert item-response codes. High scores on the CES-D scale (ranging from 8 to 32) indicate more symptoms associated with depression, i.e., lower psychological well-being.
8 We use monthly, seasonally adjusted country-level unemployment rates for persons aged 25-74 years from the Eurostat database (bit.ly/unemp_rate_country; database code: une_rt_m).
9 Wave 3, wave 6, and wave 7 consisted of the CES-D questions. The sample covers 10 years (2006-2015). The sample size is 42,718 (115 regions, 16 countries). Only regions that participated in all three waves are included.
10
Table 2: Unemployment rate and subjective well-being, robustness of the results
(1) (2) (3) (4) (5) (6)
Probit- adapted
OLS
Ordered
logit Only
age 25-55 All regions Alternative weights
Including Region × Unemp.
rate (A) Life satisfaction
Unemployed -0.400 -0.893 -1.045 -0.891 -0.935 -0.971
(0.005) (0.017) (0.015) (0.012) (0.011) (0.014) [0.000] [0.000] [0.000] [0.000] [0.000] [0.000]
Unemployment rate -0.013 -0.029 -0.029 -0.035 -0.032 -0.041
(0.002) (0.005) (0.006) (0.006) (0.005) (0.008) [0.000] [0.000] [0.000] [0.000] [0.000] [0.000]
Unemployed × Unemp. rate -0.009 -0.022 -0.030 -0.026 -0.021 -0.028 (0.004) (0.008) (0.009) (0.008) (0.009) (0.010) [0.025] [0.005] [0.001] [0.002] [0.019] [0.005]
N 130264 126693 101576 166793 130264 130264
Adj. R-Square 0.219 0.066a 0.241 0.255 0.200 0.238
(B) Happiness
Unemployed -0.310 -0.679 -0.684 -0.614 -0.621 -0.650
(0.005) (0.016) (0.013) (0.010) (0.011) (0.011) [0.000] [0.000] [0.000] [0.000] [0.000] [0.000]
Unemployment rate -0.012 -0.024 -0.021 -0.026 -0.016 -0.015
(0.003) (0.005) (0.006) (0.005) (0.005) (0.007) [0.000] [0.000] [0.000] [0.000] [0.001] [0.040]
Unemployed × Unemp. rate -0.002 -0.007 -0.005 -0.012 -0.002 -0.007 (0.004) (0.009) (0.008) (0.006) (0.008) (0.007) [0.633] [0.388] [0.511] [0.054] [0.775] [0.385]
N 130264 130264 101576 166793 130264 130264
Adj. R-Square 0.176 0.055a 0.196 0.212 0.169 0.195
Individual controls Yes Yes Yes Yes Yes Yes
Region controls Yes Yes Yes Yes Yes Yes
Additional individual controls Yes Yes Yes Yes Yes Yes
Income controls Yes Yes Yes Yes Yes Yes
Region FE, Year FE, Month FE Yes Yes Yes Yes Yes Yes
Region × Unemployed Yes Yes Yes Yes Yes Yes
Region × Unemp. rate No No No No No Yes
Robust standard errors clustered at the regional level are in parentheses, and p-values are in brackets. Alternative weights:
post-stratification weights × population size weights. Both weights are provided by the ESS. Control variables: see Table 1.
a Pseudo R-Square.
Table A3 reports the results of the analysis in which we use the depression score as the outcome variable. These results are very similar to those of the main models. The unemployed have higher depression scores than the employed. In Column 1, without controlling for the between-region heterogeneity in the effect of unemployment, the coefficient of the interaction term is negative but insignificant. Once we control for the unobserved heterogeneity in the effect of unemployment between regions (Column 2), the coefficient of the interaction term becomes positive. Most importantly, in the full model (Column 3), the coefficient is much larger; however, it is imprecisely estimated (p=0.197). This suggests that the psychological well-being of the unemployed is worse when the unemployment rate is higher.
4.2. Heterogeneity
The previously described results are consistent with the hypothesis stating that the shortage of jobs in high-unemployment regions decreases the well-being of the unemployed because their labour market
11
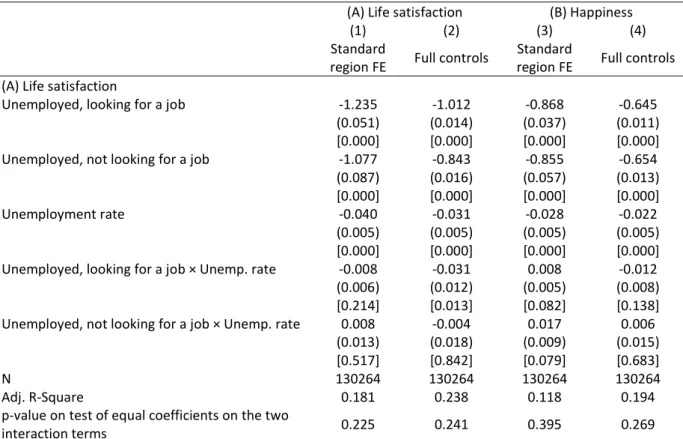
prospects are worse compared to those in regions or time periods with lower unemployment rates. If the interpretation of our results is correct, then we should observe a stronger negative effect for unemployed individuals who are actively looking for a job than for unemployed individuals who are not looking for a job. The ESS questionnaire differentiates between these two groups: (i) unemployed people who are looking for a job and (ii) unemployed people who are not looking for a job. We estimate similar models to the main models, but we use these two groups of unemployed individuals instead of a single “unemployed” category. In our sample, 6.7 per cent are unemployed looking for a job, whereas 2.7 per cent are unemployed not looking for a job.
Table 3 shows the results. We present the results of our preferred specification, but we also show the standard FE models for comparison. For life satisfaction, the analysis suggests that a higher unemployment rate increases the negative effect of being unemployed when looking for a job (Column 2). In contrast, unemployed individuals who are not looking for a job are not less satisfied when the unemployment rate is higher. Regarding happiness, we observe similar differences (Column 4). The coefficient of the interaction term between being unemployed, looking for a job and the unemployment rate is negative; however, it is insignificant at the 10 percent level (p=0.138). In contrast, the interaction term between being unemployed, not looking for a job and the unemployment rate is positive but insignificant. These results suggest that differences in available jobs and job prospects may explain why higher levels of unemployment decrease the well-being of the unemployed to a greater extent.
Table 3: Heterogeneity by type of unemployment
(A) Life satisfaction (B) Happiness
(1) (2) (3) (4)
Standard
region FE Full controls Standard
region FE Full controls (A) Life satisfaction
Unemployed, looking for a job -1.235 -1.012 -0.868 -0.645
(0.051) (0.014) (0.037) (0.011)
[0.000] [0.000] [0.000] [0.000]
Unemployed, not looking for a job -1.077 -0.843 -0.855 -0.654
(0.087) (0.016) (0.057) (0.013)
[0.000] [0.000] [0.000] [0.000]
Unemployment rate -0.040 -0.031 -0.028 -0.022
(0.005) (0.005) (0.005) (0.005)
[0.000] [0.000] [0.000] [0.000]
Unemployed, looking for a job × Unemp. rate -0.008 -0.031 0.008 -0.012 (0.006) (0.012) (0.005) (0.008)
[0.214] [0.013] [0.082] [0.138]
Unemployed, not looking for a job × Unemp. rate 0.008 -0.004 0.017 0.006 (0.013) (0.018) (0.009) (0.015)
[0.517] [0.842] [0.079] [0.683]
N 130264 130264 130264 130264
Adj. R-Square 0.181 0.238 0.118 0.194
p-value on test of equal coefficients on the two
interaction terms 0.225 0.241 0.395 0.269
Robust standard errors clustered at the regional level are in parentheses, and p-values are in brackets. Control variables:
Column 1 and 3 (Standard region FE): see Column 1 in Table 1; Column 2 and 4 (Full controls): see Column 3 in Table 1.
12
5. Conclusions
In this paper, we analysed the relationship between the unemployment rate and the subjective well- being of the unemployed using eight waves of the European Social Survey. We found that the satisfaction of unemployed people (relative to employed people) is lower when the unemployment rate is higher. In general, a similar picture was observed for depression scores; however, smaller and insignificant differences were found regarding happiness. This latter finding is in line with the results of previous studies suggesting that unemployment has different impacts on affective and cognitive well-being (Helliwell & Putnam, 2004; Knabe et al., 2016).
Our findings do not support the “social norm of unemployment” hypothesis that states that the negative impact of unemployment is smaller if the unemployment rate is higher. In contrast, the results are in line with the argument that emphasizes that a shortage of jobs and worse re-employment perspectives in high-unemployment regions may be particularly harmful to the unemployed. This interpretation is supported by regression models in which we observed stronger negative effects for unemployed individuals who are actively looking for a job compared to unemployed individuals who are not looking for a job. We note that other studies analysing the relationship between the contextual unemployment rate and health or mortality obtained similar results. They concluded that the higher the unemployment rate is, the lower the health of the unemployed (Iversen et al., 1987; Niedzwiedz et al., 2019; Noelke & Beckfield, 2014). This suggests that a higher unemployment rate indicates an environment that makes the lives of the unemployed more miserable, rather than a weaker social norm to work and a lower level of social stigmatization.
We emphasize that our results do not contradict the claim that the unemployed may be less unhappy in regions with a weaker social norm to work than in regions with a stronger social norm to work.
Instead, these results suggest that the unemployment rate is not a good proxy for the social norm to work. Indeed, previous studies have demonstrated that direct measures of the social norm to work are positively correlated with the unemployment rate (Stam et al., 2016; Stavrova et al., 2011).
Furthermore, studies that used direct measures of social norm (instead of the unemployment rate) tend to support the “social norm of unemployment” hypothesis (Eichhorn, 2013; Stavrova et al., 2011;
Stutzer & Lalive, 2004). They found that unemployed individuals are facing higher informal social pressures in communities with a stronger social norm to work, which affects their well-being.
Our analysis provides evidence that the empirical method is an important determinant of the findings.
First, the different results for life satisfaction and happiness suggest that the choice of the outcome variable influences the conclusions. Second, we used a region FE and slopes model. This empirical approach is more likely to provide an unbiased estimate of the interaction between unemployment and the unemployment rate. Our results support the claim of Giesselmann and Schmidt-Catran (2019, p. 212) that any model without a systematic specification of macro-level effect heterogeneity (e.g., as a standard region FE model) would not fully eliminate the effects of correlated unobserved macro- level moderators from the cross-level interaction estimates. The results of the standard region FE models were systematically and significantly different from models controlling for heterogeneity in the effect of unemployment between regions. Third, we also note that the results of region-level and country-level analyses were basically identical, which suggests that the local unemployment rate similarly influences the impact of being unemployed to the national-level unemployment rate.
Our study has some limitations. First, we used repeated cross-sectional data; therefore, we cannot draw causal inferences about the effects of unemployment. However, the causal effects of unemployment were not the focus of our research; instead, we were interested in the moderation effect of the unemployment rate on the association between subjective well-being and unemployment. Second, despite the rich set of control variables that we used, a selection effect may
13
exist, i.e., the composition of the unemployed population in regions or periods with a low level and a high level of unemployment may be different. However, intuition and empirical evidence (Gathergood, 2013; Heggebø & Elstad, 2018) suggest that, when unemployment levels increase, individuals with relatively higher social status (e.g., higher income, better re-employment prospects, better coping skills) have a higher proportion among the unemployed. In other words, we can reasonably assume that, if a selection effect exists, then it is a positive selection. This means that the coefficient of the interaction term (unemployed × unemployment rate) may be biased in a positive direction, i.e., the dissatisfaction of the unemployed in high-unemployment periods may be even higher when selection effects are entirely controlled for. Third, although we used region FE and slopes models, we controlled for unobserved time-invariant moderators, but we did not control for unobserved moderation effects at the region-year level.
Overall, these findings imply that the significant well-being disadvantage of the unemployed increases when the unemployment rate is higher. Therefore, social and labour market policies should make more efforts to increase their re-employment prospects, thus improving their work and employability skills, as well as improving their psychological health, in periods and regions with increasing unemployment rates.
References
Buffel, V., Missinne, S., & Bracke, P. (2017). The social norm of unemployment in relation to mental health and medical care use: The role of regional unemployment levels and of displaced workers. Work, Employment and Society, 31(3), 501–521. https://doi.org/10.1177/0950017016631442
Chadi, A. (2014). Regional unemployment and norm-induced effects on life satisfaction. Empirical Economics, 46(3), 1111–1141. https://doi.org/10.1007/s00181-013-0712-7
Clark, A. E. (2003). Unemployment as a Social Norm: Psychological Evidence from Panel Data. Journal of Labor Economics, 21(2), 323–351. https://doi.org/10.1086/345560
Clark, A. E., Knabe, A., & Rätzel, S. (2010). Boon or bane? Others’ unemployment, well-being and job insecurity.
Labour Economics, 17(1), 52–61. https://doi.org/10.1016/j.labeco.2009.05.007
Clark, A. E., & Oswald, A. J. (1994). Unhappiness and Unemployment. Economic Journal, 104(424), 648–659.
https://doi.org/10.2307/2234639
Drydakis, N. (2015). The effect of unemployment on self-reported health and mental health in Greece from 2008 to 2013: A longitudinal study before and during the financial crisis. Social Science & Medicine, 128, 43–
51. https://doi.org/10.1016/j.socscimed.2014.12.025
Eichhorn, J. (2013). Unemployment Needs Context: How Societal Differences between Countries Moderate the Loss in Life-Satisfaction for the Unemployed. Journal of Happiness Studies, 14(6), 1657–1680.
https://doi.org/10.1007/s10902-012-9402-y
Falk, A., & Knell, M. (2004). Choosing the Joneses: Endogenous Goals and Reference Standards. Scandinavian Journal of Economics, 106(3), 417–435. https://doi.org/10.1111/j.0347-0520.2004.00370.x
Frey, B. S., & Stutzer, A. (2002a). Happiness and Economics: How the economy and institutions affect well-being.
Princeton University Press.
Frey, B. S., & Stutzer, A. (2002b). What can economists learn from happiness research? Journal of Economic Literature, 40(2), 402–435. https://doi.org/10.1257/002205102320161320
Gangl, M. (2010). Causal Inference in Sociological Research. Annual Review of Sociology, 36(1), 21–47.
https://doi.org/10.1146/annurev.soc.012809.102702
Gathergood, J. (2013). An Instrumental Variable Approach to Unemployment, Psychological Health and Social Norm Effects. Health Economics, 22(6), 643–654. https://doi.org/10.1002/hec.2831
Giesselmann, M., & Schmidt-Catran, A. W. (2019). Getting the Within Estimator of Cross-Level Interactions in Multilevel Models with Pooled Cross-Sections: Why Country Dummies (Sometimes) Do Not Do the Job.
Sociological Methodology, 49(1), 190–219. https://doi.org/10.1177/0081175018809150
Heggebø, K., & Elstad, J. I. (2018). Is it Easier to Be Unemployed When the Experience Is More Widely Shared?
Effects of Unemployment on Self-rated Health in 25 European Countries with Diverging Macroeconomic Conditions. European Sociological Review, 34(1), 22–39. https://doi.org/10.1093/esr/jcx080
14
Helliwell, J. F., & Putnam, R. D. (2004). The social context of well-being. Philosophical Transactions of the Royal Society B, 359(1449), 1435–1446. https://doi.org/10.1098/rstb.2004.1522
Huppert, F. A., Marks, N., Clark, A., Siegrist, J., Stutzer, A., Vittersø, J., & Wahrendorf, M. (2009). Measuring Well- being Across Europe: Description of the ESS Well-being Module and Preliminary Findings. Social Indicators Research, 91(3), 301–315. https://doi.org/10.1007/s11205-008-9346-0
Iversen, L., Andersen, O., Andersen, P. K., Christoffersen, K., & Keiding, N. (1987). Unemployment And Mortality In Denmark, 1970-80. British Medical Journal (Clinical Research Edition), 295(6603), 879–884. JSTOR.
Kassenboehmer, S. C., & Haisken-DeNew, J. P. (2009). You’re Fired! The Causal Negative Effect of Entry Unemployment on Life Satisfaction. The Economic Journal, 119(536), 448–462.
https://doi.org/10.1111/j.1468-0297.2008.02246.x
Knabe, A., Rätzel, S., Schöb, R., & Weimann, J. (2010). Dissatisfied with Life but Having a Good Day: Time-use and Well-being of the Unemployed. The Economic Journal, 120(547), 867–889.
https://doi.org/10.1111/j.1468-0297.2009.02347.x
Knabe, A., Schöb, R., & Weimann, J. (2016). Partnership, Gender, and the Well-Being Cost of Unemployment.
Social Indicators Research, 129(3), 1255–1275. https://doi.org/10.1007/s11205-015-1167-3
Lalive, R., van Ours, J. C., & Zweimüller, J. (2006). How Changes in Financial Incentives Affect the Duration of Unemployment. The Review of Economic Studies, 73(4), 1009–1038. https://doi.org/10.1111/j.1467- 937X.2006.00406.x
Lalive, R., van Ours, J. C., & Zweimüller, J. (2011). Equilibrium unemployment and the duration of unemployment benefits. Journal of Population Economics, 24(4), 1385–1409. https://doi.org/10.1007/s00148-010- 0318-8
Niedzwiedz, C. L., Thomson, K. H., Bambra, C., & Pearce, J. R. (2019). Regional employment and individual worklessness during the Great Recession and the health of the working-age population: Cross-national analysis of 16 European countries. Social Science & Medicine, 112377.
https://doi.org/10.1016/j.socscimed.2019.112377
Noelke, C., & Beckfield, J. (2014). Recessions, Job Loss, and Mortality Among Older US Adults. American Journal of Public Health, 104(11), e126–e134. https://doi.org/10.2105/AJPH.2014.302210
Oesch, D., & Lipps, O. (2013). Does Unemployment Hurt Less if There is More of it Around? A Panel Analysis of Life Satisfaction in Germany and Switzerland. European Sociological Review, 29(5), 955–967.
https://doi.org/10.1093/esr/jcs071
Pittau, M. G., Zelli, R., & Gelman, A. (2010). Economic Disparities and Life Satisfaction in European Regions. Social Indicators Research, 96(2), 339–361. https://doi.org/10.1007/s11205-009-9481-2
Radloff, L. S. (1977). The CES-D Scale: A Self-Report Depression Scale for Research in the General Population.
Applied Psychological Measurement, 1(3), 385–401. https://doi.org/10.1177/014662167700100306 Shields, M. A., Wheatley Price, S., & Wooden, M. (2009). Life satisfaction and the economic and social
characteristics of neighbourhoods. Journal of Population Economics, 22(2), 421–443.
https://doi.org/10.1007/s00148-007-0146-7
Stam, K., Sieben, I., Verbakel, E., & de Graaf, P. M. (2016). Employment status and subjective well-being: The role of the social norm to work. Work, Employment and Society, 30(2), 309–333.
https://doi.org/10.1177/0950017014564602
Stavrova, O., Schlösser, T., & Fetchenhauer, D. (2011). Are the unemployed equally unhappy all around the world? The role of the social norms to work and welfare state provision in 28 OECD countries. Journal of Economic Psychology, 32(1), 159–171. https://doi.org/10.1016/j.joep.2010.11.002
Steffick, D. E. (2000). Documentation of affective functioning measures in the Health and Retirement Study.
HRS/AHEAD Documentation Report. Survey Research Center, University of Michigan.
Stutzer, A., & Lalive, R. (2004). The role of social work norms in job searching and subjective well-being. Journal of the European Economic Association, 2(4), 696–719. https://doi.org/10.1162/1542476041423331 Susanlı, Z. B. (2018). Life satisfaction and unemployment in Turkey: Evidence from Life Satisfaction Surveys 2004–
2013. Quality & Quantity, 52(1), 479–499. https://doi.org/10.1007/s11135-017-0479-6
van Praag, B. M. S., & Ferrer-i-Carbonell, A. (2008). Happiness Quantified: A Satisfaction Calculus Approach.
Oxford University Press.
Voßemer, J., Gebel, M., Täht, K., Unt, M., Högberg, B., & Strandh, M. (2018). The Effects of Unemployment and Insecure Jobs on Well-Being and Health: The Moderating Role of Labor Market Policies. Social Indicators Research, 138(3), 1229–1257. https://doi.org/10.1007/s11205-017-1697-y
Winkelmann, L., & Winkelmann, R. (1998). Why Are the Unemployed So Unhappy? Evidence from Panel Data.
Economica, 65(257), 1–15. https://doi.org/10.1111/1468-0335.00111
15
Appendix
Table A1: Summary statistics
Mean SD Min Max N
Life satisfaction 7.091 2.085 0 10 130264
Happiness 7.439 1.786 0 10 130264
Working 0.906 0.292 0 1 130264
Unemployed 0.094 0.292 0 1 130264
Regional unemployment rate 6.787 4.374 1.4 33.4 130264
Table A2: Unemployment rate and subjective well-being, country-level analysis, OLS
(1) (2) (3)
Standard country
FE + Country ×
Unemployed Full controls (A) Life satisfaction
Unemployed -1.223 -1.244 -0.926
(0.079) (0.010) (0.022)
[0.000] [0.000] [0.000]
Unemployment rate -0.054 -0.051 -0.030
(0.011) (0.012) (0.011)
[0.000] [0.000] [0.014]
Unemployed × Unemp. rate 0.000 -0.021 -0.026
(0.007) (0.008) (0.008)
[0.995] [0.020] [0.003]
N 147128 147128 147128
Adj. R-Square 0.173 0.175 0.230
(B) Happiness
Unemployed -0.894 -0.897 -0.629
(0.051) (0.013) (0.020)
[0.000] [0.000] [0.000]
Unemployment rate -0.039 -0.037 -0.025
(0.013) (0.014) (0.014)
[0.008] [0.015] [0.106]
Unemployed × Unemp. rate 0.014 -0.004 -0.010
(0.009) (0.008) (0.008)
[0.140] [0.632] [0.249]
N 147128 147128 147128
Adj. R-Square 0.112 0.114 0.189
Individual controls Yes Yes Yes
Country controls No No Yes
Additional individual controls No No Yes
Income controls No No Yes
Country FE, Year FE, Month FE Yes Yes Yes
Country × Unemployed No Yes Yes
Robust standard errors clustered at the country-level are in parentheses, and p-values are in brackets. Individual controls:
age, squared age, sex, education, settlement, minority, born in the country. Country controls: log GDP, log population, education (25-64-year-olds with tertiary education), life expectancy, at-risk-of-poverty rate, inflation rate (monthly, with 4 lags). Additional individual controls: legal marital status, living with a partner, meeting with friends, activity limitation, household size, religiousness, frequency of attending religious services. Income controls: log equivalent household income, relative income (as percentage of the country-level average income).