Relative Visibility of the Diagnostic Catheter
Liza Pelyhe
1,2, Péter Nagy
1,21,2 Budapest University of Technology and Economics, Department of Materials Science and Engineering, Bertalan Lajos u. 7, 1111 Budapest, Hungary
1,2 MTA–BME Research Group for Composite Science and Technology,
Műegyetem rkp. 3, 1111 Budapest, Hungary E-mail: liza@eik.bme.hu, npeter@eik.bme.hu
Abstract: In this study a new algorithm was presented as an objective approach to quantify the relative visibility of diagnostic catheters. This method is suitable for the classification and comparison of diagnostic catheters with different levels of visibility, so as to attain an objective overall picture by measuring a product’s properties, instead of relying on subjective values specified by the manufacturer. Our algorithm can be used when examining the distal section of a diagnostic catheter. Two sampling methods were tested on four diagnostic catheters with same diameter and material, but different shape of the distal end. The first sampling method can only be used in case of shapes that have straight sections at the distal end, but the second sampling method can be used for all types of shape. The first sampling method used a longer rectangular (4 mm x 8.6 mm) sample site and the second sampling method used two shorter rectangular (4 mm x 2.2 mm) sample sites. The two testing methods were used so as to check repeatability and reproducibility (R&R) so as to establish how far measurement repeatability with different measuring equipment, when carried out by different people, tracked differences between the different items being measured. This R&R testing helped us isolate where errors in our testing method might originate. It was established that the first (longer rectangle) sample-testing method had a nearly acceptable degree of variation (R&R% = 11.2), but the second method’s degree (shorter rectangle) of variation was much worse (R&R% = 41). The value for average X-ray visibility obtained with the first method (18.24% ± 1.08%) when compared to the value for the second method (17.60% ± 1.66%), showed a significance level of 5.47%, and this approaches the borderline for significance. Precision and development of the measurement methods presented here will be treated as an integral part of further research so that they can be used equally with diagnostic catheters of all forms and shapes.
Keywords: diagnostic catheter; R&R study; relative visibility; X-ray image analysis
1 Introduction
The cardiovascular disease is the leading cause of death in the European Union. It is caused by atherosclerosis and obturation of the arteries, and it can be corrected using percutaneous coronary intervention [1-3].
Catheters are used in the every day treatment of interventional cardiology. The intravascular catheter is a tubular device with single lumen or multilumen, which is inserted or implanted into the cardiovascular system for diagnostic and/or therapeutic purposes. The catheters are classified into three categories (diagnostic, guide and micro) by Bavry et al, and into five categories (diagnostic, micro, drainage, balloon, and central venous) by Brant et al. [4-6].
The diagnostic catheter is an intravascular catheter, which may be used to inject contrast fluids, record intracardiac pressure, sample blood, or to insert medical devices (e.g. occlusion coils, coaxial inner catheter). The main part of the diagnostic catheter is the distal end (which is inserted into the body first), and the proximal end connects (Figure 1) with a variety of external devices. Different shapes are possible for the distal end in order to make it easier to enter the target area and pass through blood vessels, and also to some extent to ease positioning and recording once in the desired position [4, 7]. The diagnostic catheter is a plastic tube, which is usually made from Teflon®, nylon or polyethylene. In some cases, the diagnostic catheter is made of a metal-reinforced plastic or a wire braid (e.g., including Nitinol, stainless steel) [4, 6, 8-13].
Figure 1
The two ends of the diagnostic catheter [4]
Positioning of the catheter in the body happens during X-ray fluoroscopy, and, because of this, parts of the catheter must have X-ray visibility [4, 14-21]. On the basis of the literature the tip of the distal end or a region nearby can be made of X- ray-opaque material, or a marker of such material can be attached [17-20]. On products from some manufacturers only the tips are made of material with good X-ray visibility [22, 23]; on others the tip and the shaft are either in part or in whole made of highly radiopaque material [24-29]. In some cases the manufacturer does not ensure X-ray visibility [30-32].
According to the ISO 10555-1:2013 section governing the X-ray visibility of diagnostic catheters in the current sense, a measuring method has to be proved suitable, such as ASTM F640-12 or DIN 13273-7 [4, 33-34] According to the
ASTM F640-12 standard, X-ray visibility is qualitatively as well as quantitatively definable. For qualitative definition there should be visual comparison between the sample in the background and a user-defined standard image. In the case of quantitative evaluation, the difference is defined as the optical or pixel density variation between the tested sample and the user-defined standard image. The standard does not define whether measurements take place inside or outside the body: both are possible. In the case of optical density, film is used, and in the case of pixel intensity, digital images are used in the decision [33].
The ASTM F640-12 standard gives guidelines for measuring X-ray visibility, but don’t define specifically which parts of the examined medical device (in this case the diagnostic catheter) should be imaged [33]. The Budapest Technical University Department of Materials Science & Engineering research group numerically defined X-ray visibility in an earlier study on stents, and established the parameters of an image prepared of the examined sample, for an image- analysis method [35-37].
2 Determination of Relative Visibility
Section 1 showed how to carry out qualitative and quantitative measurements of X-ray visibility according to the ASTM F640-12 standard [33]. The qualitative assessment is subjective, while the quantitative measuring process is objective. In this study, an objective numerical measuring method that did not involve simulating in-body use was preferred. Therefore this group’s algorithms needed to based on quantitative measurement, and this is what was attempted. In the research study digital images and measurement by difference in pixel intensity were used, not film and optical intensity. In the standard a measurement method is described which was refined and developed as can be seen in Figure 2.
2.1 X-ray Image from the Diagnostic Catheter
Dage XiDAT XD6600 X-Ray Inspection System was used to provide X-ray images of the catheters used in the research. The images were taken using an accelerating voltage of 90-110 kV; cathode power set at 1.19-1.20 W, and an average frame rate of 32 frames/sec. These parameters match those used in clinical practice.
The length of the diagnostic catheter is usually 100-125 cm. It was decided that the X-ray image should focus on the distal end.
Figure 2
The baseline algorithm of the ASTM F640-12 standard to quantify the visibility
2.2 Selection of Distal End for the Diagnostic Catheter Study
The distal end may have different shapes. Consequently, it was important to find a section of the distal end that was straight. During the study four catheters were examined, on which the manufacturers did not mark parts as having increased X- ray visibility. These were identical in type, material, and outer diameter (d = 2 mm) but had different structures at the distal end.
Although a significant proportion of manufacturers make the tip out of X-ray- absorbent material, in a study like this it was important to examine this zone in case of diagnostic catheters not containing (or not marked by manufacturers as containing) radiopaque material. Up to the height of the tip the first 10 mm (counting from the top of the distal end) was examined. The stereomicroscopic photo of the section of the distal end that was investigated is shown on Figure 4.
The photo was made with an Olympus SZX16® Research stereomicroscope.
Figure 3
The distal end shape of the catheters investigated, X-ray microscope image a) Amplatz Left Curve, b) Femoral Left Curve, c)-d) Left Coronary Bypass Curve
Figure 4
The investigated part of the diagnostic catheter’s distal end, stereomicroscopic photo
In order to have the distal part examined by Ring’s well-understood measurement methods, it was necessary to cut out and edit a grey-scale image with graphics software [35-37]. The examined section has to be placed horizontally so that the length would fill the picture (Figure 5). The height of the picture has to be twice that of the part being inspected with the section under examination being positioned in the middle (Figure 5). A grey-scale and bit-map version has to be made of the image.
Figure 5
a) An X-ray image made of a general sample, indicating the part under examination (dotted line) and with the parameters of the image to be cut out for closer inspection (solid line) (L: the length of the
area under examination; D: the diameter of the area under examination)
b) image edited from the examined area, which is appropriate for determination of X-ray visibility In our case the length was 8.6 mm, and the height was 4 mm, which was twice the catheter diameter (Figure 6a).
Figure 6
a) The first sampling method with a long sampling site, and b) the second sampling method with two shorter sampling sites
However, not all catheters will contain straight sections at the distal end (Figure 7), which meant that we had to find an alternative sampling method to investigate this distal-method variation. Another method this group decided to use was to examine two sampling sites each within a shorter rectangle (Figure 6b). In our case this length was 2.2 mm. The height remained at 4 mm. The first sampling site was 2.2 mm distance from the distal tip, and the second sampling site was 3.2 mm distance from the distal tip.
A statistical test was used to establish the accuracy of the second sampling method (see below). The first sampling method is the base. If the difference between the two methods were not significant (if the significance level were lower than 5%), then first and second sampling methods could be used interchangeably.
Figure 7
X-ray microscope image of pigtail catheter without a straight section on the distal end
2.3 Selection of the Reference Background
The ASTM F640-12 standard separately describes user-defined standards and the background; on the basis of earlier examinations the background was taken as the user-defined standard, comparing it to the image containing the examined part of the sample [33, 35-37]. The factors influencing the imaging were the basic material of the sample and its geometry, and further the X-ray tube voltage and heating element, the size of the focus point, the resolution of the detector, the distance of the ray source and detector, and to some extent the distance between the examined object and the detector. At the time of evaluating these samples the visibility window in itself contained the object being examined, its shadow and other image artefacts. The background to be compared was always taken out of the middle of the examined sample, in the same position, so that any surfacing detector errors should be similar, and influence as little as possible the results produced.
The size of the area of the constructed image containing the sample under study is equal to the size of the image, and must be converted into grey-scale and bitmap format. The dimensions in the first measurement method were 8.6 mm by 4 mm (Figure 8c) and in the second measurement method 2.2 mm by 4 mm (Figure 9d).
Figure 8
One example of the first sampling method’s sample sites
a) The distal end, b) the first 8.6 mm of the distal end, c) the background sample site
Figure 9
One example of the second sampling method’s sample sites
a) The distal end, b) the second sample site 3.2 mm from the distal tip, c) the first 2.2 mm of the distal end, d) the background sample site
2.4 Determination of Visibility Function and Relative Visibility
A computer program written in C was used to determine a visibility function for the pixel intensity of images edited into bitmap format. The software did not give these values per image, but produced these values on the basis of comparison between two images, the main image area under examination and a background reference image. Establishing a visibility function for both images, then
integrating these further with ratios between the two, it determined a relative value for X-ray visibility. These values were placed on a scale of 0 to 100% and showed the visibility of a sample against a background. If the value was zero, then the sample cannot be distinguished from the background reference image.
For the first sampling method, the relative visibility of the catheter was calculated by our software. In case of the second sampling method, the software provides two measured values (i.e. one from the first sampling site, and one from the second sampling site). Therefore, the average of these two greyness values was used to calculate the relative visibility of the diagnostic catheter. Values obtained for visibility are in section 3.
2.5 Algorithm to Determine the Relative Visibility
The baseline algorithm for the determination of the relative visibility of the diagnostic catheter was achieved as described above, using a modified algorithm.
This modified algorithm is shown in Figure 10.
Figure 10
The modified supplemented algorithm for finding relative visibility
2.6 Testing the Algorithm
Mainstream statistics, such as mean and standard deviation, were used in conjunction with non-parametrical probe (Mann-Whitney U test, Kruskal-Wallis test) and repeatability and reproducibility (R&R) studies [38-41].
The goal of the R&R test was to determine the repeatability and reproducibility of the measurement. To determine these properties the two operators on all four samples three times determine X-ray visibility using each of the two methods. One operator uses one sample as a reference background, which does not change in the course of the three measurements. The tilt angle of the tested sample section, and the positioning of the sample piece change. With this the test established what the cause was of larger mistakes in the measurement: the evaluation software, the operator, or the differences between the samples which were assumed to be identical. The final stage was the R&R testing of the whole system. With this method variations over the whole set of measurements were estimated. The two sample-measuring methods were compared by the Mann-Whitney U test. This is the nonparametric equivalent of Student’s test, and can be used for cases where the sample size is between 3 and 20 samples.
3 Inspection of the Algorithm
3.1 Results of the First Sample Method
The results of measurements taken by the two operators can be seen in Table 1.
Table 1
The relative visibility measured by the first sampling method Relative visibility (%)
Sample 1st operator 2nd operator
Average Trial 1 Trial 2 Trial 3 Trial 1 Trial 2 Trial 3
1 18.85 18.85 18.83 18.72 18.71 18.72 18.78±0.07 2 18.66 18.70 18.60 18.44 18.54 18.51 18.58±0.10 3 16.67 16.63 16.73 16.50 16.61 16.65 16.63±0.08 4 18.98 18.94 19.16 18.77 18.94 18.96 18.96±0.12 Average 18.29 18.28 18.33 18.11 18.20 18.21
18.24±1.08 Standard
deviation 1.09 1.10 1.09 1.08 1.07 1.06
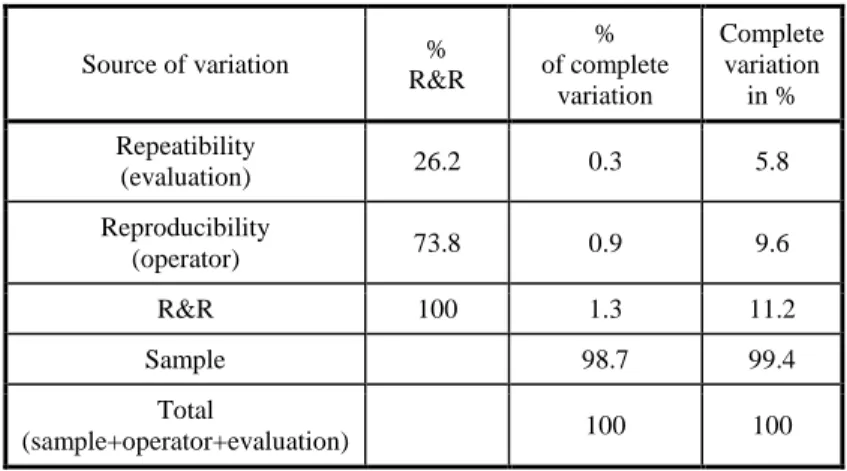
Table 2 contains the sources and the sizes of the variation caused. It can be seen that if we view the samples as homogeneous, then the operators are the cause of 73% of the deviation. If we do not view the samples as homogeneous, then almost all the deviation (98.7%) is caused by the heterogeneity of the samples, and operator-caused deviation is only 0.9%. Heterogeneity appears because of sample 3, the average X-ray visibility of which (16.63% ± 0.08%) deviates by 1.61% from the mean (18.24% ± 1.08%). Measurement uncertainty is 11.2% in the total variation (Table 2), and because of this the measurement method is acceptable with consideration (below 10% would be acceptable).
Table 2
Operator, analysis software, and samples, as contributors to deviation in the 1st method
Source of variation % R&R
% of complete
variation
Complete variation
in % Repeatibility
(evaluation) 26.2 0.3 5.8
Reproducibility
(operator) 73.8 0.9 9.6
R&R 100 1.3 11.2
Sample 98.7 99.4
Total
(sample+operator+evaluation) 100 100
3.2 Results of the Second Sample Method
The visibility values obtained with the second measurement method can be seen in Figure 11. The sample frequency for this method cannot be viewed as homogeneous, since in contrast to the first method here sample 4 deviates significantly. Results also vary among operators. The visibility of the two samples measured is different, which is to say that the diagnostic catheter is not homogeneous. The R&R examination also supports these observations. If the sample frequency is viewed as homogeneous, then deviation among operators, which is to say reproducibility, causes 90% of the deviations (Table 3).
Heterogeneity of the samples causes 83% of the deviations; operators caused deviations in this case of 15%. Measurement uncertainty was 41% of the total variation (Table 3) – in other words this measurement method was not of sufficient quality. With this method the average X-ray visibility was decided at a value of 17.60% ± 1.66%.
Figure 11
Measured X-ray visibility broken down by sample and by sample reading Black column: 1st operator, 1st measured values in sample reading, Dark grey column: 1st operator, 2nd measured values in sample reading,
Mid grey column: 2nd operator, 1st measured values in sample reading, Pale grey column: 2nd operator, 2nd measured values in sample reading
Table 3
Operator, analysis software, and samples, as contributors to deviation in the 2nd method
Source of variation % R&R
% of complete
variation
Complete variation
in % Repeatibility
(evaluation) 10 2 13
Reproducibility
(operator) 90 15 39
R&R 100 17 41
Sample 83 91
Total
(sample+operator+evaluation) 100 100
3.3 Comparison of the Sampling Methods
The measured values underlying the relative visibilities for the first sampling method were compared to the average of each pair of values of relative visibility measured by the second sampling method. This was done using the Mann- Whitney U test (Figure 12). The significance level was 5.47%. This approaches the 5% significance level from above, which cannot be viewed as a significant deviation, but also cannot be overlooked.
Figure 12
Comparison of values by the two sampling method
3.4 Limitations of the Sampling Methods
The limitation of the first sampling method was the need for a relatively long (about 10 mm) straight section from the distal tip. Not all diagnostic catheters will have section with these parameters; therefore this sampling method was not used for all diagnostic catheters.
The limitation of the second sampling method is if the density changes along the length of the diagnostic catheter, the average visibility of the two sample sites can be different from a result generated by data from the larger sample site. Insofar as it is possible to use this method with every diagnostic catheter, then in the near future repeatability and reproducibility will allow better thought-through, more refined devices with reduced sizes of operator or device error.
Taking these conclusions into consideration, the first sampling method should be preferred wherever possible.
Conclusions
In this article a new algorithm for quantification of diagnostic catheter visibility has been presented. This algorithm is also suitable for classification and comparison of X-ray visibility. The first and most important step in the use of this algorithm was the selection of the sample site in each case. Two sampling methods were presented: one with one large (8.6 mm x 4 mm) sampling site and the other with two smaller (2.2 mm x 4 mm) sampling sites. The second sampling method was necessary in order to measure those diagnostic catheters that lack a straight section at the distal end, as in this case the first sampling method is unsuitable. Both sampling methods were tested on four diagnostic catheters with same material and diameter, but different shapes of distal end. The first sampling method is nearly acceptable in terms of statistical significance but the second sample method falls further short and a diagnostic catheter test that was independent of the shape would be desirable. The two methods currently are not interchangeable; the significance level is near the boundary though, at 5.47%.
A further research goal is to develop and make more precise the first, but even more the second, sample examination method, so as to be able to appropriately compare them; with that the X-ray visibility of diagnostic catheters available on the current market would become comparable.
In the near future two sampling from the background will be use in case of the second sampling method, or three-three in case of both sampling method. The average of the three measures in case of first sampling method and the average of the six (three-three for the two shorter sampling) in case of the second sampling method can characterise the relative visibility of the diagnostic catheter.
The aim of this study was the clarification and the completion of the ASTM F640-12’s baseline algorithm used in this group’s earlier research to provide an objective means to quantify the relative visibility of the diagnostic catheters. To achieve this, our algorithm should be repeatable, reproducible, and follow a series of simple steps so that anyone can perform the quantification process for all shapes of diagnostic catheter.
Acknowledgements
This work is connected to the scientific programme of the "Development of quality-oriented and harmonised R+D+I strategy and functional model at BME"
project. This project is supported by the New Hungary Development Plan (Project ID: TÁMOP-4.2.1/B-09/1/KMR-2010-0002).
References
[1] Bognár, E., Ring, Gy., Marton, H. Zs., Dobránszky, J., Ginsztler, J.:
Polyurethane Coating on Coronary Stents. Key Engineering Materials, 345- 346 (2007) 1269-1272
[2] Károly, D., Kakasi, Z., Bognár, E., Szabadíts, P.: Investigation of Functional Properties of Coronary Stent Systems. Proceedings of YSESM, 11th Youth Symposium on Experimental Solid Mechanics, 30. May – 2. Juni, 2008, Brasov, Rumania, pp. 216-221
[3] Kern, M. J.: The Interventional Cardiac Catheterization Handbook. 2nd ed.
Philadelphia: Elsevier Inc; 2004
[4] ISO: Intravascular Catheters – Sterile and Single-Use Catheters -- Part 1:
General Requirements, ISO 10555-1:2013, International Organisation for Standardisation
[5] Bavry, A. A., Kumbhani, D. J.: Indications and Techniques of Percutaneous Procedures: Coronary, Peripheral and Structural Heart Disease. London:
Springer Healthcare; 2012
[6] Brant, W. E., Helms, C.: Fundamentals of Diagnostic Radiology.
Philadelphia: Lippincott Williams & Wilkins; 2012
[7] U.S. Government Printing Office 2014, GPO’s Federal Digital System.
Availabe from: < http://www.gpo.gov/fdsys/search/home.action>. [31 Jan.
2014]
[8] Thomsen, S. H., Webb, A. W. J.: Contrast Media: Safetiy Issues and ESUR Guidelines. Berlin: Springer-Verlag; 2009
[9] Mauro, M. A., Murphy, K., Thomson, K., Venbrux, A., Zollikofer, C. L.:
Image-guided Interventions. Philadelphia: Elsevier Health Sciences; 2008 [10] Lange, R. A., Hillis, L. D.: Diagnostic Cardiac Catheterisation. Circulation.
107 (2003) 111-113
[11] Lange, M. R., Pepin, H. J.: Braided Angiography Catheter Having Full Length Radiopacity and Controlled Flexibility, US Patent 6077258, June 20 2010
[12] Keigo, G.: Tube Provided with a White Bismuth Salt Containing Bismuth Compound Mixture as X-ray Opaque Agent, US Patent 5085863, February 04 1992
[13] Merhi, M. W.: Angiography Catheter, WIPO Patent Application WO/2012/094195, July 12 2012
[14] U.S. Food and Drug Administration 2013, Radiation-Emitting Products.
Available from: <http://www.fda.gov/Radiation-EmittingPro- ducts/RadiationEmittingProductsandProcedures/MedicalImaging/Medi- calX-Rays/ucm115354.htm>. [21 January 2014]
[15] U.S. Food and Drug Administration 2013, Radiation-Emitting Products.
Available from: <http://www.fda.gov/Radiation-EmittingPro- ducts/RadiationEmittingProductsandProcedures/MedicalImagiMe/Medi- calX-Rays/ucm2005915.htm>. [21 January 2014]
[16] Michalíková, M., Bednarčíková, L., Petrík, M., Živčák, J., Raši, R.: The Digital Pre-Operative Planning of Total Hip Arthroplasty. Acta Polytechnica Hungarica, 7 (2010) 137-152.
[17] Moore, S. W.: Vascular and Endovascular Surgery: A Comprehensive Review, 8th Edition. Philadelphia: Elsevier Health Sciences; 2012
[18] Zeitler, E., Ammann, E.: Radiology of Peripheral Vascular Diseases: With 198 Tables. Berlin: Springer-Verlag; 2000
[19] Schneider, P.: Endovascular Skills: Guidewire and Catheter Skills for Endovascular Surgery, Second Edition. Lincoln: Taylor & Francis Group;
2008
[20] Estafanous, G. F., Barash, G. P., Reves, G., J.: Cardiac Anesthesia:
Principles and Clinical Practice. Philadelphia: Lippincott Williams &
Wilkins; 2001
[21] Davies, H. A., Brophy, M. C.: Vascular Surgery. London: Springer-Verlag;
2006
[22] Cordis Corporation 2013, Products, Available from:
<http://www.cordis.com/sites/www.cordis.com.emea/files/product_pdfs/DI DIAGNOST_SOLUTIONS_Brochure.pdf>. [04 February 2014]
[23] .be medical 2014, Products, Available from:
<http://www.bemedical.be/products/vascular_surgery/angiography_cathete ca.html>. [04 February 2014]
[24] Terumo Europe N.V 2014, Products, Available from: <http://www.terumo- europe.com/endovascular/products/radifocus-guide-wire-m-
radiopaque.php>. [04 February 2014]
[25] Terumo Europe N.V 2014, Products, Available from: <http://www.terumo- europe.com/endovascular/products/radifocus-angiographic-catheter.php>.
[04 February 2014]
[26] Merit Medical Systems 2014, Products, Available from:
<http://www.merit.com/products/default.aspx?code=cardiocath>.
[04 February 2014]
[27] AngioDynamics 2014, Products, Available from:
<http://www.angiodynamics.com/uploads/pdf/10-10-09-01-53-45- Angiographic%20Folder.pdf>. [04 February 2014]
[28] Oscor Inc. 2013, Medical Devices, Available from:
<http://www.oscor.com/medical-devices/catheters-angios-classic.html>.
[04 February 2014]
[29] pfm medical ag. 2013, Products, Available from:
<http://www.pfmmedical.com/en/productcatalogue/pfm-
medical/catheter/diagnostic_catheter_occlu_marker-1/index.html>.
[04 February 2014]
[30] Boston Scientific Corporation 2014, Products, Available from:
<http://www.bostonscientific.com/interventional-
cardiology/products.html#leftHandColumnSelect2%28%27category_proce proc%27,%27Diagnostic%20Catheters%27%29;filter%28%27category_pr procedu%27,10125683%29;>. [04 February 2014]
[31] B. Braun Melsungen AG. 2014, Produkte, Available from:
<http://www.bbraun.de/cps/rde/xchg/bbraun-
de/hs.xsl/products.html?id=00020741570000000043&prid=PRID00004480
>. [04 February 2014]
[32] Medtronic, Inc. 2014, For Healthcare Professionals, Available from:
<http://www.medtronic.com/for-healthcare-professionals/products- therapies/cardiovascular/catheters/catheters/index.htm>.
[04 February 2014]
[33] ASTM Standard F640, 2012, “Standard Test Methods for Determining Radiopacity for Medical Use,” ASTM International, West Conshohocken, PA, 2012, DOI: 10.1520/F0640-12, www.astm.org
[34] DIN: Catheters for Medical Use - Part 7: Determination of the x-ray attenuation of catheters; Requirements and testing, DIN 13273-7, Deutsches Institut für Normung e. V
[35] Ring, Gy.: Pre-clinical Evaluation of Coronary Stents and Other Endoprotheses. Ph.D. dissertation, Dept. of Materials Science and Engineering, BME, Budapest, Hungary, 2010
[36] Bán, M., Ring, Gy., Bognár, E., Dobránszky, J.: Comparison of Different Parameter Settings in Stent Radiopacity Examination. Proceeding of DAS, 28th Danubia-Adria Symposium on Advances in Experimental Mechanics, 28. Sept. – 01. Oct., 2011, Siófok, Hungary, pp. 60-61
[37] Ring, Gy., Bognár, E., Bálint Pataki, Zs., Dobránszky J.: Different properties of coronary stent. Anyagok világa. 7 (2007) 1-7
[38] Bárdossy, Gy., Fodor, J.: Assessment of the Completeness of Mineral Exploration by the Application of Fuzzy Arithmetic and Prior Information.
Acta Polytechnica Hungarica, 2 (2005) 15-31
[39] Semanco, P., Marton, D.: Simulation Tools Evaluation using Theoretical Manufacturing Model. Acta Polytechnica Hungarica, 10 (2013) 193-204 [40] BME Faculty of Chemical Technology and Biotechnology 2014, Oktatás,
Available from: <http://oktatas.ch.bme.hu/oktatas/konyvek/vegymuv- /VM_Torzs/Minoseg/Minosegmenedzsment/levelezo/meroeszk_kep_1.pdf
>. [04 February 2014]
[41] Óbuda University, Donát Bánki Faculty of Mechanical and Safety Engineering 2013, AGI-Gépgyártástechnológiai Szakcsoport, Available from: <http://www.bgk.uni-obuda.hu/ggyt/targyak/seged/bagmt14nnb- /5gy.pdf>. [04 February 2014]