3
Velocity Distributions in Potassium Molecular Beams*
P. M. MARCUS and J. H. McFEE Carnegie Institute of Technology
Pittsburgh, Pennsylvania
I. Introduction
This paper describes velocity distribution measurements made on potassium molecular beams with a fixed-frequency, variable phase velocity selector. The measurements are believed to be of high ac- curacy, and were taken over a wide range of oven pressures (0.84 x 10~3 mm Hg to 0.58 mm Hg).
The work described here is a continuation of work by A. Bennett and I. Estermann. The molecular beam apparatus was designed and con- structed by Bennett1 who also used the equipment to measure the velocity distribution in potassium beams. Comparison of his results with the Maxwell-Boltzmann distribution showed the marked effects of oven-slit geometry on the velocity distributions, and indicated a substantial deficiency of low-velocity molecules at moderately high oven pressures.1 In all these measurements there was an uncertainty in the transit time of molecules passing through the selector of about 3% of the most probable transit time. If the measured and calculated most probable transit-times agreed to within this uncertainty, a factor was applied which made the position of the peaks coincide. Since Bennett's work, a number of refinements (which are described below) have been made which permit more accurate velocity measurements.
In particular, a more accurate method of transit-time measurement has been devised, and no adjustment is now made in the position of the maximum of the measured velocity distribution when comparing it to the theoretical distribution. The uncertainty in the transit time is now less than 1 % of the most probable transit time. Comparison of the present measurements with theoretical curves derived from the
* Work supported by the Office of Naval Research.
43
4 4 P . M . M A R C U S A N D J . H . M G F E E
Maxwell distribution indicates a considerable deficiency of low-velocity molecules at the highest oven pressures. At the lowest oven pressures there is good agreement between the measured and theoretical curves.
Measurements of the velocity distribution in a potassium beam after reflection from a solid surface are now being attempted. Comparison of these with the direct-beam measurements should yield detailed in- formation about the energy exchange between the beam and the surface.
II. Description of Apparatus (a) General
Figure 1 is a plan view of the beam apparatus. An expanded scale is used for the slits to show their relative size. The "collimating" slit
TOP VIEW OF BEAM APPARATUS
OVEN
« — 0 * 4 — » CM
/
OVÏ Î N ROOK
« 32.5 » CM
Y
L
A
VELOCITY-SELECTOR DISCS
CM
BEAM ROOM
DETECTOR FILAMENT
OVEN SLIT WIDTH 0-OOMM COLLIMATING SLIT WIDTH 0-40 MM DETECTOR FILAMENT WIDTH 0-34 MM
Fig. 1. T o p view of b e a m a p p a r a t u s showing dimensions. E x p a n d e d scale was used for slits a n d detector filament.
is narrow enough to provide sufficient isolation of the beam room from the oven room, but it does not define the beam. The beam is defined by the oven slit and the detector filament so that the effective path of the beam can be changed by moving the detector filament. The oven, velocity selector and detector are mounted on an optical bench and aligned optically, then inserted in a cylindrical vacuum chamber. The circular plate on the left divides the chamber into the separate oven, room and beam room.
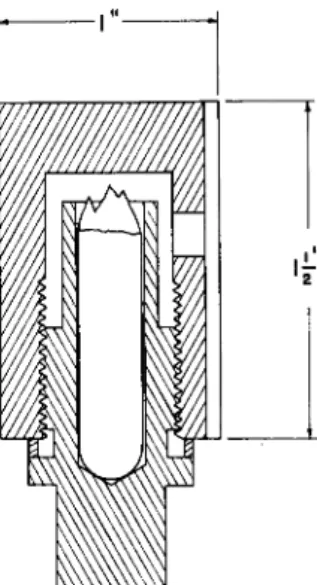
(b) Oven
T h e oven shown in Fig. 2 is made entirely from copper to minimize thermal gradients. T h e potassium, sealed in a glass capsule, is placed in a hole in the plug. T h e front end of the capsule is broken off by pressure when the plug is tightened. T h e plug is chrome-plated to prevent j a m m i n g of copper threads. Clogging of the slits due to creep of potassium is minimized by holding the capsule in a vertical position.
OVEN
CROSS-SECTION
Fig. 2. Oven cross-section (side view) showing threaded plug holding capsule of potassium.
(c) Oven Slit
In all the measurements described in this paper, thin foil (0.001 in.
stainless steel) slit edges were used. T h e oven slit construction is prac- tically identical with the " i d e a l " slit used by Miller and Kusch.2
(d) Detector
A surface-ionization detector was used, consisting of a strip 2 cm long x 0.3 m m wide x 0.002 in. thick, rolled out from suitable Pt, M o , or W wire. Pt and M o were found to be most satisfactory for measuring weak beams since the positive-ion background current emitted by these metals is very small in comparison to W. (Various W specimens were tried, including some " u n d o p e d " specimens by courtesy of Mr. J . S.
Petro of the General Electric Company L a m p Wire and Phosphors Dept.)
46 P . M. M A R C U S A N D J . H . MCFEE
A direct test for possible velocity sensitivity of the detecting filament was made by taking two successive velocity spectra differing only by substitution of a Pt for a W filament (by internal exchange of the fila- ments). The spectra showed identical relative intensity distributions, although the Pt detection efficiency was only about 80% of the W detection efficiency.
An Applied Physics Corp. Mod. 31 vibrating-reed electrometer was used to measure the ion current produced by the detector.
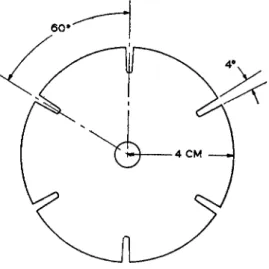
(e) Velocity-selector
The velocity selector consists of two identical slotted discs (Fig. 3).
Each disc is turned by an 8000 rpm synchronous motor. A phase- shifter* varies the phase of the voltage fed to one motor relative to the
DISC DETAIL
DISC THICKNESS · 10MM MATERIAL: ALUMINUM
Fig. 3. Detail of selector disc.
other. As is described below, a light beam is used to determine when the velocity selector is set for zero transit-time. This beam is produced by a small light source near one disc. It then passes through the velocity selector underneath the motors, and is detected by a photo-cell near the other disc. The motors use miniature precision ball bearings which are lubricated when installed with a small drop of diffusion pump oil. A pressure of < S x 10~7 mm Hg can be maintained indefinitely in the beam room with the motors running.
* A differential generator (i.e. a type of transformer in which one winding can be rotated with respect to the other) is used as a phase-shifter.
ΙΠ· Action of the Velocity-Selector
As explained in Appendix I, if the setting of the phase-shifter is such that the delay time of the second disc relative to the first is τ, and the slît open time is /?, then the number of beam particles passing through the selector (per cm2 of beam cross-section) each time a pair of slits—
one slit in one disc, one slit in the other disc—cuts the beam (call this one pass) will be given by
00
h(T,ß)=js(r,T,ß)I(T)dT. (1)
T is the transit time (between discs of separation /), I(T)dT is the incident intensity in the range dT (molecules/cm2 sec) and S(r, T, ß) is the "shutter function" (sees) describing the transmission of the velocity selector for a given phase setting (it is the effective open time in a single pass for molecules of transit time T).
If the effusion from the oven is ideal, I(T) will simply be the "Max- well beam intensity function" (ref. 4, p. 20), in the transit-time variable.
It is convenient to use dimensionless variables obtained by dividing by T0y the transit-time of the most probable velocity in the oven. Defining the reduced transit-time
- T I J2RTK
T =— where To = I ^J—^—; TR = absolute temperature (2) To Π M we have
2/o ,-nln
I(T) dT=— e-(VT)*.dTf (3)
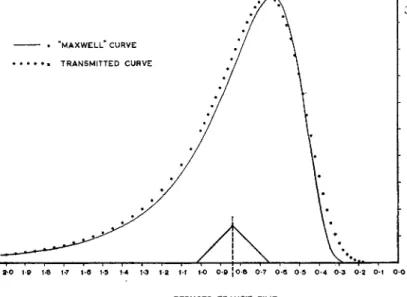
which has a form independent of temperature. Io is the total beam intensity (molecules/cm2 sec). I(T) is plotted as the solid curve in Fig. 4.
The shutter function S(r, T9 β) is an isosceles triangle as a function of T, base 2/?, peak β (at T = τ), if beam width and disc thickness are negligible. The reduced shutter function S/To is shown in Fig. 4, (for typical values of β = 0.850 x 10"4sec and T0 = 4.557 x 10"4sec).
Since T0 depends mi temperature, S'/To does also. The integral of the product of I(T) dT and S/T0 is proportional to Α(τ, β) and is plotted in Fig. 4 (dotted curve) as a function of reduced delay time τ/Γ0.
48 P . M. M A R C U S A N D J . H . MGFEE
Both / and h in Fig. 4 are normalized to the same arbitrary peak value to show the effect of the velocity selector on the breadth and shape of the curves. On the reduced transit-time scale A, but not /, is slightly temperature dependent.
MAXWELL CURVE TRANSMITTED CURVE
2*0 10 1-8 1-7 1-6 1-5 1-4 1-3 1-2 M 1-0 0 0 JOB 0-7 0-6 0 5 0-4 0-3 0-2 0-1 0 0
REDUCEO TRANSIT TIME
Fig. 4. Maxwell incident beam intensity curve vs. reduced transit-time and theoretical transmitted curve vs. reduced delay time showing effect of trans- mission through velocity selector. Triangle is ideal shutter function for reduced
delay time = 0.84.
Appropriate dimensionless forms for / and h which make them directly comparable are given in Appendix I and plotted in Fig. 9.
In calculating theoretical transmission curves to compare with the measured curves, the following effects were considered which could give rise to differences from the dotted curve shown in Fig. 4.
1. The finite angular spread of the beam may be shown to have a negligible effect on the transmitted curve.*
2. The finite disc thickness causes a small but not negligible distor- tion of the transmitted curve. At twice the most probable transit-time the curve is reduced by 2% relative to the peak.*
(This correction was not explicitly introduced in the calculated curves of Figs. 5 and 6.)
* See Appendix II.
OVENT «325*C OVEN P > 0-58 MM HG
TRANSIT TIME
Fig. 5. Measured transmission curve (circles) and calculated Maxwell trans- mission curve (solid line) at high oven temperature (325° C) and beam intensity.
Abscissa is delay time τ, which is approximately transit time of molecules transmitted (1 unit of τ = 0.708 xl0~4 sec = 3J° phase shift). Ordinates are
in arbitrary units; curves normalized to same maximum value.
OVEN T»157#C OVEN P « 0-84xKfMM HG
TRANSIT TIME
Fig. 6. Measured transmission curve and calculated Maxwell transmission curve at low oven temperature (157° G) and beam intensity. Details as for
Fig. 5.
5 0 P . M. M A R C U S A N D J . H . MCFEE
3. The second-order velocity spectrum due to slow molecules with T greater than the time interval between slots gives a small con- tribution which is a maximum (^% of peak) at zero on the transit- time scale. This correction is taken into account in the calculated curves of Figs. 5 and 6. Third-order and all higher-order spectra taken together have been shown to be negligible.*
IV. Alignment of the Apparatus
The critical measurement for this type of velocity-selector is that of the relative phase angle between the two discs. In order to compare an experimental curve to a calculated curve, one must know not only how much this phase angle changes for a given change in the phase- shifter setting, but also what phase-shifter setting corresponds to zero phase, i.e. to zero transit-time.
That the relative phase angle of the discs is proportional to the setting of the phase-shifter to within 0.1° has been determined by direct visual observation.3 This was accomplished by inscribing a degree scale on one disc, and a vernier scale on the other. A disc-shaped mirror was placed half-way between the two discs so that the image of the vernier appeared superimposed on the degree scale. The direct observation of phase shift was then made by a stroboscopic flash.
The determination of zero transit-time setting for the molecular beam is accomplished with the aid of a light beam. The photons have effec- tively zero transit-time compared to molecule transit-times. Thus I(T) for the photons is a delta function at T = 0, and the transmitted curve for the light beam is simply the triangular shutter function shown in Fig. 4 (provided the angular spread of the light beam is small). The peak of this triangle indicates zero transit-time, but this will be zero transit-time for the molecular beam only if the light beam and mole- cular beam are parallel in a "rolled-out" view of the velocity selector—
(lack of parallelism shifts the velocity distribution with respect to the light beam peak). The condition of parallelism can be obtained as follows :
(a) The difference between the phase-shifter setting corresponding to the peak of the light-beam triangle and the setting corresponding to a definite transit-time on the molecular beam distribution curve is measured (the half-maximum point on the steep side of the curve is usually chosen).
(b) The direction of rotation of the discs is reversed, and the measure- ment described in (a) is repeated. (Reversal of rotation of the discs
* See Appendix II.
reverses the shift of the velocity distribution with respect to the light beam.)
(c) The molecular beam is adjusted (by moving the detector filament horizontally and in a direction perpendicular to the beam) to make the above two measurements equal. This can be done to within 0.1°, i.e.
to within about 1/30 of a unit on the transit time scale of Fig. 5 and 6.
In practice the relative phase angle is never constant in time but fluctuates due to changing torques applied by the motor bearings. In order to keep these fluctuations well below 0.1°, the bearings must be replaced periodically and the motor driving-voltage must be kept sufficiently high. Even with these precautions, a "run-in" time of 15 min. to 1 hour is found to be necessary each time the motors are turned on. During the "run-in" period the relative phase will at first vary quite wildly (~1° or so). The fluctuations then gradually die down to ~0.02° if the bearings are in good condition. This much phase shift is easily observable by using either the light beam or the molecular beam.
V. Experimental Results
Figures 5 and 6 are comparisons between experimental results and transmitted curves calculated on the basis of ideal effusion (Maxwell transmission curves). The curves are all normalized to the same maxi- mum value. However, the transit-time scale is fixed by using the measured zero of transit-time and the curves are not adjusted by horizontal translation. The data were taken in a point-by-point fashion in order to eliminate distortion of the distribution curve due to response time of the detector. The zero-line and maximum of the curve were checked frequently during the recording of each distribution in order to minimize the effects of zero-line drift and changes in the beam intensity. In both Fig. 5 and Fig. 6, 18 divisions on the transit- time scale corresponds to a phase shift equal to the angular spacing between the slits in the velocity-selector discs (60° in present case).
Therefore, zero on the transit-time scale is also 18 (the second-order spectrum), 36 (the third-order spectrum), etc.
Figure 5 shows an experimental curve for a high oven pressure. The mean free path in the oven is about equal to the slit width. The follow- ing features are of interest:
1. The agreement with the calculated curve is very good on the high- velocity side of the maximum, but there is a marked deficiency of low-velocity atoms amounting to about 60% of the calculated value at twice the most probable transit-time.
5 2 P . M. M A R C U S A N D J . H . MGFEE
2. At zero transit-time the experimental curve has roughly twice the amplitude of the calculated curve.
In Fig. 6 the mean free path in the oven is hundreds of times greater than the slit width. Here the important features are :
1. The general agreement on the low-velocity side of the curves is now very good. The deficiency is about 2% of the calculated value at twice the most probable transit-time.
2. The measured intensities at the zero phase position are again in excess of the calculated intensities; the intensities are small ( 1 % of the peak) but measurable. In fact, the experimental curve is higher than the calculated curve from about 9J onward on the transit-time axis. (After moving the shutter position to reduce its effect on the background signal and decreasing the disc thickness at the slit edge, this excess measured intensity was not observed in later measurements.)
3. Agreement on the high-velocity side is not as good as at the higher oven pressure. There is a 2% deficiency at the half- maximum point.
4. The peak of the measured curve is shifted toward longer transit- times by about 1.5% of the corresponding transit time as com- pared to the calculated curve.
Effects 3 and 4 can almost be accounted for by the quoted uncer- tainty in the transit-time measurement. More data are needed to determine if these discrepancies are real.
Figure 7 summarizes the results of ten velocity distribution measure- ments, each taken at a different oven temperature. All the points refer to a transit time equal to twice the most probable transit time. The scatter on this plot, about 3 % (1% of the maximum amplitude), gives some idea of the reproducibility of the data. As noted above there appears to be a residual 2% deficiency present at the lowest oven pressures. Most of this would be removed if the calculated curves had taken into account the thickness of the velocity-selector discs (see Appendix II). However, this also increases the excess which is observed at longer transit-times. (As explained above, this excess was probably spurious. Later measurements made with the shutter positioned at the center of the beam room, rather than directly on the oven side of the collimating slit, have not shown any excess.)
Also plotted on Fig. 7 are two points taken from the potassium data of Miller and Kusch.2 Bennett's results for knife-edge oven slits indicate low-velocity deficiencies which are several times greater than those reported here. A comparison was also made with the earlier gravity free-fall experiment of Estermann, Simpson, and Stern5 who used
cesium beams. Their results showed low-velocity deficiencies consider- ably larger than those reported here for potassium.
The observed deficiency is thus an effect of high beam intensity, and may arise partly from self scattering in the beam, as roughly calculated by Estermann, Simpson, and Stern,5 and partly from deviations from ideal effusion conditions at the oven slit, when the mean free path is
t.o D E F I C I E N C Y O F
L O W - V E L O C I T Y A T O M S o.o
0.8
0.7
0.6
MEAS. 0 5
CALC 0 4
0.3
0 2
0.1
" Ί 0 0 140 180 220 260 300 340 380 OVEN TEMPERATURE (°C)
Fig. 7. Fraction of transmitted Maxwell intensity observed at twice the most probable transit-time as a function of oven temperature. (1 — (meas./calc.) = deficiency.) Circles are the data of this report. Crosses are taken from the data
of Miller and Kusch,2 Runs No. 57 and 60.
short. The velocity dependence of residual gas scattering at a pressure 5 x 10~7 mm Hg does not appear to be significant, as shown by agree- ment of measured with calculated transmission curves at the lowest beam intensities, and by direct calculation assuming quite large scatter- ing cross-sections (400 A2 for K against air molecules). This con- clusion is in agreement with Miller and Kusch,2 p. 1320.
The measured and calculated Maxwell transmission curves (corrected for higher-order spectra) for low-pressure beams agree fairly well in all respects, although small residual discrepancies as noted above, still per- sist. The reproducibility and precision should be adequate to detect the small changes in velocity spectra produced by reflection at solid surfaces.
o 0+
l o i I I I o * t
| p
I I T I I I I ° I
I I I I o
5 4 P . M. M A R C U S A N D J . H . M C F E E
REFERENCES
1. A. I. Bennett and I. Estermann, "Distribution of Velocities in Molecular Beams of Potassium", (Doctoral Dissertation, Carnegie Institute of Technology, 1953).
2. R. C. Miller and P. Kusch, Velocity Distributions in Potassium and Thallium Atomic Beams, Phys. Rev. 99, 1314 (1955).
3. A. I. Bennett, The Phase-Shift Velocity Selector (to be published).
4. N. F. Ramsey, "Molecular Beams", Oxford 1956.
5. I. Estermann, O. C. Simpson, and O. Stern, The Free Fall of Atoms and the Measurement of the Velocity Distribution in a Molecular Beam of Cesium Atoms, Phys. Rev. 71, 238 (1947).
Acknowledgement
The authors would like to thank Dr. I. Estermann of the U.S. Office of Naval Research for his interest and encouragement during the course of this work, Dr. A. I. Bennett of the Westinghouse Research Labora- tories for generously contributing time and technical advice during all aspects of this research, and Dr. S. A. Friedberg of Carnegie Institute of Technology for many helpful discussions and suggestions.
APPENDIX I
TRANSMISSION FORMULAS FOR T H E PHASE-SHIFT VELOCITY SELECTOR
1. Definitions and magnitudes of physical quantities
The following quantities occur in the discussion of the behavior of the velocity selector, and are given here for convenient reference, to- gether with typical magnitudes for the instruments in use.
ß = slit open time = 0.850 x 10- 4 sec (corresponding to an angular aperture of 4.03°, and rotation speed of the discs of 132 rev/sec).
/ = spacing between discs (front surface to front surface) = 19.5 cm.
a = most probable velocity in the oven
I2RTK /TK\*cm
= J — = 4.611x10⁴ —
N M \5007 sec
for potassium (TR = Kelvin temperature).
T = Ijv = transit time for molecules of velocity v.
T0 = //a = transit time of most probable velocity /500\*
= 4.229xl0-4 sec.
\TKJ
I(T)dT = incident intensity at first disc in range dT (molecules/
cm2 sec).
oo
I
0= jl{T)dT =
= total intensity at first disc (molecules/cm2 sec).
T = time delay of slit in second disc with respect to slit in first disc.
t = time, t = 0 when leading edge of slit in first disc first reaches the beam line (the angular spread of the beam is taken as infinitesi- mal; see Appendix II, 1, for discussions of this approximation).
Α(τ, ß) = the transmission function, the number of molecules per cm2 of beam cross section transmitted during one pass of a pair of slits, for given time delay τ.
Reduced or dimensionless quantities are indicated by a bar.
T = T/T0, T = τ/Γ0, β = β/Τ0 are the reduced transit time, reduced delay time, and reduced slit open time (dimensionless).
Reduced transmission functions X, and beam intensity functions I will be defined later.
2. Derivation and properties of the transmission function
The measured intensity is Α(τ, β), (times the frequency at which a slit passes the beam line, 800/sec), which must therefore be related to the intensity distribution in the incident beam I(T). A simple descrip- tion of this relationship follows from consideration of the pairs of values of T and t\ the arrival time at the first disc, which give a trans- mitted molecule. Figure 8 shows the quadrangular area on a Γ, t' plane which gives transmission. The first slit is open from t = 0 to β*
hence all molecules with arrival times ( Χ ί ' ^ β pass through it. For + each t\ there is a range of T for which the molecules reach the second slit during its open time τ to τ +β9 namely from T = τ — t' to T = T + ß-f.
I(T) dT dt' is the number of molecules/cm2 arriving at the first disc in range dT during time interval dt\ hence
ß T+0-t' T ß r+ß τ+β-Τ
h(r,ß)=[dt' [ dTI{T)=[ dT [dt'I(T)+[ dT ldfI(T)1 (A.l)
0 T-f τ-β Τ-Τ T 0
* Note it is again open from 15/3 to 16/?, 30/9 to 31/?, etc.
f The actual transmitted intensity at the detector is reduced from Α(τ, β) in (A.l) by the square of the source to first disc distance divided by the square of the source to detector distance.
56 P . M. MARCUS A N D J . H . MCFEE i
τ*β TRANSIT TIME
T
T
1st SLIT NOT
YET * OPEN
ARRIVE TOO
1 LATE FOR 2nd · SLIT
///\JCT'***"*'
/TRANSMITTED \
V / / / / / / / / / / /
w/// \J
=T~V
ARRIVE X T / TOO SOON X FOR 2nd SLIT
T
r-
0 ~fi ARRIVAL TIME AT
—
fi
1st
1st SLIT CLOSED
t' DISC
Fig. 8. Transmission diagram of velocity selector. Shaded area shows pairs of transit-times and arrival-times resulting in transmission.
From the second form of (A.1), integrating over /' gives;
00
A(T,J8) = j S{r,ß,T)I(T)dT (A.2)
where the shutter function S(T, β, Τ) is (Τ+β-τίοττ-β^Τ^τ
5(r,j8, T) = Ιτ+β-Τίοττ^Τ^τ+β.
V 0 otherwise Note that
(A.3)
(A.4) I(T) = Ofor Γ<0,
hence integration in (A.l) and (A.2) for T<0 makes no contribution to h(r,ß).
Differentiating (A.1) twice with respect to τ gives the relationship of h to 7, namely
32A(T, ß)
—±» = 7(τ +0)-2/(τ) + / ( τ - Α , (Α.5)
thus the second derivative of h equals the second finite difference of / at interval ß; in compact form,
Α'(τ,/?) = Δ*/(τ).
One relation satisfied by h is noteworthy: if the pulse of molecules passing the first slit is broken into transit-time ranges by a series of values of τ separated by β, the ranges are contiguous and account for all molecules in the pulse, hence
oo
2 Κτο + ηβ, β) = ß [l{T)dT = βΙ0 ; τ0<0. (Α.6)
w=0,l,2 0
The evaluation of I(T) requires solution of the difference equation (A.5) given Λ(τ,/?), hence all derivatives of A, from the measured intensities. Several procedures have been suggested by Bennett.1»3 We note one useful result. If Δβ2Ι(τ) in (A.5) is expanded in derivatives of I(T) at T, only even orders occur, and
A"(r,j8) = J3 2/»( T ) + ^ _ / / F( T ) + ... ( A.7 )
Integration of (A. 7) and further differentiation of (A. 7) permit its inversion in the form
Mr, β) 1 02
Evaluation of h and its derivatives from the measurement then permits I(r) to be calculated from (A.8).
For calculation purposes it is convenient to define dimensionless beam intensity and transmission functions. Thus IJIQ = fraction of molecules in the beam per unit transit-time. Hence
ToI(T)
I(T) = —^= (A.9)
= the fraction of molecules per unit reduced transit-time, is a dimen- sionless beam intensity function. It satisfies the condition
J
00 I(T)dT= 1; (A.10) owhere T = T/TQ is the reduced transit-time variable.
5 8 P . M. MARCUS A N D J . H . MGFEE
Similarly [Λ(τ, β)/Ιοβ] = fraction of the molecules admitted by the first slit which are in the transmitted pulse for time delay τ and open time β of the slits. Hence
- - Α(τ, β)
= fraction of admitted molecules in transmitted pulse per unit reduced open time, is a dimensionless transmission function comparable to
1(f). Thus
2 *σο + ηΑΑ(γ-)-1
n-0,1,2,... °
by (A. 6). Then approximating the sum by an integral, we have
j h(r9ß)dr ~ 1 (A.12)
-ß
where τ = τ/Γο is the reduced delay time, and for ? < -β> the lower limit, the integrand vanishes. (A.12) is the analogue of (A. 10), and shows that the two dimensionless functions Ι(ψ) and Α(τ, β) integrated with respect to ? each have unit area, hence are appropriate for com- parison to show the transmission effect of the velocity selector on the incident beam.
For the Maxwell intensity distribution (i.e. the intensity distribution in the beam for ideal effusion from an oven in equilibrium at one temperature)
2 _2
I(T) = — e-a/D? (A.13) T5
The corresponding distribution in velocity is vs « 2dv I(v)dv = 2/0—e-»/ a —
a3 a
(see Ref. 4, p. 20.) The reduced transmission function for this incident intensity is
Ä(r, ß) = ^[Κ(τ + β)-2Κ(τ) + Κ(τ-β)
MOLECULAR BEAM V E L O C I T Y D I S T R I B U T I O N S 5 9
β = β/Το, Κ(χ) = -e-<y*? + ^ (erf--1)
2 4 x (A.14)
erfi e~?dt.
A comparison of these functions is shown in Fig. 9, including the effect of the available range of temperature on Α(τ3 /?). The velocity selector reduces the peak by about 6 to 9%, and broadens and shifts the distribution slightly with respect to the incident velocity distribution.
h(f.£)AT141°C
3 0 2-β 2·β 2-4 2-2 2 0 1·β 1·β 1-4 1-2
" · (Τ/3·7β χ 10-4) ; (73.7βχ 10-4)
Fig. 9. Reduced Maxwell beam intensity I(T) and reduced transmission func- tions Λ(τ, β) at extremes of temperature (352° G and 141° G). The scale of τ, or T, is properly reduced at 352° G3 where T0 = 3.78 xlO"4 sec. At 141° G the h curve is then not plotted against the corresponding τ, but shows directly the effect of temperature on the transmission function in terms of the variable τ.
(If it were plotted against that τ, the h for 141° C would lie very close to h for 352° G.)
A P P E N D I X II
CORRECTIONS TO THE IDEAL TRANSMISSION FUNCTION
The function Α(τ, β) given by (A.l) is calculated under ideal condi- tions. Three types of corrections to (A.l) should be considered in
60 P . M. MARCUS A N D J . H . MGFEE
interpreting the measurements made with the actual instrument, and these are now considered quantitatively.
1. Effects of Finite Angular Spread of the Beam
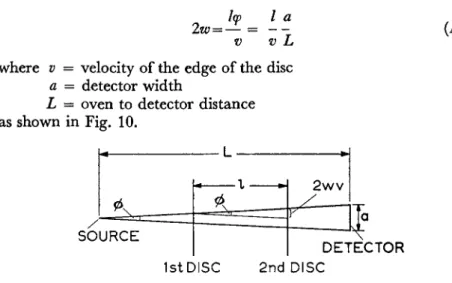
The finite angular width (in a plane tangential to the discs) intro- duces a range of delay times for each value of r, the time delay of the second disc, since the beam line is now spread out in angle and different parts have different effective delay times. If / is the spacing between discs and φ is the beam angle (in radians), the range of delay times, 2w, is
1φ I a
2w = —= - - (A.15) v v L
where v = velocity of the edge of the disc a = detector width
L = oven to detector distance as shown in Fig. 10.
IstDISC 2nd DISC
Fig. 10. Geometry of beam with angular spread φ. Diagram is in a plane which is tangent to the edges of the velocity selector discs.
The effect of this range of delay times is to superimpose a set of trans- mission functions from τ — w to τ + w. Using (A.2) for Α(τ, β) we can obtain the superposed average transmission function hw(r, β) by using an averaged shutter function, Sw (r, /?, T),
00
M r , β) = / SW(T, ft T) I(T) dT (A.16) o
T+w T+w
5w(r, β, T) = 1 J S{r, β, T)dr = ± j S(r, fi, T)dT (A.17)
T-w T—w
where
Su{r, ß, T) = '0
(Τ-τ+β+wf 4w {T-r+ß
,Τ^τ-β-w
τ-ß-w^T^T-ß+w τ-β + ζαζΤίζτ-ζο
SJr,ß,T) = {
vfi + Or-Tf
ß , τ-w^T^T+w 2w
τ+β-Τ (r-T+ß+w)2
4w 0
, τ + w ^ T ^ T +ß - w ,T+ß-w^T^r+ß+w ,r+ß+w^T
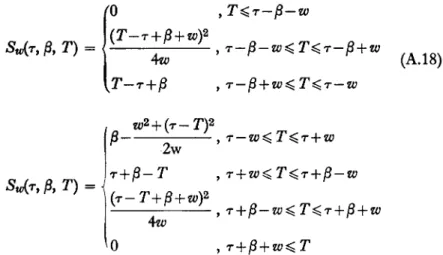
(A.18)
Equation (A.18) is the averaged shutter function symmetrical around T = T, with rounded corners shown in Fig. 11 for an exaggerated value of w = (w/T0) = 0.025 and jf? = 0.20. This function has been used in a direct calculation of hw (τ, β) from (A. 16) for/(T) a Maxwell distribution. The effect is smaller than our precision of measurement and at typical values for our apparatus (w = 0.005, β = 0.20) de- creases the ratio of the intensity of slow molecules, say at twice the peak delay time relative to the peak, by about 0.02%. Larger values of w increase this ratio, as is shown in the following table.
0-21
sjm)
Sd(TAT)
7*0-1 7*0-2
Fig. 11. Reduced shutter functions vs. reduced transit time.
S = (S/T0) ideal shutter function.
S*> = (Sw/To) shutter function averaged over angular spread of beam.
Sd = (Sd/To) shutter function corrected for disc thickness.
6 2 P . M. MARCUS A N D J . H . MCFEE
TABLE 1
EFFECT OF FINITE ANGULAR SPREAD OF BEAM ON TRANSMISSION FUNCTION
(comparing value at τ = 1.32 with τ = 0.66, corresponding to the peak)
w 0 0.005 0.010 0.020 0.030 0.050 0.100 0.150
_ M 1 . 3 2 , 0.2083) A„,(0.66, 0.2083)
0.19494 0.19491 0.19506 0.19531 0.19581 0.19740 0.20499 0.21536
o/ u (r„-r o)100
% change = r0
0 -0.02 +0.06 +0.19 +0.45 +1.26 +5.16 +10.5
2. Effects of Finite Disc Thickness
The thickness d of the velocity selector discs decreases the effective open time of both entrance and exit slots for molecules of transit-time
T from β to ß —(dTß). Thus (l/T) is the velocity of a molecule of transit- time Γ, hence it must enter one side of the slot at least a time dl(l/T) before the slot closes to clear the other side.
This effective open time evidently alters the ideal shutter function to
('-"Ί'-,ν
Sd(r, β, Τ) =
< Γ < Τ 1 — d
T + i
8 - r ( l + - J , T < r < — -
d(A.19)
1 + /
The thickness-corrected shutter function Sd(r, β, Τ) is still a triangular function of T or r, with straight sides, but with a lower peak and larger area toward longer transit-times.
Direct numerical integration using Sd(r, β, Τ) and the Maxwell beam intensity function shows a reduction in transmission of several per cent at all delay times, least at the peak. The percentage decrease in trans- mission is shown in Table 2 at the typical value d\l = 0.005. The peak value h(rp9 β) is lowered by 3%, where fp = the reduced delay time of the peak (^ 0.66), whereas £(2τρ, β) is lowered by 5%, thus creating a relative deficiency at long transit-times that must be considered in interpreting the measured transmission.
0.2 0.4 0.6 0.8 1.0 1.5 2.0 2.5
0.0125 0.5107 1.4339 1.2669 0.7561 0.1742 0.0497 0.0177
TABLE 2
EFFECT OF FINITE DISC THICKNESS ON TRANSMISSION FUNCTION (at ß = 0.2083, and d/l = 0.005)
Γ,- T* 100[h(r9ß)-hd(r, ß)]
Λ(τ, β) = / / change Λ(τ, /?)
6.4 2.9 2.7 3.7 4.8 7.3 11.9 9.7
3. Effects of Higher-Order Spectra
The observed transmission function contains all the higher-order velocity spectra resulting from the long transit-time tail of the pulse passing through the first slot. If TO = the delay time of the next slit after a given one (on the same disc), and ht(T, β) the total transmission function to all orders (but uncorrected for angular spread and thick- ness effects), then
ht(r,ß) = ^h(r + nro,ß) (A.20)
n=0
where Λ(τ, β) is the single pass transmission function. In the present design f o is about 15/?, and typical values of the successive spectra, at say, T = 0, and β = 0.2083 of the reduced transmission function h(r,ß) are
Ä(0, ß) = 0 ; Ä(15/?, ß) = 0.007 ; Α(3θ£ β) s 0.0002 etc. (A.21) The sum of all terms after the second term in (A.21) (i.e. after the second-order spectrum) is less than 4% of that term which in turn is about 0.4% of the peak value. Hence the third and higher order spectra can be ignored.