Development of Complex Curricula for Molecular Bionics and Infobionics Programs within a consortial* framework**
Consortium leader
PETER PAZMANY CATHOLIC UNIVERSITY
Consortium members
SEMMELWEIS UNIVERSITY, DIALOG CAMPUS PUBLISHER
The Project has been realised with the support of the European Union and has been co-financed by the European Social Fund ***
**Molekuláris bionika és Infobionika Szakok tananyagának komplex fejlesztése konzorciumi keretben
(Az ideg- és izom-rendszerelektrofiziológiai vizsgálómódszerei)
GYÖRGY KARMOS and BALÁZS DOMBOVÁRI
ELECTROPHYSIOLOGICAL METHODS FOR THE STUDY OF THE NERVOUS- AND MUSCULAR-SYSTEMS
LECTURE 7
ELECTROENCEPHALOGRAPHY (EEG)
(Elektroenkefalográfia)
AIMS:
In this lecture, the student will become familiar with the methods of the
electroencephalography, types of electrodes applied, electrode locations above the scalp, the recording instrument and with the characteristics of the brain waves recorded in the healthy subjects and in different pathological states.
DEFINITION:
Electroencephalography (EEG) is the technique to record and interpret
bioelectrical activity of the brain by electrodes placed on the human scalp.
The term electrocorticography (ECoG) is used when the electrical activity is recorded by electrodes placed to the exposed brain surface during
surgery. In the everyday practice EEG is used as a more general term for any form of recording of brain electrical activity e.g. Depth
electroencephalography is used when the brain waves are recorded by
HISTORY :
Hans Berger (1873-1941) a German psychiatrist in Jena was the first to record brain electrical activity form the human scalp in the 1920s. He used string galvanometer.
In the thirties intensive research begun both in Europe and in the US and in the II.
World War EEG was already used to test the neurological state of the British Royal Air force pilots. From the fifties EEG became a clinical tool in neurology. It has special relevance e.g. in diagnosis of epilepsy. The traditional EEG records (usually 8-16 channels) were made on paper strip by ink. (fig. 1-2.) In the PC age the
„paperless EEG” became general, the multichannel EEG records are displayed on the PC monitor. The „digital EEG systems” made possible the use of mathematical analysis for the processing of the EEG (see Lecture 12).
EEG is used in brain research to monitor functional states of different brain areas and to study brain information processing (cognitive psychophysiology).
Chronically implanted electrodes (see Lecture 5) make possible the study of electrical activity of different brain structures in behaving animals.
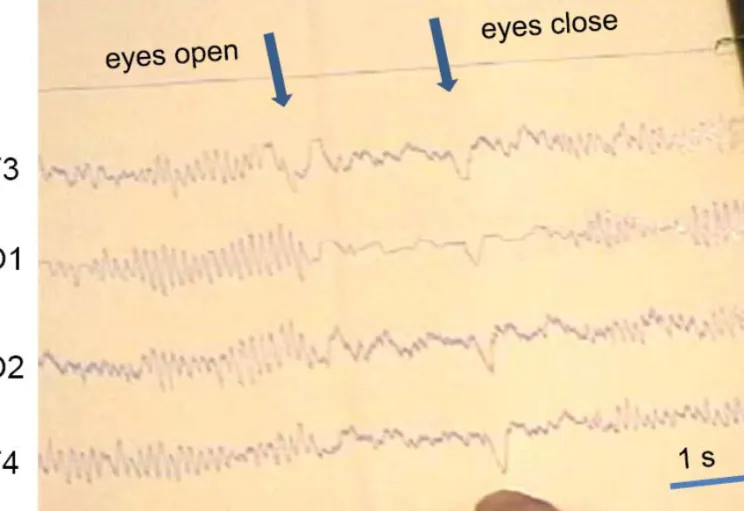
Fig. 2. Paper recorded EEG demonstrating desynchronization induced by eye opening. The 2-5. channels recorded temporal and occipital activity. The finger points to the eye movement artifact at eye closure.
THE ELECTROENCEPHALOGRAPH
(abbreviated also as EEG) The present day PC based EEG machines record more parallel channels thanthe traditional paper type EEGs. Up to date systems use 32-128 channels according to the need.
Fig. 4. a, b: Ag/AgCl scalp electrode. c: Clip electrode for ear reference.
a b
c
EEG ELECTRODES
SURFACE ELECTRODES
Usually silver/silver-chloride nonpolarizable/reversible electrodes, (see Lecture 5) 4-10 mm in diameter, are used for routine scalp recording (Fig. 4a-b.).
Before placement of the scalp electrode the skin must be cleaned by some solvent like alcohol. A special gel is applied between the
electrode and the skin to assure good conductance. According to the international standards the impedance of the scalp-electrode interface must be below 5 kΩ.
Clip electrode is similar to the scalp ones and is clipped to the earlobe as reference electrode (Fig. 4c.)
Special precautions must be taken to avoid transmission of infection by electrodes!
Scalp electrodes can be attached singly to the skin by different methods. In case of few electrodes collodion glue can be used to maintain long term recording (Fig. 5.). There are pastes that can both hold the electrode in
place and serve as conductive material. Rubber bands were also used to fix electrodes. Preparation of the electrodes individually in case of high density recordings is very time consuming.
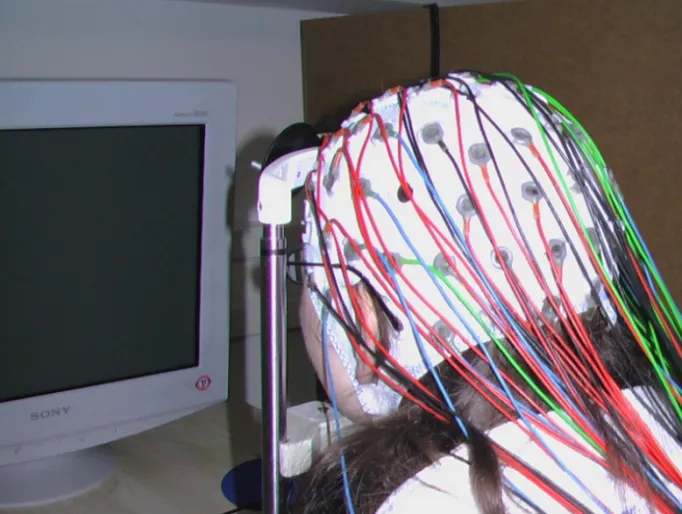
Electrode cap is made of elastic textile material, looks like a swimming cap.
The electrodes are attached in advance according to the international standard. This speeds up the preparation of the recording. Different size caps are available for different head size (Fig. 6.a.).
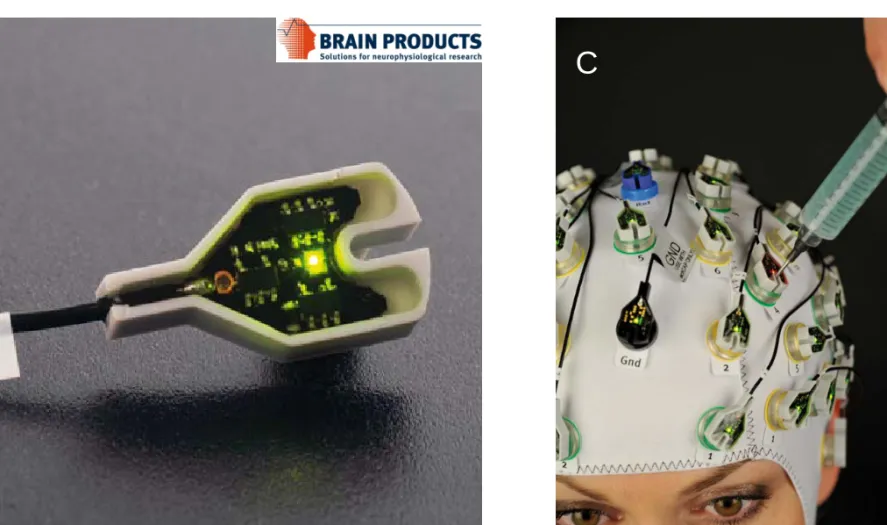
Recently some companies developed „active” electrodes (Fig.6. B, C.) . This means that the first stage of the amplifier or even the A/D converter is built in each electrode.
High density electrode system called Geodesic Sensor Net can easily attach and makes possible 128-256 channel recordings. (Fig. 7.)
Fig. 6. A. Subject of psychophysiological experiment in front of the monitor, wearing electrode cap with color coded scalp electrodes.
Fig. 6. B: Electronics of the „active electrode” C: Active electrode cap. Electrode 4 is just
B C
GEODESIC SENSOR NET
The HydroCel Geodesic Sensor Net (GSN) is an electrode system, developed by the Electrical Geodesics Inc. (EGI) Eugene, Oregon, USA.
The electrodes are held in place by a compression grid,
they includes a soft pedestal foot that creates a small
chamber against the scalp filled with sponge in them filled by saline-based electrolyte.
Up to 256 electrodes can be used for complete head coverage.
http://www.egi.com
SPECIAL ELECTRODES
Nasopharingeal, sphenoidal, tympanic and foramen ovale electrodes are used to record brain waves from that brain regions that are not displayed by the scalp electrodes.
Electrocorticogram are recorded by electrodes placed directly to the cortex or to the dura (epidural record). Intra-operative recordings to map pathological electrical signals are made by electrodes fixed to an apparatus, nowadays in most cases subdural electrode grids or strips are used. These
multielectrodes can be implanted for several days to localize epileptic manifestations before surgical removal of the epileptogenic areas (Fig. 8.
a.).
Depth electrodes have multiple contacts and are used for intracranial
recordings. They are introduced to deep brain structures by neurosurgical techniques (Fig. 8. b.).
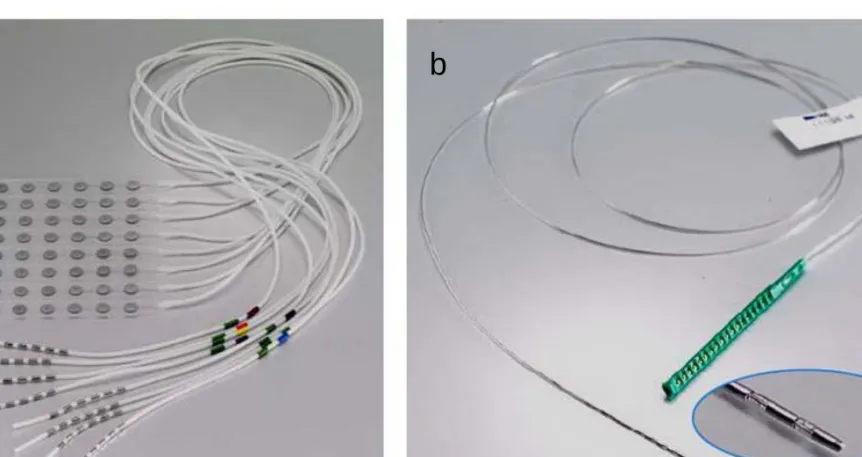
Fig. 8. a. Electrode grid (8x8) for recording from the cortical surface b. Multielectrode for recording from the deep brain structures
Courtesy of DIXI Microtechniques SAS (www.diximedical.com).
a b
INPUT BOX
The electrodes are connected to the input box (called also jack box) either by individual connectors or at high density electrode arrays with a
multicontact connector. The individual connectors of the input box are arranged according to the head scheme showing the electrode positions according to the international standard. Electrode lead wires are not long, the input box should be kept close to the subjects head. In modern EEGs the first stage amplifiers are built in the input box, to minimize electrical interference. These amplifiers have little amplification, they convert the impedance of the signal source (electrodes) from several thousand of ohms to few ohms.
AMPLIFIERS
EEG signals are in the microvolt range this means that high input impedance, low noise, high dynamic range amplifiers must be used. To reduce external noises biological apparatuses use high input impedance, low noise
differential amplifiers (see Lecture 10), that suppress common mode noises.
The common mode rejection ratio (CMR) of a good EEG amplifier can be 100,000 times (100 dB).
According to the convention in clinical EEG practice if input 1 of the
differential amplifier is more negative than input 2, the deflection on the monitor screen goes upward, if input 1 is more positive, the deflection moves downward. However in ERP practice often „positivity upward”
practice is used. This calls for the importance of the marking the polarity at the voltage calibration signal.
FILTERS
High and low pass filters are used to reduce selected high or low frequency signals. These can be disturbing artifacts but filters may also modify EEG waveforms. Filtering can suppress muscle artifact but it may hide epileptic spikes or it can overcome slow drifts caused by sweating but may hide delta waves caused by a tumor. At traditional ink writing EEGs filter settings were at low pass filter 70, 30 and 15 Hz while at high pass filter 0.1, 0.3, 1 and 5 Hz. The setting called cut off frequency specifies the value at which the given frequency signal is attenuated by 3 dB. The filters do not eliminate frequencies above or below their settings but attenuate gradually depending on the slope of the given filter.
Modern digital EEGs that use digital filters have much wider frequency range, the frequency band can be positioned between DC or 0,1 Hz and 10 kHz..
Notch filter is used to sharply suppress artifact caused by the 50 (60) Hz.
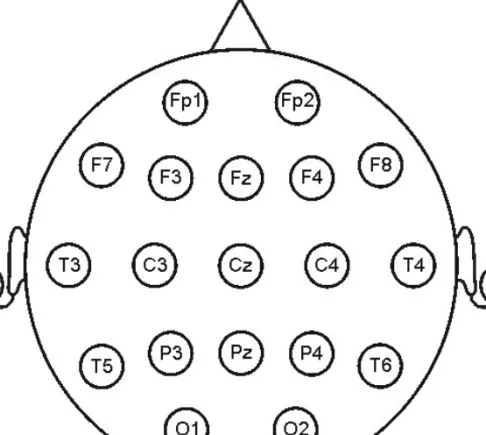
ELECTRODE PLACEMENT
The International Federation of Clinical Neurophysiology (IFCN) specified the placement of the electrodes for clinical EEG called „international 10- 20 system” (Fig. 9.). The aim is to cover the whole scalp by evenly
distributed electrodes.
The standard set of electrodes consists of 21 recording electrodes and one ground electrode. They are named with a letter describing the region and a subscript indicating the lateral position (F=frontal, C=central, T=temporal, P=parietal, O=occipital). Left side electrodes are marked by odd numbers while right side electrodes by even numbers. The midline electrodes are marked by the subscript z.
The position of electrodes is proportional to the size and shape of the skull and is based on specific measurements of standard skull landmarks. These
landmarks are the nasion, inion and the left and right preauricular points.
Fig. 9. International 10-20 electrode system
In the midline of the head the distance between the nasion and the inion is divided to six distances (Fig.10.). The first frontopolar (Fp) electrode is above the nasion at 10% of the total measurement. The next frontal (Fz), central (Cz) and parietal (Pz) and occipital (Oz) electrodes are placed 20%
interval of the total measurement. This way the last Oz electrode is located at 10% of the measurement above the inion. The same principle is used at electrodes in the coronal plane or in the circumferential direction (Fig. 9.).
Since the multichannel digital EEGs made possible the simultaneous use of many channels (amplifiers) the IFCN modified the 10-20 system adding more electrodes by dividing the 20 % distance and formed the new
„modified 10 % system”. (Fig. 11.)
DERIVATIONS AND MONTAGES
Multichannel EEG records the spatial distribution of brain waves as they change in time. Because there is no zero voltage point in the body, at
differential recording absolute potential value at any electrode can never be measured. Multiple combination of differential electrode recordings is used to arrive the estimate of the voltage pattern in any single electrode.
Derivation: the term used for the combination of electrodes connected to input 1 and 2 of the differential amplifier.
Montage: a particular arrangement of derivations at a multichannel recording.
Bipolar derivation: adjacent electrodes on the head are connected to the inputs of an amplifier.
Bipolar montage: a series of bipolar derivations either longitudinal or transversely across the scalp.
Referential electrode: the name of the electrode that is placed to a relatively distant place from the EEG generators, this way it serves as an „indifferent”
quasi-zero potential electrode. In everyday practice ear electrodes or linked ear electrodes (in research applications nose electrode) are used as
referential.
Common electrode reference montage: if the same electrode – called reference electrode – is connected to the input 2 of each amplifier at a multichannel EEG record.
Average reference montage: all electrodes are added together through high impedance resistors and are connected to input 2 of each amplifier. This serves as reference for each individual electrodes in input 1.
Laplacian montage (Source reference montage): formed by the weighted sum of the electrodes surrounding the electrode connected to input 1. It serves to suppress widespread coherent activity.
STANDARD MONTAGES
In clinical EEG standard derivation arrangements are used, suggested by the International Federation of Clinical Neurophysiology (IFCN) and the
American Clinical Neurophysiology Society. These are longitudinal bipolar (LB), transverse bipolar (TB) and common reference (CER) montages (Fig.
12.). There are additional montages that suit to the diagnostic needs.
a b c
Fig. 12. a: longitudinal bipolar, b: transverse bipolar and c: common reference montages
Ref:
A1-A2
DIGITAL EEG
In PC based EEGs the outputs of the analog amplifiers are fed through a multiplexer to an analog-to-digital converter (ADC) and all further
processing is done digitally. The resolution of the ADC is at least 12 bits.
Modern EEG systems do not use multiplexer but each channel has its 16-24 bit ADC.
Early systems used 200-256/s sampling rate for clinical EEG. Because of high capacity optical and magnetic storage media the storage capacity is no
limiting factor any more, up to date systems use 1000/s sampling rate even at routine EEG examinations. In complex electrophysiological systems sampling rate can go up to 10-20 k samples/s.
Theoretically the sampling rate should correspond to the Nyquist rate (9) but it applies only for pure sine waves. At EEGs usually 6-10 times oversampling is necessary to correctly display e.g. an epileptic spike. Care must be taken
Montage reformatting can be easily made in digital EEGs if recording was made by reference montage. At differential amplifier the output of a channel is the difference of input 1 and 2. This means that the bipolar derivation can be obtained from referential derivations by subtraction:
(Fz – A1) – (Cz – A1) = Fz - A1 - Cz + A1 = Fz – Cz
Commercial clinical digital EEG systems nowadays store the EEG signals in a reference montage and all other montages can be constructed by
preprogrammed simple instructions.
The multichannel EEG is displayed on the PC monitor. Even in the case of HD monitors the resolution of the EEG curves are limited. If 32 channels are displayed the vertical resolution is less than 32 levels. This is compensated by the zoom and other graphic options of the digital display.
The real advantage of digital EEG systems is the data processing capacity of the PCs. Electrophysiological signal processing is discussed in Lecture 12.
CHARACTERISTICS OF THE EEG ACTIVITY
The brain electrical activity can be categorized as spontaneous EEG and event related potentials. In the present lecture the spontaneous EEG is discussed.
The scalp recorded EEG activity is a complex mixture of waves of various lengths and amplitudes. In the normal quiet adult, with closed eyes, the
most conspicuous is the rhythmic 8-12 Hz oscillation recorded mainly from the occipital region of the head. This is the rhythm first recorded and
named as alpha rhythm by Hans Berger (see L. 2.). If rhythmic oscillation dominates the EEG activity, it is traditionally called synchronized. When the recorded subject opens his/her eyes, lower amplitude, faster, irregular waves replace the alpha oscillation. This phenomenon is called
desynchronization, the pattern recorded in alert subject is named beta rhythm by Berger, and in general called desynchronized activity. The frequency bands of the EEG were determined empirically and the Greek
MAIN FEATURES TO DESCRIBE THE EEG
Internationally accepted descriptors are used to characterize the human EEG.
There is more individual variability in the brain activity than e.g. in the
electrocardiogram. The primary evaluation is done visually. Until now there is no generally accepted computer method for automatic evaluation of the clinical EEG in spite of the numerous data processing methods developed (see Lecture 12.).
WAVEFORM AND REPETITION
These terms are used to describe the configuration of the waves.
Monorhythmic activity similar to sine wave are described as regular, sinusoidal. Contrary, the irregular activity is built up from waves of
changing shape and duration. Monorhythmic activities that appear such a way that their amplitude first is increasing and then falling are called
spindles.
Transient is a wave pattern if it appears isolated, it may be simple or complex.
Sharp transient patterns are characteristics of epilepsy, like spikes. Their complex forms are the spike-and-wave complexes or the multispikes. They are called epileptiform activity. Transients may appear as single or in
repetition. A special form of the repetitive transients is the paroxysmal activity that is built up mainly from series of spikes or spike and wave complexes.
FREQUENCY
The frequency bands of the spontaneous EEG activity were determined empirically. They are still used both in clinical practice and in research though computerized EEG frequency analysis can precisely quantify the momentary frequency harmonics and their changes in time.
EEG FREQUENCY BANDS:
Delta band: 1-3.5 Hz Theta band: 4-7.5 Hz Alpha band: 8-13 Hz Beta band: 14-30 Hz
Gamma band: above 30 Hz
The characteristics of the frequency bands will be described later with the normal EEG.
AMPLITUDE
The amplitude of the EEG activity depends on the state of the subject but also shows individual variability. The peak to peak amplitude of the normal EEG activity recorded from the scalp is in the range of 5-100 µV. This is much lower than the amplitude of the brain waves recorded directly on the surface of the neocortex. The attenuation factor is about 20-50 because of the tissues between the cortical surface and the scalp electrode (dura and pia mater, liquor, bone and skin). The amplitude depends on the distance of the scalp electrodes and is increasing up to 8 cm.
In clinical practice EEG is called low amplitude under 20 µV, medium amplitude between 20-50 µV, and high amplitude above 50 µV.
REGIONAL DISTRIBUTION
The normal EEG is symmetrical in the two hemispheres (but see alpha
rhythm). This is why in the standard montages right and left derivations are parallelly recorded (Fig. 12). Pathological changes are often unilateral,
comparison of the activity in the two sides helps to recognize pathological patterns.
REACTIVITY
The spontaneous background activity changes to certain stimulus or
instruction. Best known is the alpha block induced by eye opening (Fig. 2).
Changes can be induced in the occipital records by photic stimulation.
Regional change in the EEG spectrum can be induced by local movement.
In sleeping subject characteristic desynchronization can be induced by arousing stimuli. Reactivity of the EEG is an important sign in comatose
RHYTHMS OF THE NORMAL EEG
ALPHA RHYTHM
The alpha activity is nearly sinusoidal rhythm. It is most prominent in quietly relaxed subject with the eyes closed but not asleep. Its amplitude is highest in the occipital leads, but often spread to the parietal and temporal areas too. The frequency range of the alpha is 8-13 Hz. In an adult individual the frequency of the alpha rhythm is stable, it does not change more than 1 Hz.
The amplitude of the alpha rhythm shows great inter-individual variability.
Some subjects have almost continuous alpha rhythm if their eyes are
closed, others display spindles of alpha, while there are people who have almost no alpha rhythm. All three groups are normal variants of the EEG.
The alpha amplitude is usually symmetrical above the two hemispheres but 50 % amplitude difference is accepted as normal.
The alpha rhythm has a typical age dependent change. A posterior basic rhythm can be detected in babies with frequency of 4 Hz. Its frequency gradually increases and reaches the individual characteristic alpha
frequency at early puberty. The frequency as well as the amplitude of the alpha rhythm tends to decline in elderly people. Alpha frequency below 8 Hz is regarded abnormal even in old age.
BETA RHYTHM
Beta rhythm has usually low amplitude (below 30 µV). The fast activity is fused on the top of slow wave patterns. It is characteristic in awake subject in the frontocentral region. At eyes opening the occipital alpha is also
replaced by beta activity (Fig. 2.).
Beta amplitude increases in some psychiatric illnesses and under effect of drugs.
GAMMA RHYTHM
The frequency band above 30 Hz earlier belonged to the beta band. In the recent decades psychophysiological studies indicated that gamma
oscillation may represent a special pattern related to attention or is related to the brain’s ability to integrate a variety of stimuli into a coherent whole (binding).
THETA RHYTHM
In the early EEG handbooks it was tought that in the EEG of adult, no slower activity than the alpha rhythm may appear in healthy and waking subjects.
Modern computer analysis proved that theta waves are normal in temporal leads mainly in young adults. Theta activity was reported in relation of high emotional states and frontal midline theta activity was shown during
performing mental tasks. Theta activity increases in early stages of sleep.
Theta rhythm is a characteristic pattern in the hippocampus of behaving animals (rodents, cat).
DELTA ACTIVITY
In normal adults delta waves appear only in sleep or it may indicate
pathological process like tumor. Delta activity is normal in infants during the first two years of life.
ADDITIONAL WAVEFORM PATTERNS Mu RHYTHM
This activity is identical in its frequency band to the alpha rhythm but mu rhythm appears above the somatosensory area of the brain in the central leads. It has usually an arch-shaped waves. It can be recorded in awake motionless subject. At movements or at thought of movement the mu
rhythm is blocked above the corresponding contralateral sensomotor area.
Similar, so called sensorimotor rhythm can be recorded in mammals by implanted electrodes above the sensorimotor cortex.
TAU RHYTHM
The tau rhythm is also in the alpha range, it appears over the temporal region. It can be blocked by auditory stimuli.
LAMBDA WAVES
These are transient, isolated, saw tooth shape waves, usually positive in polarity and about 200 ms in duration. They appear at the occipital region of the
scalp. They are related to saccadic or scanning eye movements and may be regarded as evoked potentials.
EEG CHANGES IN SLEEP
In clinical EEG laboratories sleep EEG is recorded to reveal pathological patterns that appear only in sleep or during the transient state between drowsiness and light sleep. Detailed studies of sleep processes are done in special sleep laboratories where polygraphic records are done. To
categorize correctly sleep stages electromyogram (EMG), electrooculogram (EOG) and autonomic manifestations are also recorded. These types of
polygraphic studies gave much information about central organization of sleep and sleep disturbances. Pathological sleep patterns became important not only in neurology and psychiatry but recently also in cardiology.
SLEEP STAGES
Modern terminology differentiate two basically different type of sleep: the
“non-REM sleep” (slow wave sleep) or “REM sleep” (paradoxical sleep).
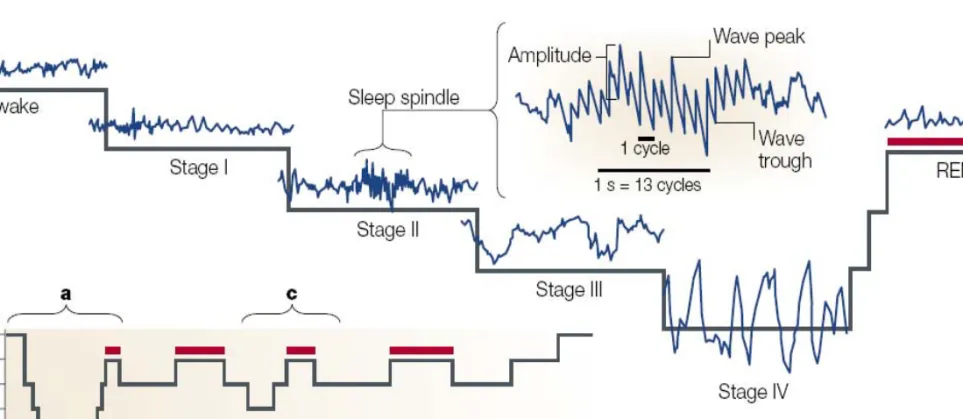
From psychological point of view the transition from wakefulness to sleep (loss of consciousness) is an abrupt change. In the EEG there is no such a sharp transition. (Fig. 12.)
Non-REM sleep stage 1
This is a transitional stage when the alpha activity disappears, the EEG is relatively low amplitude. Most conspicuous is that sharp transient waves appear in the vertex. They look like secondary evoked potentials. In this stage slow lateral eye movements occur and simultaneously in the occipital leads positive occipital sharp transient waves (POSTS) may appear.
Non-REM sleep stage II
This stage of sleep is characterized by low amplitude theta and some delta activity but the most characteristic signs of stage II are the sleep spindle and the K-complex. The sleep spindles are 12-15 Hz sinusoidal oscillations with waxing and waning shape. Recent studies demonstrated that frequency of sleep spindle is individually stable and may reflect cognitive abilities. K- complexes are large amplitude transient patterns with a sharp wave
followed by a slow wave lasting more than 0.5 s. It may be followed by a sleep spindle. Waveform pattern elicited by sensory stimuli can be similar to K-complex, therefore some consider it as evoked potential but the
spontaneous K-complex is different from the evoked responses elicited in this stage of sleep. K-complexes have largest amplitude in vertex leads, often above 200 µV.
Non-REM sleep stage III
As the sleep deepens, gradually more and more slow activity appear. Stage II is dominated by theta and delta waves though the sleep spindles and K
complexes still appear. The amplitude of more than 20-50% of the waves is above 75 µV but in 10 s period there should not be more than two waves with amplitude exceeding 100 µV and frequency less than 2/s.
Fig. 13. Stages of sleep
a: EEG characteristics of sleep stages, b: Sleep cycles of a whole night sleep (red bars: REM stages)
Reprinted by permission from Macmillan Publishers Ltd: Pace-Schott, E.F.,Hobson, J.A.: The neurobiologyof sleep: genetics, cellular physiology and subcortical networks. Naturee Reviews Neuroscience, 3: 591-605, copyright 2002
Reprinted by permission from Macmillan Publishers Ltd: Pace-Schott, E.F.,Hobson, J.A.: The
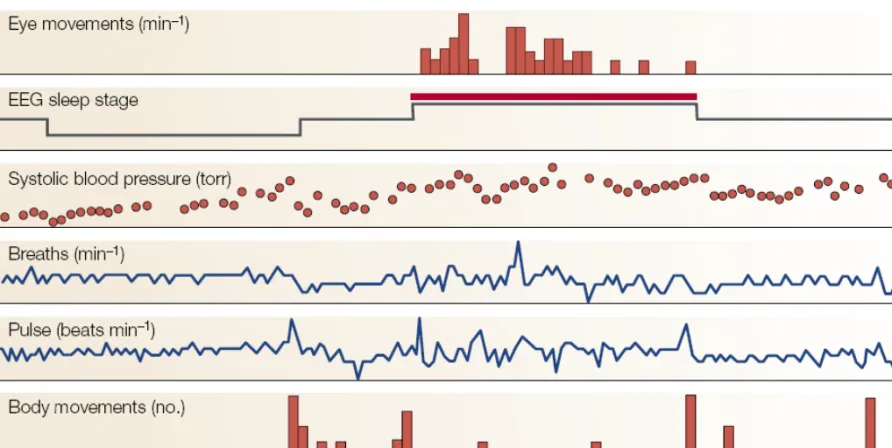
Fig. 14. Physiological manifestations of a sleep cycle
Non-REM sleep stage IV
In the deepest stage of non-REM sleep diffuse delta activity exceeding 100 µV is dominating the EEG. The stage III and IV are often called slow wave sleep. Since in digital EEG the recorded low frequency band was shifted to 0.1 Hz, oscillation of 1 Hz or below was recognized in this stage of sleep.
In animal studies two phases of the slow sleep oscillation (SSO) were
characterized. During the surface negative phase the depth of the cortex local positive wave appears and the neurons are silent. During the surface positive phase of the slow waves the intracortical negativity is accompanied by increased firing of the neurons and in the local fields potential gamma oscillation appears. These alternating patterns are named down- and up- states, respectively.
REM sleep
This stage of sleep appears after a certain time the sleep reached the deepest stage of non-REM sleep. The EEG gradually becomes desynchronized, almost similar to the alert wakefulness still the subject is deeply sleeping (paradoxical sleep). The arousal threshold is often higher than in slow wave sleep. The muscle tone of the large antigravity muscles disappear, only
occasional twitches of the muscles of the face and the extremities occur.
The most characteristic feature of this stage is the rapid saccadic eye
movements (REM) that appear in groups (Fig. 13.). Simultaneously with these eye movements saw-tooth like waves can be recorded in the occipital and vertex leads. In animal studies similar waves were recorded in the pons and in the lateral geniculate body therefore they are called ponto-geniculo- occipital (PGO) waves.
Until recently the general view was that during this stage of sleep dreams appear, sometime it was called dream stage of sleep. According to recent studies dreams may appear in any stages of sleep but it is true that in the REM stage the probability of dreams is higher.
The REM stage is ended by awakening of the subject or by reappearance of the slow waves and a new cycle of non-REM sleep occurs.
SLEEP CYCLES
A normal night sleep is built up from cycles of slow wave- and REM-sleep phases. The cycles starts the gradually deepening non-REM sleep to the Stage IV. Then the sleep changes to more superficial and a REM phase appears. A full night sleep contains 4-6 such cycles, a cycle lasts about 60- 120 min. (Fig. 12. b.)
An adult spends about 2-10 % of the total night sleep in Stage I, 40-55 % in Stage II, 5-10 %in Stage III, and 15-20 % in Stage IV. The average REM stage duration is the 25 % of the total sleep time in young adult. In old age the proportion of both the Stage IV and the REM sleep decreases.
ARTIFACTS
Because of the small signal amplitude as well as because technical failures noises and disturbing electrical phenomena called artifacts, may cause problems in EEG recording. They can originate from a variety of sources.
The identification and elimination of the activity not coming from the brain are often hard task. Artifacts can originate from the subject or from the
apparatus and the environment therefore they are called physiological and nonphysiological artifacts.
NONPHYSIOLOGICAL ARTIFACTS Electrode problems:
High impedance is the most often occurring problem. Insufficient preparation of the skin or not enough electrode gel may be the reason, why 50 Hz (60 Hz in the USA) line artifact appears in the record.
Electrode movement artifact may be caused by movements of the subject if electrode is not well fixed. Pathological movements like tremor may induce rhythmic movement of the electrodes.
Contact problems can occur at the Ag/AgCl-lead junction or at the connector of the lead.
Machine faults:
Design and construction of modern EEG apparatuses minimized the incidence of failure of parts. Still bad connections or power failures may occur.
Careful calibration of the machine before recording helps to recognize problems. Software problems may also appear.
Checking the performance of the digital system must be done periodically.
Environmental artifacts:
Line interference is the most often occurring artifact. As mentioned above 50 Hz noise may be caused by poor electrode preparation. Important to avoid ground loops or double grounding that may be the source of line
interference. There are special safety rules for human electrophysiological recordings to prevent accidents from electrical currents.
Radiofrequency artifacts: Transient electromagnetic noise may come from the operating room by electrocautery and bipolar coagulator. Permanent
radiofrequency noise may be caused by microwave oven. Mobile telephones or high energy radio or TV stations can also give rise to interference.
PHYSIOLOGICAL ARTIFACTS Eye movements
Because of the electrical properties of the retina there is a corneoretinal DC potential difference of about 50-100 mV. The cornea is positive to the retina. The movements of the eyeball elicit potential changes that spread with volume conduction to the frontal area of the head and may appear as eye movement artifact in the frontotemporal leads. When the eye is closed the eye turns upward (Bell Phenomenon) and the eyelid provides
conduction path toward the forehead. This means that at eye closure and eye opening opposite polarity artifact appears (Fig. 2.).
Anxious patients are unable to control repetitive ocular movements they often have eye flutter. Pathological nystagmus also induces eye movement
artifacts. Eye movements are usually symmetrical and the large amplitude artifacts in the frontal EEG appear also symmetrically in the two sides.
Recording the potential changes elicited by eye movements by electrodes
placed to lateral and above and below the eyes called electrooculography is used in sleep studies and in psychophysiology to monitor eye movements.
Eye movement artifacts often appear connected to external stimuli. They cause problems in ERP studies. Softwares were developed to automatically suppress eye movement artifacts.
Galvanic skin response
In warm environment perspiration may cause high amplitude slow potential shifts in the EEG record. This is caused by the impedance changes of the skin caused by sweating.
Myogenic artifacts
Action potentials of striated muscles – known as electromyogram or EMG (see L. 11.) – have a frequency spectrum that overlaps with that of the high frequency EEG. If the patient is not relaxed during the EEG record – this often happen in children – EMG artifacts get intermingled with the brain activity or even may mask it. Filtering out high frequency components can suppress muscle artifact but this procedure may distort high frequency EEG waves like spikes. Facial and jaw movements cause bursts of muscle
artifacts. Reflex twitches of muscles like blink at flash stimuli and post auricular muscle twitch at strong auditory clicks may appear as artifact in evoked potentials.
Electrocardiographic artifact
The amplitude of the R wave of the electrocardiogram (EKG) is 50-100 times higher than the amplitude of the EEG. The EKG is practically equipotential over the scalp therefore no artifact appears at bipolar leads. However if the reference electrode is out of the equipotential zone large amplitude artifact may occur. This is one of the reasons why extracranial reference electrodes are not used in the everyday practice.
Pulse artifact
Each heart contraction sets off a pulse wave in the arteries. If a scalp electrode is above an artery this pulse wave may cause movement of the loosely
fixed electrode accompanied by an artifact. Similarly the oscillation
accompanied to the pulse wave called ballistocardiogram may appear as a repetitive low amplitude oscillation artifact in the EEG.
REFERENCES
1. http://www.faqs.org/health/bios/26/Hans-Berger.html 2. http://en.wikipedia.org/wiki/String_galvanometer
3. Fisch, B.J.: Fish and Spehlmann’s EEG Primer (3rd ed.), Elsevier, Amsterdam, 1999.
4. Ebersole, J.S., Pedley, T.A.: Current Practice of Clinical Electroencephalography, Lippincott Williams and Wilkins, Philadelphia, 2003.
5. Cooper, R., Binnie, C.D., Billings, R.: Techniques in Clinical Neurophysiology A Practical Mannual, Elsevier, Amsterdam, 2005.
6. http://wwww.egi.com/clinical-division-clinical-products/c-gsh
7. Deuschl, G., Eisen, A.: Recommendation for the Practice of Clinical Neurophysiology: Guidelines of the International
Federation of Clinical Neurophysiology (2nd ed.) Electroenceph. clin. Neurophysiol. Suppl. 52., Elsevier, Amsterdam, 1999.
8. Niedermayer, E., Lopes Da Silva, F., (eds): Electroencephalograhy: Basic Principles, Clinical Applications, and Related Fields, (5th ed.) Lippincott Williams and Wilkins, Philadelphia, 2005.
9. http://en.wikipedia.org/wiki/Nyquist–Shannon_sampling_theorem 10. http://www.brainproducts.com/products_by_type.php?tid=3 11. http://www.biosemi.com/flat_electrode.htm
12. Squire, L.R et al. (eds.) Fundamental Neuroscience. (Second ed.) Academic Press, 2003.
13. Pace-Schott, E.F.,Hobson, J.A.: The neurobiologyof sleep: genetics,cellular physiologyand subcortical networks. Natur Reviews Neuroscience. 2002, 3: 591-605
REVIEW QUESTIONS
What are the characteristic EEG bands?
What type of electrodes are used in clinical EEG?
What is the „international 10-20 system”?
What is the difference between the bipolar and monopolar derivations?
What is „montage reformatting”?
What are the characteristics of the synchronized and desynchronized EEG activity?
Why is the amplitude of the scalp EEG lower than the amplitude of the electrocorticogram?
Describe the stages of the Non-REM sleep.
What are the EEG characteristics of the REM sleep stage?
List the nonphysiologycal EEG artifacts.
Which are the physiological EEG artifacts?