Laser power modulation with wavelength stabilization in multiple exposure laser speckle contrast analysis
Tomi Smausz*, Dániel Zölei, Béla Hopp
Dept. of Optics and Quantum Electronics, University of Szeged, H-6720 Szeged, Hungary
ABSTRACT
Switching mode intensity modulation had been applied to the illumination of a LASCA system using multiple exposure times to substitute a variable neutral filter, which allows the variation of the exposure time from frame to frame. In most cases the direct current (DC) control of the laser intensity can lead to changes in the wavelength of regular laser diodes.
The use of pulsed mode operation can avoid the mode hopping of the laser light while it offers the tuning of the average intensity in a wide range. While operating the camera at a constant integration time, the length of the exposition was varied from 2 ms to 100 ms by changing the duration of the illuminating laser pulse train. The pulse train was built up of 10 pulses, each having the length of 40 μs with variable separation time. The mode stability of the light source was monitored with a spectrometer, meanwhile speckle images of a static scattering surface were recorded as well. This paper demonstrates the usefulness of this technique in a multi-exposure LASCA system for monitoring the changes in the skin perfusion.
Keywords: full-field LASCA, multiple exposure times, modulated laser illumination
* tomi@physx.u-szeged.hu; phone +3662544657; fax +3662544658
1. INTRODUCTION
The full-field LASCA (Laser Speckle Contrast Analysis) has been introduced by Fercher and Briers in 1981 for monitoring blood perfusion of tissues [1] and was later implemented also for use with digital cameras [2]. The simplicity and cost-effectiveness of the method and the possibilities given by the computer based analysis made LASCA become very popular. The technique has been applied mainly for cerebral [3-7] and ocular [8-10] blood flow measurements.
However, its applicability for skin perfusion measurements is limited by the strong static scattering of the surface [11-13]
and the motion of the cutaneous tissue.
When coherent light falls on an optically rough surface, after scattering, it creates a random interference pattern (speckles) on the film or chip of the camera [1] which images the illuminated surface. If the illuminated object is still, this pattern remains also static. However, if the surface moves or the object contains moving parts (e. g. red blood cells or microspheres), the pattern changes in time which blurs the image recorded at a given exposure time. The value of the local contrast calculated on the illuminated area can give information about the speed of the movement.
The contrast is influenced by the autocorrelation decay time of the intensity changes of the pixels (mentioned as correlation time in the further parts of the paper) which is supposed to be inversely proportional to the average velocity of the scattering particles of the sample. Fercher and Briers gave the first mathematical expression making connection between the contrast, the exposure time and the correlation time [1]. This was later modified by Bandyopadhyay et. al.
[14], Duncan et. al. [15], and Rojas et. al. [16]. The contribution of the non-moving scatterers to the formation of speckle pattern was not taken into consideration by these formulas. These deficiencies were later corrected by a model developed by Zakharov et. al. [17].
While the methods mentioned above applied single exposure time imaging, multiple exposure time methods were proposed by Parthasarathy et al. [18] and Smausz et. al. [19, 20] to increase the accuracy of the measurements. In our earlier studies the effectiveness of the following formula combined with wide range of exposure times was demonstrated:
2 / 1 2 2 2
2 2 1
1 2 exp 2
) 2
( ⎭⎬⎫
⎩⎨
⎧ ⎥+
⎦
⎢ ⎤
⎣
⎡ ⎟− +
⎠
⎜ ⎞
⎝
= ⎛ − T T P
P T T
K
τ τ
τ
, (1)where K is the local contrast practically calculated on 5 by 5 pixels areas, T is the exposure time, τ is the correlation time, P1 describes the contrast-decreasing effects (multiple scattering, depolarization, etc.), while P2 characterizes the contribution of the time-independent (static) scattering. In practice P1, P2 and τ are determined by fitting the above formula to the contrast values measured at different exposure times. The use of different exposure times requires the proper change of the illuminating light intensity, which can be realized in different ways:
a) A variable neutral density filter – also applied in our earlier experiments – is probably the simplest device to attenuate the light intensity. The main disadvantage of this method is that moving the filter in the right position needs relatively long time which highly decreases the temporal resolution of the method.
b) Though the use of an AOM (acousto optical modulator) [18] or EOM (electro optical modulator) can provide the fastest and most accurate intensity variation, they have a relatively high cost.
c) The intensity of the illumination can be also controlled by the direct control of the diode laser current.
Unfortunately, when using conventional laser diodes, this can lead to mode hops and the detrimental alteration of the speckle pattern. This problem can be avoided by the use of relatively expensive DFB (distributed feedback) laser diodes.
The direct current (DC) control of the laser diode can lead to spectral instability of the emitted light. However, the use of pulse trains composed of similar pulses with variable separation time can highly increase the mode stability of the lasing wavelength. The aim of our study is to demonstrate the applicability of a cost-effective switching mode control of the laser diode current providing the proper average light intensity without the occurrence of mode hopping.
2. EXPERIMENTAL SETUP
The monitored surface was illuminated by the polarized light of a near infrared diode laser (Sanyo DL-8141-002, 808 nm wavelength, 200 mW maximum output power) in an area of ~100 cm2 with approx. 15º inclination as compared to the normal of the surface (Figure 1). To avoid any changes of the properties of the light beam, we built the laser diode into a Thorlabs LDM21 mount, which was connected to a Thorlabs TED200C controller to stabilize the temperature. The driving current of the laser diode was delivered by a Thorlabs LDC220C laser diode power supply, externally controlled by a home-made programmable modulator. The speckle images were recorded by a Pixelink PL-B741F monochrome camera (1280×1024 pixels, operated at constant 100 ms integration time) equipped with a colour filter and a polarizer.
The polarizer was set as to minimize the direct reflection from the illuminated target. 20 images were recorded for each applied exposure time values (2, 5, 10, 20, 50 and 100 ms, respectively). Control measurements were made on still and flowing latex microsphere suspension (2% concentration, Duke Scientific, 3 μm diameter) and in-vivo on the skin of the fingers. The spectrum of the emitted laser light was monitored by an Avantes AvaSpec-2048 digital spectrometer.
3. RESULTS AND DISCUSSION
3.1 Determination of the optimal parameters of the illumination
The average intensity of the laser light was controlled by switching it on and off periodically. As a result the laser output was supposed to be formed by a train of constant number of identical square pulses with variable spacing between them.
The train length corresponded to the illumination time (exposure time) while the constant number of identical pulses assured the same average intensity reaching the camera during every exposure. To achieve the best stability, the optimal timing and current setting had to be found. First, the duration of the pulses had to be determined. The modulation bandwidth of the laser controller was 50 kHz, which resulted in a ~5 μs rise (0-90%) and fall (100%-10%) time when switching the current on and off, respectively. Since the operating wavelength depended on the driving current, the rise and fall period had to be shorter than the stable part for every pulse. This gave a lower boundary for the duration of one pulse. In the same time, the pulses should not be too long because it would limit the number of pulses in the pulse train.
30000 25000
c 20000
- 15000 10000- 0
- 5000-
0 0-
4J
0U 4J0 0
0
50000
40000- 30000- 20000- 10000- 0-
804 805 806 807 808 sog 810 811
Wavelength (nm)
803 804 805 806 807 808 80 810
Wavelength (nm)
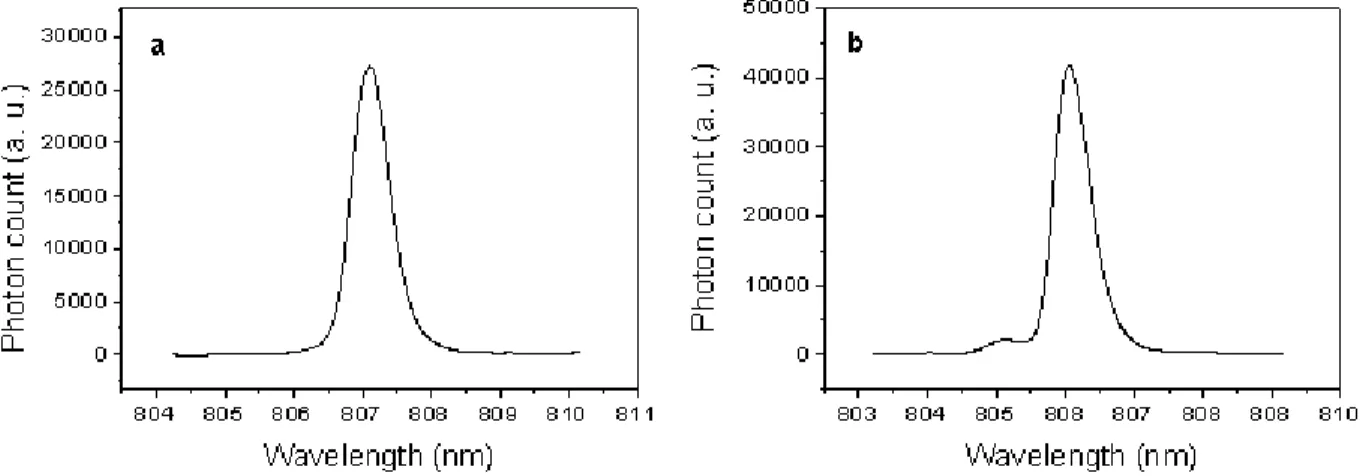
Generally, the higher the number of the pulses in the train was, the better time averaging was obtained. However, the longer the pulses were, the better wavelength stability could be achieved. As a compromise, a pulse train was formed of 10 pulses each having the duration of 40 μs. The wavelength stability was optimized by finding the appropriate peak current and temperature, which were 230 mA and 28.85°C, respectively. Aside the continuous measurement of the wavelength, speckle images were continuously recorded from a white paper. Since the mode hops resulted in an immediate change of the interference pattern, we could monitor them also in this way. Figure 2. shows a typical laser spectrum at constant current operation mode and at switching mode. The small ‘leg’ on part (b) near to the main peak is attributed to the rise and fall time of the driving current.
Figure 1. The experimental imaging setup.
Figure 2. The characteristic laser spectrum at constant current operation mode (a) and at switching mode (b). The small ‘leg’
near to the main peak in (b) is attributed to the change of the driving current during the rise and fall time.
3.2 Measurements on microsphere suspension and skin
The contrast-exposure time (pulse train length) curves were measured on still microsphere suspension and white paper.
The monitored area was partly covered by 50 and 100 μm thick semi-transparent and well-scattering Teflon foil, which imitated the static scattering from the skin surface (Figure 3). The contrast obtained on the white paper was an indicator of the wavelength stability during the measurement. The contrast values measured on the suspension proved that the separation time of the pulses applied in the train did not cause the distortion of the K(T) curve even at 100 ms ‘exposure
time’. If the separation time would be too high, it would cause downsampling and improper averaging which would result in the early flattening of the contrast curve at higher exposure values.
1 10 100
0.10 0.15 0.20 0.25 0.30 0.35
white paper
100 mm Teflon covered 50 mm Teflon covered uncovered
Contrast (a. u.)
Pulse train length (ms)
Figure 3. The contrast values measured on white paper, uncovered still Latex microsphere suspension and that covered by 50 μm and 100 μm thick Teflon foil. The shift of the curves is caused by the light scattering on the static parts.
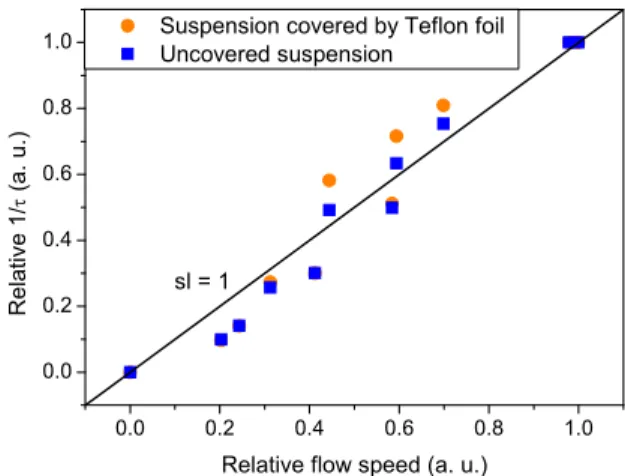
The illumination technique was also tested on microsphere suspension flowing through a transparent silicon pipe which was partly covered by 50 μm thick Teflon layer. The K(T) curves were measured at different flow velocities and the correlation times were determined by fitting. The results are presented on Figure 4. The relative flow speed and the measured relative 1/τ values were in good agreement.
0.0 0.2 0.4 0.6 0.8 1.0
0.0 0.2 0.4 0.6 0.8
1.0 Suspension covered by Teflon foil Uncovered suspension
Relative 1/τ (a. u.)
Relative flow speed (a. u.) sl = 1
Figure 4. The relative 1/τ values with respect to the relative flow speed measured with the switching mode modulation method. A line with the slope of 1 is also plotted as reference.
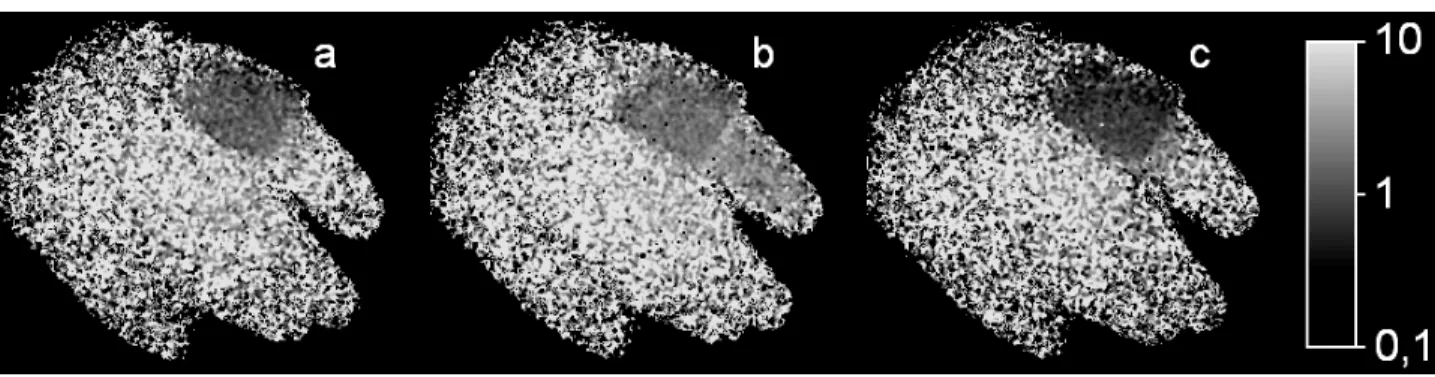
We also performed measurements on the hand and the fingers. The cuff of a sphygmomanometer generally used for newborns was put on the first finger of a healthy adult volunteer. The first measurement was done before any stimuli were applied. The second series was recorded after applying ischemia to the first finger by setting the pressure of the cuff to 200 mmHg. The third measurement was performed after releasing the cuff. The results of the three measurements are shown on Figure 5a-c, respectively. It can be seen clearly that the perfusion was similar on the whole hand before the stimulus. When the vessels of the first finger were closed by applying ischemia, the perfusion of the finger significantly decreased, while the other areas of the hand remained unchanged. After dissolving ischemia the perfusion returned to its
original value on the stimulated finger. The 1/τ value measured on the cuff is not a real flow speed; instead, it gives information on the tremor of the hand during the measurement. It shows that during the ischemia the tremor slightly increased, which might had an influence on the measured perfusion of the finger.
Figure 5. The skin perfusion of the hand and the finger before applying (a), after applying (b) and dissolving (c) ischemia on the first finger. The greyscale value on the cuff gives indication about the increased tremor during the ischemia. It also shows that the perfusion in the stimulated finger significantly decreased.
4. SUMMARY
We worked out a switching mode method for controlling the intensity of the light of a regular laser diode used in our LASCA system. The basis of this method is that the light of the laser diode is formed of a pulse train. The different exposure times (illumination times) were obtained by using constant number of similar pulses with variable spacing between them. The optimal timing, peak current and temperature parameters were determined in order to obtain a stable emission spectrum without any mode hops during the measurements. The system stability was confirmed by monitoring the contrast measured on a fixed white paper at a wide range of pulse train lengths (exposure times). Measurements on flowing latex microsphere suspension showed a good agreement between the flow speed and the inverse correlation time. Finally, we demonstrated the abilities of our system by measuring the change of the perfusion of the first finger by applying ischemia. The presented method offers a low-cost possibility for changing the ‘exposure time’ from frame to frame which is required to increase the temporal resolution of the multi-exposure LASCA method aiming a real-time monitoring.
5. ACKNOWLAGEMENT
We would like to thank the co-workers of the Institute of Engineering and Materials Science, University of Szeged for laying out and assembling the controller circuits.
The authors gratefully thank the National Development Agency of Hungary with financial support from the Research and Technology Innovation Fund (CNK-78549).
The publication is supported by the European Union and co-funded by the European Social Fund.
Project title: “Broadening the knowledge base and supporting the long term professional sustainability of the Research University Centre of Excellence at the University of Szeged by ensuring the rising generation of excellent scientists.”
Project number: TÁMOP-4.2.2/B-10/1-2010-0012
REFERENCES
[1] Fercher, A. F. and Briers, J. D., “Flow Visualization by Means of Single-Exposure Speckle Photography,” Opt.
Commun. 37(5), 326-330 (1981)
[2] Fercher, A. F., Webster, S., “Quasi real-time digital version of single-exposure speckle photography for full- field monitoring of velocity or flow fields,” Opt. Commun. 116, 30-42 (1995)
[3] Dunn, A. K., Devor, A., Bolay, H., Andermann, M. L., Moskowitz, M. A., Dale, A. M., and Boas, D. A.,
“Simultaneous imaging of total cerebral hemoglobin concentration, oxygenation, and blood flow during functional activation,” Opt. Lett. 28(1), 28-30 (2003)
[4] Kharlamov, A., Brown, B. R., Easley, K. A., and Jones, S. C., “Heterogeneous response of cerebral blood flow to hypotension demonstrated by laser speckle imaging flowmetry in rats,” Neurosci. Lett. Suppl. 368 151–156 (2004)
[5] Li, P. C., Ni, S. L., Zhang, L., Zeng, S. Q., and Luo, Q. M., “Imaging cerebral blood flow through the intact rat skull with temporal laser speckle imaging,” Opt. Lett. 31(12) 1824–1826 (2006)
[6] Farkas, E., Bari, F., and Obrenovitch, T. P., “Multi-modal imaging of anoxic depolarization and hemodynamic changes induced by cardiac arrest in the rat cerebral cortex,” Neuroimage 51(7) 734-742 (2010)
[7] Domoki, F., Zölei, D., Oláh, O., Tóth-Szűki, V., Hopp, B., Bari, F., Smausz, T., “Evaluation of laser-speckle contrast image analysis techniques in the cortical microcirculation of piglets,” Microvasc. Res. 83(3) 311-317 (2012)
[8] Aizu, Y., Ogino, K., Sugita, T., Yamamoto, T., Takai, N., and Asakura, T., “Evaluation of blood flow at ocular fundus by using laser speckle,” Appl. Opt. 31(16) 3020–3029 (1992)
[9] Nagahara, M., Tamaki, Y., Araie, M., and Fujii, H., “Real-time blood velocity measurements in human retinal vein using the laser speckle phenomenon,” Jpn. J. Ophthalmol. 43(3) 186–195 (1999)
[10] Srienc, A. I., Kurth-Nelson, Z. L., and Newman, E. A., “Imaging retinal blood flow with laser speckle flowmetry,” Front. Neuroenerg. 2:128. doi: 10.3389/fnene.2010.00128 (2010)
[11] Ruth, B., Schmand, J., and Abendroth, D., “Noncontact determination of skin blood flow using the laser speckle method: Application to patients with peripheral arterial occlusive disease (PAOD) and to type-I diabetics Lasers,” Surg. Med. 13(2) 179-188 (1993)
[12] Forrester, K. R., Stewart, C., Tulip, J., Leonard, C., and Bray, R. C., “Comparison of laser speckle and laser Doppler perfusion imaging: measurement in human skin and rabbit articular tissue,” Med. Biol. Eng. Comput.
40 687-697 (2002)
[13] Stewart, C. J., Frank, R., Forrester, K. R., Tulip, J., Lindsay, R., and Bray, R. C., “A comparison of two laser- based methods for determination of burn scar perfusion: Laser Doppler versus laser speckle imaging,” Burns 31 744–752 (2005)
[14] Bandyopadhyay, R., Gittings, A. S., Suh, S. S., Dixon, P. K., and Durian, D. J., “Speckle-visibility spectroscopy: a tool to study time-varying dynamics,” Rev. Sci. Instrum. 76 093110 (2005)
[15] Duncan, D. D., Kirkpatrick, S. J., and Wang, R. K., “Statistics of local speckle contrast,” J. Opt. Soc. Am. A 25(1) 9 –15 (2008)
[16] Rojas-Ochoa, L. F., Lacoste, D., Lenke, R., Schurtenberger, P., and Scheffold, F., “Depolarization of backscattered linearly polarized light,” J. Opt. Soc. Am. A 21(9) 1799–1804 (2004)
[17] Parthasarathy, A. B., Tom, W. J., Gopal, A., Zhang, X., and Dunn, A. K., “Robust flow measurement with multi-exposure speckle imaging,” Opt. Express 16(3) 1975-1989 (2008)
[18] Zakharov, P., Völker, A. C., Wyss, M. T., Haiss, F., Calcinaghi, N., Zunzunegui, C., Buck, A., Scheffold, F., Weber, B., “Dynamic laser speckle imaging of cerebral blood flow,” Opt. Express 17(16) 13904-13917 (2009) [19] Smausz, T., Zölei, D., and Hopp, B., “Determination of Real Correlation Time and Calibration in Laser Speckle
Contrast Analysis,” [Book of abstracts of 16th Int. Conf. on Advanced Laser Technologies 2008], LaserSkill Ltd., ISBN 978-963-06-5737-2 (2008)
[20] Smausz, T., Zölei, D., Hopp, B., “Real correlation time measurement in laser speckle contrast analysis using wide exposure time range images,” Appl. Opt. 48(9) 1425-1429 (2009)