De-Internationalisation Patterns in Hungary
MIKLÓS STOCKER, Ph.D.
SENIOR ASSISTANT PROFESSOR
CORVINUS UNIVERSITY OF BUDAPEST e-mail: miklos.stocker@uni-corvinus.hu
SUMMARY
The debate on firm internationalisation has predominantly focused on different aspects connected to growth. However, the notion of de-internationalisation is not as popular, although it could also contribute significantly to our understanding of internationalisation. This paper focuses on de-internationalisation, its different modes and patterns followed by companies in the Hungarian context. Three hypotheses are tested: that de-internationalisation is a mass phenomenon, after de-internationalisation most companies are terminated, and de-internationalisation does not mean the end of international exposure. To test these hypotheses the Hungarian Corporate Tax Database was used with which the whole population of Hungarian companies in the years from 2009 to 2014 was analysed. The database consists 385,723 companies in 2009 and 422,500 companies in 2014, which is the whole Hungarian private sector. Among these companies 73,442 companies were registering export revenues, but this seems to be stable only for a smaller amount of companies.
De-internationalisation is uncovered in this paper with different patterns followed by companies in the Hungarian context.
Keywords: de-internationalisation, mortality of de-internationalised companies, de-internationalisation patterns, foreign market entry, exits and re-entries
Journal of Economic Literature (JEL) code: F23 DOI: http://dx.doi.org/10.18096/TMP.2017.01.09
I NTRODUCTION
There is a lively debate in international business literature about firm internationalisation which focuses on several aspects connected to growth. A distinct aspect of de-internationalisation, or the reverse of internationalisation, is not as popular, however, although it could also contribute significantly to our understanding about internationalisation. This paper aims to focus on de- internationalisations, its different modes and patterns followed by companies in the Hungarian context. The Hungarian Corporate Tax Database is used in the present study, whereby the whole population of Hungarian companies in the years between 2009 and 2014 was analysed. The database consists of 385,723 companies in 2009 and 422,500 companies in 2014, which is the whole Hungarian private sector. Among these companies significant amount is conducting international trade, but this seems to be stable only for a smaller amount of companies. De-internationalisation however seems to be a – so-far hiding – natural process. The aim of this paper is to uncover de-internationalisation and show its patterns followed by companies in the Hungarian context.
L ITERATURE R EVIEW
Although foreign market entry seems to be much more fancy (and therefore more researched) in the literature, but it has to be reconsidered in the light of foreign market exit knowledge as exporting longevity is far from ideal.
Bonaccorsi (1992) examined Italian exporting companies in the 70’s and the 80’s and found that only a small portion of companies were stable exporters. In the seven-year period of 1978-1984 45.2% of exporting companies, namely 104,910 companies exported for only one year, and only 28.5% exported for at least four years in the given seven year period.
“One third of firms exporting in one year did not export the previous year. There is therefore a very high turnover of exporting companies” (Bonaccorsi, 1992: 617)
As entering foreign market is frequent, exiting foreign market is also a mass phenomenon, which opens the floor for de-internationalisation research. Benito and Welch (1997) defined de-internationalisation in their seminal paper as:
“any voluntary or forced action that reduce a company’s engagement in or exposure to current cross- border activities. In extreme case, of course, a company
may withdraw completely from international operations – what may be termed full or complete de- internationalisation”. (Benito and Welch, 1997: 9)
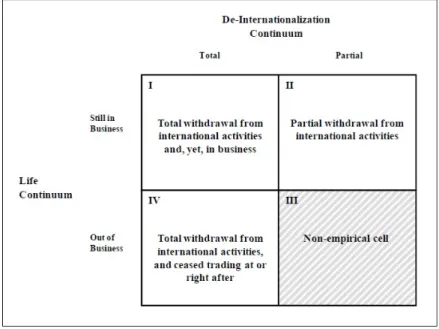
Turcan (2011) focused on the different modes of de- internationalisation and created a typology as it can be seen in Figure 1. According to modes of de-internationalisation Turcan (2011) distinct total and partial withdrawal from export market. Total withdrawal can be because of ceasing trading (i.e. dissolving the company) or focusing on home market, whereas partial withdrawal can be because of optimising number of markets, reducing operations or changing entry mode. Benito and Welch (2007) are not
focusing as much on termination, but they also list different forms of de-internationalisation, such as
“reduction of operations, in whatever form, in a given market or withdrawal from that market;
switching to operation modes that entail a lower level of commitments;
sell-off or closure of foreign sales, service or manufacturing subsidiaries;
reduction of ownership stake in a foreign venture;
seizure by local authorities of assets owned by a foreign company” (Benito and Welch, 1997: 9)
Source: Turcan 2006 in Turcan 2011 pp. 21
Figure 1. Typology of de-internationalisation
D ATA AND M ETHODS
In this paper the de-internationalisation patterns of Hungarian companies are analysed, according to their business performance. The whole Hungarian private sector was analysed with the full Hungarian Tax Database from the Hungarian Tax Authority for six years (2009-2014).
This database include data from basic financial statements and some additional tax data for all companies following the double-entry bookkeeping system. The period taken for analysis is 6 years (from 2009 to 2014).
All companies which recorded exporting revenues in the period of analysis were included in the research. The population of the Hungarian private sector and the number
of exporters can be seen in table 1. It has to be noted however that internationalisation is not only about exporting relationships, different methods (licensing, franchising, joint-venturing and strategic alliances) should have been taken into account as well as importing relationships. Financial data are, however, only available from export revenues, therefore in this level of explorative research only these data could have been considered. In a latter phase with more in-depth analysis other methods can be analysed as well.
According to Bernard et al. (2007), while 4% of the companies are exporters in the US, this figure is doubled in the Hungarian context, which can be explained by the openness and the integration of the Hungarian economy into the European Union.
Table 1
Population of Hungarian firms in the private sector and number of Exporters
2009 2010 2011 2012 2013 2014
Private Sector (N) 385 723 392 670 409 007 424 815 425 739 422 500 Exporters (n) 28 336 30 117 32 192 32 862 34 346 35 095
7.35% 7.67% 7.87% 7.74% 8.07% 8.31%
Source: Author’s calculation
Companies are registered with an ID number in the database which can be tracked in each and every year of the database, therefore longitudinal analysis is conducted according to several aspects.
D ISCUSSION OF K EY F INDINGS
The number of exporters in Hungary is steadily growing with around 4.37% CAGR in the period of
analysis which strongly outperforms the growth of the number of companies (1.84% CAGR) which can be seen in Table 2. As in 2013 the government has made stricter regulations for founding new firms the negative growth in 2014 is understandable. Even more important that new registry and authorised share capital regulations hit small and/or non-functioning SMEs the hardest, therefore more exit is expected from 2014-2017. Numbers of exporting companies are rising, however, and the mentioned effects are not expected to take their toll on exporters.
Table 2
Growth in number of companies and exporters in Hungary
2009 2010 2011 2012 2013 2014 CAGR
Growth in Nr of companies
in Private Sector (%) 2% 4% 4% 0% -1% 1.84%
Growth in Nr of exporters (%) 6% 7% 2% 5% 2% 4.37%
Source: Author’s calculation
Hypothesis 1: De-internationalisation is a mass phenomenon
It is interesting to see that although the number of exporters is rising, their fluctuation is serious. It can be
seen in Table 3 that from the 28,336 companies which were exporting in 2009 only 19,163 were exporting in 2010 and 13,429 in 2014. This pattern is very similar throughout the different starting years.
Table 3
Number of companies exporting in different years in the period of analysis
Nr. of Exporting Companies
Exporting to year …. From given
year to 2014
2009 2010 2011 2012 2013 2014
Exporting from year …
2009 28 336 19 163 17 129 15 302 14 269 13 429 9 533
2010 19 163 30 117 20 626 17 831 16 479 15 312 11 571
2011 17 129 20 626 32 192 21 428 19 184 17 667 14 281
2012 15 302 17 831 21 428 32 862 22 691 20 226 18 004
2013 14 269 16 479 19 184 22 691 34 346 23 848 23 848
2014 13 429 15 312 17 667 20 226 23 848 35 095 35 095
2009 100,0% 67,6% 60,4% 54,0% 50,4% 47,4% 33,6%
2010 63,6% 100,0% 68,5% 59,2% 54,7% 50,8% 38,4%
2011 53,2% 64,1% 100,0% 66,6% 59,6% 54,9% 44,4%
2012 46,6% 54,3% 65,2% 100,0% 69,0% 61,5% 54,8%
2013 41,5% 48,0% 55,9% 66,1% 100,0% 69,4% 69,4%
2014 38,3% 43,6% 50,3% 57,6% 68,0% 100,0% 100,0%
Source: Author’s calculation
Benito and Welch (1997) stated that in extreme cases companies can even withdraw from international operations. Based on the evidence from Hungarian exporters, after each and every year in the period of analysis around 30-33% of the exporting companies are ceasing their exporting operation, which is not including the partial withdrawal scenarios.
Only 33.6% (9,533) of the 28,336 exporting companies from 2009 were exporting throughout the six year period of analysis. From the exporters of 2010, 38.4% (11,571) were exporting in every year of the five year period. 44.4%
of the exporters from 2011 were able to export throughout their four year period, 54.8% of 2012’s exporters were exporting in the three year period and only 69.4% of 2013’s exporters were exporting in 2014 as well.
The fluctuation in Table 3 can be viewed from a different perspective as well. In 2009 28,336 companies were exporting, out of which only 19,163 companies were exporting in 2010, but an additional 10,954 companies were exporting as well in 2010. Most of these companies were newcomers to export, but some of them were already
de-internationalised exporters coming back to export markets.
In 2014 there were 13,429 companies exporting from the 28,336 exporters of 2009, but only 9,533 were exporting in each and every year of the given period, which means at least 3,896 companies (13,75% of 2009’s exporters) had a pause in export revenues in the six year period of analysis. In addition to that it can be seen in Table 4. that from 5 to 14 thousand companies had different pauses in export sales.
Bonaccorsi (1992) coined those companies stable exporters who were exporting for at least 4 years in the analysis period (which was 7 years by this argument).
It can be seen in table 4 that in the period of this analysis 73,442 companies were conducting export in Hungary. 40% of them 29,453 companies were adventurer exporters only exporting for one year (although because of the period of analysis, it cannot be seen from the database if a company ceased export in 2010, but was an exporter in 2008 or earlier neither the number of second time exporters in 2015 could be forecasted).
Table 4
Number of companies exporting by years of conducting export
Nr. of exporting years
1 2 3 4 5 6 1+
Nr. of exporters 29 453 14 061 8 778 6 244 5 373 9 533 73 442 Percentage 40.10% 19.15% 11.95% 8.50% 7.32% 12.98% 100.00%
Source: Author’s calculation
19.15% of companies were exporting for two years in the period of analysis, 11.95% for three years, 8.5% for four years, 7.32% for five years and 12.98% for six years.
With the most amicable definition (Bonaccorsi’s four year) stable exporters are only 28.8% of exporters, however I would rather stick to stricter definition of stable exporters and only use it for the 9,533 (12,98%) companies exporting in each and every year of the analysis.
Several authors like Bernard and Jensen (1999), Greenaway and Kneller (2007), Grazzi (2012) and Stocker (2014) made comparisons between exporting and non- exporting companies across different performance metrics.
From Table 3 and 4 however it can be claimed that exporting companies has to be segmented, as there are huge, different segments of the exporting companies.
Stable exporters could be much more different from adventurer exporters than the latter group from most of the non-exporters (not to mention that surely non-exporter groups can be also very different).
De-internationalisation is the reason behind the shrinking number of companies exporting in the long term.
Table 5 shows the number of companies de- internationalised in the given years of the period of analysis. It is very interesting that the number of de- internationalisation is increasing year by year, although the
number of foreign entry overcompensate the increasing number of de-internationalisation annually.
Table 5
Number of de-internationalised in the period of analysis
De-internationalisation Nr. of
companies % Year
5 911 8,0% 2009
6 329 8,6% 2010
7 660 10,4% 2011
7 949 10,8% 2012
10 498 14,3% 2013
38 347 52,2% 2009-2013 35 095 47,8% exports in 2014 Source: Author’s calculation
According to these data the first hypothesis is supported as de-internationalisation – even in its strictest
definition – is a mass phenomenon concerning more than 52% of the exporting companies in the period of analysis.
Hypothesis 2: After de-internationalisation most companies are terminated
As foreign market entry is usually connected with the positive notion of growth, foreign market exit is usually connected with the negative notion of decline or defensive strategy.
According to Turcan’s typology of de- internationalisation (which was shown in table 1) there are three valid segments of de-internationalisation, total withdrawal from international activities, and yet, in business, partial withdrawal from international activities and total withdrawal from international activities, and ceased trading at or right after (Turcan, 2011).
In table 6 the number of previously exporting companies terminated can be seen in the period of analysis.
16.8% of the exporting companies (namely 12,337 company) were terminated in the period of analysis (however it cannot be decided from the database which companies were terminated in 2014, therefore this number is supposed to be even higher). Number of termination is a significantly high number, however it can be seen that de- internationalisation is not strictly connected with the terminus of the company.
Table 6
Number of previously exporting companies terminated in the period of analysis
Termination of previously exporting companies Year Nr. of
companies %
2009 1 582 2,2%
2010 1 996 2,7%
2011 3 082 4,2%
2012 2 646 3,6%
2013 3 031 4,1%
2009-2013 12 337 16,8%
exists in 2014 61 105 83,2%
Source: Author’s calculation
In table 7 and table 8 the number (and percentage) of companies can be seen who were terminated in the period of analysis from the de-internationalised companies with focus on the year of de-internationalisation and terminus.
In 2009 5,911 companies de-internationalised, which is 15.4% of the total number of de-internationalised companies. 1,582 companies out of the 5,911 de- internationalised companies were terminated in 2009 whilst 585 companies terminated in 2010, 452 companies in 2011, 321 companies in 2012 and 250 companies in
2013. Altogether 3,190 companies, 54% of those de- internationalised in 2009 were terminated in the period of analysis and 2,721, 46% were still existing in 2014.
In 2010 6,329 companies de-internationalised, which is 16.5% of the total number of de-internationalised companies. 1,411 companies out of 6,329 went out of business in the year of their de-internationalisation, 687 companies in 2011, 419 in 2012 and 330 in 2013.
Altogether 2,847 companies, 45% of those de- internationalised in 2010 went out of business in the period of analysis, whilst 3,482 (55%) were still in operation in 2014.
Table 7
De-internationalisation in 2009 and 2010 and terminus of de-internationalised companies
Source: Author’s calculation
In 2011 7,660 companies de-internationalised, which is 20% of the total number of de-internationalised companies. 1,943 companies out of 7,660 went out of business in the year of their de-internationalisation, 606 in 2012 and 412 in 2013. Altogether 2,961 companies, 38.7%
of those de-internationalised in 2011 went out of business in the period of analysis, whilst 4,699 (61.3%) were still in operation in 2014.
In 2012 7,949 companies de-internationalised their activities, which is 20.7% of the total number of de- internationalised companies. 1,300 companies out of 7,949 went out of business in the year of their de- internationalisation and 627 in 2013. Altogether 1,927 companies, 24.2% of those de-internationalised in 2012 went out of business in the period of analysis, whilst 6,022 (75.8%) were still in operation in 2014.
Year Nr. of
companies % (of all
De-int) Nr. of
companies % Year
2009 5 911 15,4% 1 582 26,8% 2009
585 9,9% 2010
452 7,6% 2011
321 5,4% 2012
250 4,2% 2013
3 190 54,0% 2009-2013 2 721 46,0% still exists
5 911 100,0% SUM
Year Nr. of
companies % (of all
De-int) Nr. of
companies % Year
2010 6 329 16,5% 0 0,0% 2009
1 411 22,3% 2010
687 10,9% 2011
419 6,6% 2012
330 5,2% 2013
2 847 45,0% 2009-2013 3 482 55,0% still exists
6 329 100,0% SUM
Terminus from De-int 2009 De-internationalization
De-internationalization Terminus from De-int 2010
Table 8
De-internationalisation in 2011 to 2013 and terminus of de-internationalised companies
Source: Author’s calculation Interestingly in 2013 were the largest number of de- internationalised companies in the period of analysis with 10,498 companies, registering 27,4% of all de- internationalisation. 1,412 companies, 13.5% of them went
out of business in the year of their de-internationalisation and the remaining 86.5%, 9,086 were operating in 2014.
From these data the total de-internationalisation part of Turcan’s de-internationalisation typology can be calculated, as it can be seen in table 9.
Year Nr. of
companies % (of all
De-int) Nr. of
companies % Year
2011 7 660 20,0% 0 0,0% 2009
0 0,0% 2010
1 943 25,4% 2011
606 7,9% 2012
412 5,4% 2013
2 961 38,7% 2009-2013 4 699 61,3% still exists
7 660 100,0% SUM
Year Nr. of
companies % (of all
De-int) Nr. of
companies % Year
2012 7 949 20,7% 0 0,0% 2009
0 0,0% 2010
0 0,0% 2011
1 300 16,4% 2012
627 7,9% 2013
1 927 24,2% 2009-2013 6 022 75,8% still exists
7 949 100,0% SUM
Year Nr. of
companies % (of all
De-int) Nr. of
companies % Year
2013 10 498 27,4% 0 0,0% 2009
0 0,0% 2010
0 0,0% 2011
0 0,0% 2012
1 412 13,5% 2013
1 412 13,5% 2009-2013 9 086 86,5% still exists
10 498 100,0% SUM
De-internationalization Terminus from De-int 2013 De-internationalization Terminus from De-int 2011
De-internationalization Terminus from De-int 2012
Table 9
Total De-internationalisation of Hungarian companies in numbers
Source: Author’s calculation based on the typology of Turcan (2011) Table 9 is in harmony with table 7 and 8 as they show
that most of the de-internationalised companies are still in business.
Although with total de-internationalisation tens of thousands of companies were losing their export markets, the vast majority of them survived total de- internationalisation, therefore hypothesis 2 is rejected.
Hypothesis 3: De-internationalisation does not mean the end of overall international exposure.
As most of the companies are surviving the exit from their export market it is interesting to examine with which pattern do they export and de-internationalize. Exporting and de-internationalisation patterns of stable exporters can be seen in table 10 and table 11. The most stable exporters were exporting in each and every year, therefore there is no de-internationalisation pattern for them.
In table 10 the different patterns (and number of companies following these patterns) can be seen of companies who are exporting for 5 years out of the six
years of analysis period. Pattern one is obvious as these companies were entering foreign market in 2010 and are exporting from that date. This pattern is followed by 2,038 companies which is 38% of the whole group of companies exporting for 5 years in the period of analysis. Pattern six is also obvious, which shows that after five years of exporting these companies are de-internationalising with ceasing export sales, this pattern is followed by 1,235 companies (23% of the group). Pattern two, three, four and five are much more interesting as those companies following these patterns had one year pause in their export sales. These companies were ceasing their export sales only for one year but after that they were re-entering foreign market accordingly. Altogether 2,100 companies are following these patterns (39% of the group) which means these companies could become rich soil for de- internationalisation research, according to their situation, capabilities, business performance and re-entry to foreign market.
Table 10
Exporting and De-internationalising patterns of stable exporters (exporting in 5 years out of 6)
Source: Author’s calculation
In table 11 those patterns can be seen which are followed by the companies exporting in 4 years in the period of analysis. Pattern one is the most obvious, those companies are following this pattern who entered foreign market in 2011 and are stable exporters from that point.
The 2,071 companies are 33.2% of the whole group.
Pattern fifteen is the most obvious de-internationalisation pattern as these companies were ceasing their export operation in 2012 and were not re-entering foreign market the year after. 1,145 companies were following this pattern which is 18.3% of the whole group.
Total De-internationalization Year Nr. of
companies %
2009 3 744 63%
2010 4 231 67%
2011 5 111 67%
2012 6 022 76%
2013 9 086 87%
2009 2 167 37%
2010 2 098 33%
2011 2 549 33%
2012 1 927 24%
2013 1 412 13%
Still in Business I. Total Withdrawal from international activities
and, yet, in business
IV. Total withdrawal from international activities, and ceased trading at or right after Out of Business
Life continuum
2009 2010 2011 2012 2013 2014
1Not exporting Exporting Exporting Exporting Exporting Exporting 2038 2Exporting Not exporting Exporting Exporting Exporting Exporting 639 3Exporting Exporting Not exporting Exporting Exporting Exporting 477 4Exporting Exporting Exporting Not exporting Exporting Exporting 495 5Exporting Exporting Exporting Exporting Not exporting Exporting 489 6Exporting Exporting Exporting Exporting Exporting Not exporting 1235
Patterns
Exporting patterns (5 export years)
Exporting in year … Nr. of
Companies
Table 11
Exporting and De-internationalising patterns of stable exporters (exporting in 4 years out of 6)
Source: Author’s calculation
Pattern five is a sad pattern as these companies entered foreign market in 2010 but were ceasing exporting in 2013, hopefully most of them will be registering export sales later. This pattern is followed by 540 companies, which is 8.6% of the whole group.
The remaining 39.8% (2,488 companies) are much more interesting from de-internationalisation point of
view, as one or two years after their de-internationalisation they re-entered the foreign market. Together with the re- internationalising companies of the 5 year exporter group, there were 4,588 companies out of the “stable” exporters who were re-entering foreign market after de- internationalisation.
Table 12
Exporting and de-internationalising patterns of companies exporting in 3 years out of 6
Source: Author’s calculation
2009 2010 2011 2012 2013 2014
1Not exporting Not exporting Exporting Exporting Exporting Exporting 2071 2Not exporting Exporting Not exporting Exporting Exporting Exporting 349 3Not exporting Exporting Exporting Not exporting Exporting Exporting 254 4Not exporting Exporting Exporting Exporting Not exporting Exporting 243 5Not exporting Exporting Exporting Exporting Exporting Not exporting 540 6Exporting Not exporting Not exporting Exporting Exporting Exporting 259 7Exporting Not exporting Exporting Not exporting Exporting Exporting 121 8Exporting Not exporting Exporting Exporting Not exporting Exporting 117 9Exporting Not exporting Exporting Exporting Exporting Not exporting 170 10Exporting Exporting Not exporting Not exporting Exporting Exporting 185 11Exporting Exporting Not exporting Exporting Not exporting Exporting 116 12Exporting Exporting Not exporting Exporting Exporting Not exporting 180 13Exporting Exporting Exporting Not exporting Not exporting Exporting 244 14Exporting Exporting Exporting Not exporting Exporting Not exporting 250 15Exporting Exporting Exporting Exporting Not exporting Not exporting 1145
Patterns
Exporting in year … Nr. of
Companies Exporting patterns
(4 export years)
2009 2010 2011 2012 2013 2014
1Not exporting Not exporting Not exporting Exporting Exporting Exporting 2638 2Not exporting Not exporting Exporting Not exporting Exporting Exporting 449 3Not exporting Not exporting Exporting Exporting Not exporting Exporting 328 4Not exporting Not exporting Exporting Exporting Exporting Not exporting 744 5Not exporting Exporting Not exporting Not exporting Exporting Exporting 206 6Not exporting Exporting Exporting Not exporting Not exporting Exporting 178 7Not exporting Exporting Exporting Exporting Not exporting Not exporting 627 8Not exporting Exporting Not exporting Exporting Not exporting Exporting 107 9Exporting Not exporting Not exporting Not exporting Exporting Exporting 190 10Exporting Not exporting Exporting Exporting Not exporting Not exporting 218 11Not exporting Exporting Exporting Not exporting Exporting Not exporting 180 12Exporting Not exporting Not exporting Exporting Not exporting Exporting 84 13Exporting Not exporting Not exporting Exporting Exporting Not exporting 137 14Exporting Not exporting Exporting Not exporting Exporting Not exporting 78 15Exporting Not exporting Exporting Not exporting Not exporting Exporting 83 16Exporting Exporting Not exporting Not exporting Not exporting Exporting 176 17Exporting Exporting Not exporting Exporting Not exporting Not exporting 268 18Exporting Exporting Not exporting Not exporting Exporting Not exporting 154 19Not exporting Exporting Not exporting Exporting Exporting Not exporting 165 20Exporting Exporting Exporting Not exporting Not exporting Not exporting 1768 Exporting patterns
(3 export years) Exporting in year … Nr. of
Companies
Patterns
In table 12 the exporting and de-internationalisation patterns of those companies can be seen which are exporting in 3 years in the period of analysis. Pattern one, four, seven and twenty are obvious patterns again, pattern one shows new exporters which is followed by 2,638 companies (30% of the group). Pattern twenty shows those companies exporting in the early period but completely de- internationalising in 2011, this pattern is followed by 1,768 companies (20% of the group). Pattern four (744 companies, 8,5%) and seven (627 companies, 7,1%) is about companies entering foreign market in the period of analysis but de-internationalising in 2013 and 2012
respectively. All other patterns which is followed by a combined of 3,001 companies (34,2% of the group) are very interesting as they shows patterns of companies entering end exiting foreign markets in any conceivable way. Pattern eight and fourteen seem to be the most interesting patterns as companies following these patterns were opportunistic exporters, exporting and de- internationalising in even and odd years (vice versa for pattern fourteen).
In table 13 the patterns of those companies can be seen which were exporting only for two years in the period of analysis.
Table 13
Exporting and de-internationalising patterns of companies exporting in 2 years out of 6
Source: Author’s calculation
Pattern one and fifteen are the most obvious patterns in this group. Pattern one is followed by 2,448 (17,4%) companies showing those which were completely de- internationalising in 2010. Pattern fifteen is followed by 3,944 (28,1%) companies which were entering foreign market in 2013. All other patterns are showing different
types of foreign market entry and exit and are followed by a combined of 7,669 companies which is 54,5% of this group. Pattern five can be the most interesting here, the 221 company in this group were exporting in 2009 then had four year brake in exporting and re-entered export market in 2014.
Table 14
Exporting and De-internationalising patterns of companies exporting in a single year in the period of analysis
Source: Author’s calculation
In table 14 the exporting and de-internationalisation patterns of those companies can be seen which were only exporting in one year in the period of analysis. Altogether
29,453 companies were exporting for only one year which is 40% of the 73,442 companies conducting export in the period of analysis. It can be supposed however that some
2009 2010 2011 2012 2013 2014
1Exporting Exporting Not exporting Not exporting Not exporting Not exporting 2448 2Exporting Not exporting Exporting Not exporting Not exporting Not exporting 544 3Exporting Not exporting Not exporting Exporting Not exporting Not exporting 235 4Exporting Not exporting Not exporting Not exporting Exporting Not exporting 166 5Exporting Not exporting Not exporting Not exporting Not exporting Exporting 221 6Not exporting Exporting Exporting Not exporting Not exporting Not exporting 1407 7Not exporting Exporting Not exporting Exporting Not exporting Not exporting 319 8Not exporting Exporting Not exporting Not exporting Exporting Not exporting 238 9Not exporting Exporting Not exporting Not exporting Not exporting Exporting 222 10Not exporting Not exporting Exporting Exporting Not exporting Not exporting 1291 11Not exporting Not exporting Exporting Not exporting Exporting Not exporting 387 12Not exporting Not exporting Exporting Not exporting Not exporting Exporting 385 13Not exporting Not exporting Not exporting Exporting Exporting Not exporting 1516 14Not exporting Not exporting Not exporting Exporting Not exporting Exporting 738 15Not exporting Not exporting Not exporting Not exporting Exporting Exporting 3944 Exporting patterns
(2 export years)
Exporting in year … Nr. of
Companies
Patterns
2009 2010 2011 2012 2013 2014
1Exporting Not exporting Not exporting Not exporting Not exporting Not exporting 5911 2Not exporting Exporting Not exporting Not exporting Not exporting Not exporting 3881 3Not exporting Not exporting Exporting Not exporting Not exporting Not exporting 3941 4Not exporting Not exporting Not exporting Exporting Not exporting Not exporting 3846 5Not exporting Not exporting Not exporting Not exporting Exporting Not exporting 4358 6Not exporting Not exporting Not exporting Not exporting Not exporting Exporting 7516
Patterns
Exporting patterns (1 export years)
Exporting in year … Nr. of
Companies
of the 5,911 companies who were last registering export sales in 2009 were exporting in 2008 or before and it can be hoped as well that the majority of the 7,516 companies who were entering foreign market in 2014 will export in 2015 and further, as well.
According to the Hungarian exporting and de- internationalising companies hypothesis 3 is supported, as de-internationalisation not only does not mean the end of international exposure, but by thousands of companies it is followed by re-entry to foreign market.
C ONCLUSION
Based on the 73,442 Hungarian companies which were registering export revenues in at least one year from 2009 to 2014, it can be observed that de-internationalisation – even in its strictest definition – is a mass phenomenon concerning more than 52% of the exporting companies in the period of analysis.
Although de-internationalisation is often connected with the negative notion of decline or even termination of business, the vast majority of the tens of thousands of companies getting through total de-internationalisation
with the loss of their export markets survived total de- internationalisation.
Thousands of companies not only survived de- internationalisation, but were re-entering foreign markets with more or less success.
Based on the several different exporting and de- internationalisation patterns and the significant number of companies following these patterns, it is important to use a better segmentation in the literature than the popular exporter vs. non-exporter distinction, since stable exporters, opportunistic exporters and adventurer exporters are very different groups of the exporting companies.
From the de-internationalisation patterns, policy makers should derive the conclusion that it is not enough to support entry to foreign markets, but those capability building processes has to be supported, which will enable the companies to compete in the international market for the long run, and if for some external reasons they have to abandon some of their markets they can utilize these capabilities and even the earned experience to enter different markets or even re-enter the given market with stronger proposals.
REFERENCES
BENITO G R G, WELCH L S (2007) De-Internationalisation. In: Management International Review, Special Issue 1997/2 pp. 7-25.
BERNARD, A.B., JENSEN, J.B. (1999): Exceptional exporter performance: cause, effect, or both?. Journal of International Economics 47, 1999, 1-25 https://doi.org/10.1016/S0022-1996(98)00027-0
BERNARD A B, JENSEN J B, REDDING S J, SCHOTT P K (2007) Firms in international trade. National Bureu of Economic Research, Working Paper 13054, April 2007
BONACCORSI A (1992) On the Relationship between Firm Size and Export Intensity. Journal of International Business Studies. Vol. 23, No. 4 (4th Qtr., 1992) pp. 605-635 DOI: 10.1057/palgrave.jibs.8490280
GRAZZI M, (2012) Export and Firm Performance: Evidence on Productivity and Profitability of Italian Companies. In:
Journal of Industry, Competition and Trade, 12, pp. 413–444 DOI: 10.1007/s10842-011-0102-9
GREENAWAY D, KNELLER R (2007) Firm Heterogeneity, Exporting and Foreign Direct Investment. In: The Economic Journal, Vol. 117, No. 517, Features (Feb., 2007), pp. F134-F161 DOI: 10.1111/j.1468-0297.2007.02018.x STOCKER M (2014) Business Performance of Hungarian Exporting Companies. In: Competitiveness of the CEE Region
in the Global Economy. First AIB-CEE Chapter Conference. Budapest. 2014.10.10
TURCAN R V (2011) De-internationalisation: A conceptualisation. Paper presented at AIB-UK & Ireland Chapter Conference on 'International Business: New challenges, new forms, new practices', Edinburgh, United Kingdom.