C ORVINUS U NIVERSITY OF B UDAPEST Dávid Zoltán Szabó
The impact of social pressure of differing audience size on referees and team
performances from a
NorthAmerican perspective
http://unipub.lib.uni-corvinus.hu/6749
C O R V I N U S
E CONOMICS W O R K I N G
P A P E R S
04/2021
The impact of social pressure of differing audience size on referees and team performances from a North
American perspective
Dávid Zoltán Szabó
∗August 26, 2021
Abstract
The COVID-19 pandemic provides a natural experiment to comprehensively test the effect of crowds on both referees and players. Our aim is to examine this from a North-American perspective using data from three major leagues: National Bas- ketball Association (NBA)1, National Football League (NFL)2 and National Hockey League (NHL)3. In all three leagues in the 2020-2021 season, matches were played either under empty or partially loaded stadiums. We find that the audience size for NBA substantially affects referee decisions by increasingly favouring the home team as crowd size grows. No such effect is observed for NHL or NFL. Nonetheless, with increasing crowd size not only for NBA but also for NHL the home team’s perfor- mance gets significantly better. Regarding NFL, we have not found evidence that crowd size influences either referee decisions or home team’s performance. We verify that these findings also hold for the pre-COVID-19 pandemic period, when games were normally organized and crowd size only innately varied without any imposed restrictions. These results suggest that the effect of social pressure on the agents’
behaviour is activity specific, no general rules apply. Besides, we claim that out of these three leagues NBA is the most biased in terms of referee decisions.
Keywords: Home Advantage, Social pressure, North American sport leagues, Attendance, Referee bias
JEL Classification code: Z20
1 Introduction
Individual’s decision making is affected by social forces according to economists and social sci- entists (e.g. Akerlof and Kranton (2000), Becker and Murphy (2009), and Bernheim (1994)). As social groups often penalize individuals who do not follow social norms, decision making can be biased by a crowd. Therefore most people follow conformist behaviour to obtain necessary social acceptance.
∗Corvinus University of Budapest, Hungary, 1093, Budapest Fővám Square 8., Department of Finance.
E-mail: davidzoltan.szabo@uni-corvinus.hu.
1NBA: National Basketball Association
2NFL: National Football League
3NHL: National Hockey League
In particular for professional soccer, Garicano, Palacios-Huerta, and Prendergast (2005) and further studies have shown that referees systematically favour the home team by making biased decisions due to the presence of a supporting crowd. This can be explained by the phenomenon that referees are subconsciously affected by the cheering crowd, and so they conduct themselves to satisfy the supporters of the home team. These studies argue that referee bias for soccer is observable in terms of stoppage time, awarded penalties and yellow or red cards. Boyko, Boyko, and Boyko (2007) in particular showed that for English Premiership football even crowd size affects referee decisions by awarding a significantly lower amount of yellow cards to the home team under larger crowds. Regarding other popular sports in North America, Price and Wolfers (2010) argued the existence of referee bias based on racial discrimination for NBA and Levitt et al. (2002) argued that adding a second referee for NHL games has a little impact on the probability of detecting offenses. A pre-COVID-19 study Pettersson-Lidbom and Priks (2010) also considered one-off games when soccer matches were played behind closed doors, claiming that referees make a lot fairer decisions under this special circumstance. Due to the small sample size (21 games), it is unclear whether the driver behind the findings is the unfamiliarity with the events or the removed social pressure.
After the emergence of COVID-19 pandemic a large number of papers exploited the natu- ral experiment coming from the COVID-19 regulations that limited or banned fans to attend matches and extensively examined referee bias for soccer games. These papers were aimed to investigate the effects of crowd support on the performance of the home and visiting team and on the decision making of the referees. Doing so, they could also contribute to the large liter- ature of home advantage. Home advantage refers to the widely accepted phenomenon that in sport leagues teams substantially perform better when playing at home court compared to when being the visiting team. The possible reasons responsible for home advantage have been argued however Pollard (2008). Three potential reasons have been proposed: crowd support, familiarity and travel fatigue. Before the emergence of COVID-19 pandemic, researchers have not had the opportunity to examine the underlying reasons thoroughly due to the relative absence of con- trolled environments when attendance of sport events is restricted. The appearance of COVID-19 pandemic therefore also yields the unique opportunity to better understand the mechanism be- hind home advantage by investigating the extent of social pressure on referees and players on a large scale. Considering soccer matches for different European leagues the causal effect of absent crowds on referee bias and home court advantage has been investigated in Cueva (2020), Bryson, Dolton, Reade, Schreyer, and Singleton (2021), Scoppa (2021) and Reade, Schreyer, and Singleton (2020), among other studies. These papers provide overwhelming empirical evidence that home advantage behind closed doors significantly drops, besides referee decisions are a lot more balanced without a crowd, significantly fewer cards are awarded to the away team behind empty stadiums. These results suggest the notion that for European football games, the home court advantage to some extent is caused by the more favourable referee decisions.
To our understanding this present paper is the first one to comprehensively examine the relation of home advantage and size attendance considering three North American (NFL, NBA, NHL) sport leagues also including referee calls. In comparison to soccer, the literature of other sports on this research topic is relatively brief. McHill and Chinoy (2020) studied post-COVID- 19 NBA games from the travel impact on teams’ performances. They claimed that without having to travel for the visiting team, the home team’s winning percentage is significantly lower compared to normal matches. It should be acknowledged though, that this paper does not deal with any heterogeneities among the matches. A research focusing on NFL, NBA, NHL and Major League Baseball in Higgs and Stavness (2021) used a Bayesian type Negative binomial regression model to estimate game results by taking into account relative team strength. They asserted that for NBA and NHL games the home advantage was significantly hindered during the playoffs of the COVID-19 afflicted seasons, whereas for NFL there was no significant difference on the home advantage for the COVID-19 afflicted seasons compared to normal seasons. None of the
2
previous two papers considered referee calls.
Our primary goal is to contribute to the literature to better understand the balancing mech- anism behind home advantage for basketball, American football and ice hockey. Looking at referee calls and match outcomes we aim to decide whether the mechanism of crowd’s impact is through the players or officials by analysing the corresponding NFL, NBA and NHL games since Season 2011-2012. We perform this research by building a panel regression model and controlling for within and season to season variation. We also consider match-up and venue specific fixed effects. Complementing the literature for European football, we will find that for basketball games audience size significantly influences decision making and game outcomes, for ice hockey referee decision is not noticeably affected by crowd size, still home team’s performance is signif- icantly better in front of a larger crowd, whereas for American football none of these effects are empirically observed.
The rest of the paper is organised as follows. In Section 2 we discuss the data for the three sport leagues and present descriptive statistics. In Section 3 we detail our methods and show the corresponding results. In Section 4 we conclude. The appendix contains some complementary results that strengthen the robustness of the findings.
2 Data
For this work we considered three major North American professional sport leagues, namely the NBA, NFL and NHL. For all three leagues we initially included all observations from the beginning of Season 2011-2012 until the end of Season 2020-2021. This contains 12581 NBA games, 2672 NFL games and 12279 NHL games. We treated the analysis separately for the three different sports. To perform our study we focused on match outcomes along with the points scored by the two teams and match attendance. Furthermore we also examined referee calls in terms of penalties sanctioned to home and away team.
The NBA match outcomes along with size of audience is sourced from www.basketball-reference.
com, while NBA penalty data for both teams for all games is sourced from www.nba.com/
stats/teams/boxscores. The NFL match outcomes along with size of audience is sourced from www.pro-football-reference.com, while NFL penalty data for both teams for all games is sourced from www.nflpenalties.com. The NHL match outcomes along with size of audience and penalty data is sourced from www.hockey-reference.com. As indicated, we used two sources for NBA and NFL leagues to gather all necessary data. Once all data extracted, we merged the two sources to obtain a unique data frame that contains all variables for each game. Regard- ing NHL we extracted data from multiple tables from the same website, thus we again had to merge different sources. All data manipulation and the subsequent work was performed using software R. The obtained dataset for each of the three leagues is available online at https://github.com/davidzoltanszabo/NorthAmericanHomeAdvantage
Referee calls are sport specific, regarding NBA we treat variable penalty as the sum of personal fouls of all players of a team during the match, regarding NFL we treat variable penalty as the sum of different penalties that a team committed during the match, regarding NHL we treat variable penalty as the total assessed length of penalties each player of a team has accrued during the game.
We considered some additional features based on which we can further categorize matches.
Our dataset does not only contain the number of spectators that attended each single match, it also features whether or not the game was played in the regular or playoff part of the season, the exact date of the game and the location of the game.
Out of these three leagues, only NFL games can end up in a draw as all NHL and NBA games are decided in overtime in case after the regular time the two teams are on level. Over the considered 10 NFL seasons only nine games were tied and we excluded these games from the study. Also as this work focuses on the relation between home court advantage and match
attendance, we disregard games that were played at neutral venues. Regularly, 4-5 games in each season and in each of the three leagues were played overseas before the emergence of COVID- 19 pandemic without having a proper home and away team. After the COVID-19 outbreak in March 2020, the remainder of NBA and NHL games for Season 2019-2020 were postponed.
The resumption of the 2019-2020 NBA season followed after a 5 month hiatus in a bubble at a neutral site called Walt Disney World in Bay Lake with no attendance. Likewise, the resumption of the 2019-2020 NHL season after a 5 month hiatus happened with a modified format to stage a 24-team playoff tournament behind closed doors and these games took place at Scotiabank Arena, the home venue of Toronto Maple Leafs or at Rogers Place, the home venue of Edmonton Oilers. We further cleaned the dataset by excluding most of the post-resumption games for Season 2019-2020 due to the lack of home and away team; only leaving in 9 NHL games when one of the teams was either Toronto Maple Leafs or Edmonton Oilers, meaning that they played at their regular home venue. We note that all postponed games for Season 2019-2020 for NHL and NBA were played behind closed doors. Contrary to NBA and NHL, the 2019-2020 NFL Season could finish uninterrupted due to its timings before the COVID-19 outbreak.
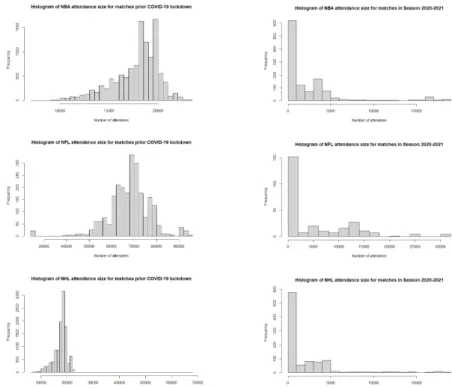
The 2020-2021 season in all three leagues started behind closed doors and depending on the league and on the state policies of the home team, some of the games were held under partially loaded stadiums as the season progressed. Moreover some games near the end of the 2020-2021 season witnessed its previous regular attendance base. In Figure 1 we can see the histogram of attendance size for the three different leagues. On the left this is displayed for the pre-COVID- 19 pandemic period, whereas on the right we can see this for Season 2020-2021. Likewise in Figure 2 we can see the histogram of score difference between home team and away team for the three different leagues using the same time partition. We calculated for each game the difference between scored points of the home team and scored points of the away team to acquire this score difference variable. Pre COVID-19 period consists of the games from Season 2011-2012 until the emergence of COVID-19 pandemic, after which the rest of the games for Season 2019-2020 were postponed for NHL and NBA. As we can see on the left, there was some natural variation in size attendance even before the emergence of COVID-19 pandemic for all three leagues. Regarding NHL, the league regularly scheduled at least one outdoor game per year with a significantly greater than usual crowd size, thus we can see a skewed histogram. In Season 2020-2021, 580 out of 1171 NBA games were played behind closed doors, 148 out of 266 NFL games were played behind closed doors and 573 out of NHL 950 games were played behind closed doors.
4
Figure 1: Attendance histograms for the different leagues.
Figure 2: Score histograms for the different leagues.
2.1 Descriptive statistics
Having excluded games without a home venue and 9 tied NFL games, we finally consider 12390 NBA games, 2624 NFL games and 12126 NHL games. We first make a distinction between games played in front of spectators and behind closed doors and examine the possible difference between these two groups. That said, the first group contains all games where any number of audience were present during the game, whereas the second group contains games with strictly 0 attendance.
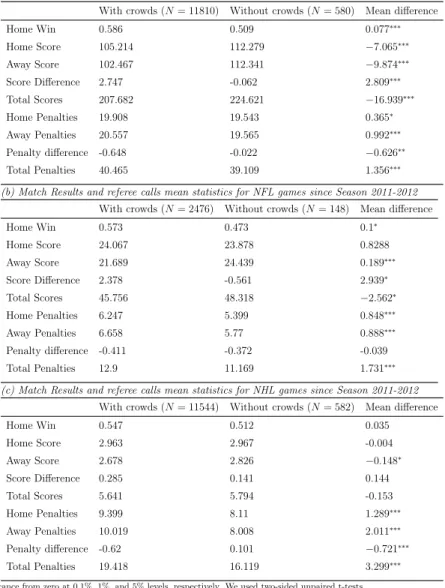
In Table 1 we can see the mean values for different game characteristics for games played with and without audience along with the sample size for the two groups. 4 These characteristics are:
share of wins of home teams among all games, points scored by home team, points scored by away team, difference of points scored by home team and away team, sum of points scored by home team and away team, penalties awarded to home team, penalties awarded to away team, difference of penalties awarded to home team and away team, sum of penalties awarded to home team and away team. As for the last column of Table 1 we invoke a two-sided unpairedt-test to test if the means of two samples are significantly different from each other. The results reveals that for all nine characteristics there is a difference between games played with and without a crowd for NBA games at 5% significance level, and for most characteristics the difference is significant even at 0.1% significance level. As expected, home team’s winning share is significantly greater with a crowd and away score increases without an audience. Surprisingly, home score is also higher without a crowd. Also surprisingly, the number of home penalties are significantly lower without a crowd and as expected away penalties are lower without a crowd. Regarding NFL games, there is a significant decline in both home and away penalties and a significant increase in away scores at 0.1% significance level without crowds, also the home team’s winning ratio is significantly smaller at 5% significance level without a crowd. The significantly lower number of home penalties without an audience are again surprising, other results are in accordance with the expectations. Regarding NHL games, the difference is more significant for penalty decisions, regarding match outcomes there is only a significant increase at 5% significance level for visiting team’s scores behind closed doors from the considered characteristics. As expected, without a crowd a lower number of penalties were issued to the away team, but again surprisingly a lower number of penalties were sanctioned to the home team as well.
Note that this previous comparison does not deal with the possible heterogeneity among the observations, instead it treats all matches of the same kind. The surprising results might be caused by season to season variation in the sport leagues. Besides, the specific timing and match-up of the games without a crowd can be very different than that of the games played in front of spectators, as all games without crowds were played after the emergence of COVID-19 pandemic and are not randomly scattered within the 10 considered seasons. This suggests the idea to control for some characteristic variables to better understand the mechanism behind referee bias and home advantage. Therefore we move on to the next section, where we consider the longitudinal observations as panel data and some model parameters will be fixed for the regressions.
4As mentioned some (9) games after the resumption of 2019-2020 NHL Season were played with the existence of a home team. This accounts for the difference between 573 games considered earlier in Figure 1 and the sample size of 582 games in Table 1.
6
Table 1: Sample means for different NBA match outcomes and referee calls. The first column contains these means where any positive number of fans were present during the match, the second column contains these means where strictly no fans were present during the match. The last column shows the mean differences between the two sample groups along with its significance level marked with an asterisk.
(a) Match Results and referee calls mean statistics for NBA games since Season 2011-2012 With crowds (N= 11810) Without crowds (N= 580) Mean difference
Home Win 0.586 0.509 0.077∗∗∗
Home Score 105.214 112.279 −7.065∗∗∗
Away Score 102.467 112.341 −9.874∗∗∗
Score Difference 2.747 -0.062 2.809∗∗∗
Total Scores 207.682 224.621 −16.939∗∗∗
Home Penalties 19.908 19.543 0.365∗
Away Penalties 20.557 19.565 0.992∗∗∗
Penalty difference -0.648 -0.022 −0.626∗∗
Total Penalties 40.465 39.109 1.356∗∗∗
(b) Match Results and referee calls mean statistics for NFL games since Season 2011-2012 With crowds (N= 2476) Without crowds (N= 148) Mean difference
Home Win 0.573 0.473 0.1∗
Home Score 24.067 23.878 0.8288
Away Score 21.689 24.439 0.189∗∗∗
Score Difference 2.378 -0.561 2.939∗
Total Scores 45.756 48.318 −2.562∗
Home Penalties 6.247 5.399 0.848∗∗∗
Away Penalties 6.658 5.77 0.888∗∗∗
Penalty difference -0.411 -0.372 -0.039
Total Penalties 12.9 11.169 1.731∗∗∗
(c) Match Results and referee calls mean statistics for NHL games since Season 2011-2012 With crowds (N= 11544) Without crowds (N= 582) Mean difference
Home Win 0.547 0.512 0.035
Home Score 2.963 2.967 -0.004
Away Score 2.678 2.826 −0.148∗
Score Difference 0.285 0.141 0.144
Total Scores 5.641 5.794 -0.153
Home Penalties 9.399 8.11 1.289∗∗∗
Away Penalties 10.019 8.008 2.011∗∗∗
Penalty difference -0.62 0.101 −0.721∗∗∗
Total Penalties 19.418 16.119 3.299∗∗∗
Notes:∗∗∗,∗∗;∗indicate significance from zero at 0.1%, 1%, and 5% levels, respectively. We used two-sided unpaired t-tests.
3 Estimation and results
As discussed, the descriptive statistics do not take into account season-to-season variation and possible within season variation. Also the change in the scheduling of the leagues before and after the lockdown is not captured by the mean differences in Table 1. Besides, we also want to understand if the significant difference in most of the characteristics is simply the consequence of playing behind closed doors instead of open doors or alternatively it can be explained by the general variation in the audience size. In order to resolve these issues, we build a framework following the ones that have been widely used in sports economics for European football (e.g.
Bryson, Dolton, Reade, Schreyer, and Singleton (2021), Cueva (2020) and Scoppa (2021)). That said, we move forward by building a panel regression separately for each of the three leagues.
We estimate the following using ordinary least squares (OLS):
yi,j,k,l,o,m=β1CDi,j,k,l,o,m+β2AT Ti,j,k,l,o,m+hi+aj+dk+rpl+so+εi,j,k,l,o,m (1)
where y denotes the outcome variable, that is taken from one of the nine characteristics we have inspected in Table 1. CD is a dummy variable taking value 1 if the match was played behind closed doors, 0 otherwise. ATT is a variable that measures the number of attendees rounded up to the nearest integer in thousands for NBA and NHL matches and up to the nearest integer in tens of thousands for NFL matches. The rest of the variables are fixed effects, h is home team fixed effect, a is away team fixed effect, dis day of the week fixed effect, rp is a dummy fixed effect that captures whether the match was game in the regular or playoff part of the season, whereas sis the season fixed effect.
By controlling for these fixed effects we can indeed seize possible individual heterogenities.
As the teams that play in these leagues do not vary from season to season we can address some individual traits by fixing the home team and away team in the panel regression. The day of the week fixed effect is aimed to address possible differences in game characteristics played on different days. As pointed out in Goller and Krumer (2020), games played on non-frequent days can be substantially different compared to games played on frequent days for European football.
We also consider the regular/playoff fixed effect, that can address some within season variation by separating games played during the regular season or during the playoff season. Last, but not least the season fixed effect is aimed to take into account possible variation between different seasons.
We incorporate two regressors to the model to consider not only the effect of the complete lockdown when no fans are allowed to the stadium but to also see the impact of different size of audience. Figure 1 reveals that during Season 2020 the attendance varied from 0 to almost fully loaded stadiums taking relatively dispersed values for all three leagues, also in each normal season there is some natural variation in the size of audience. With the first regressor we emphasize the importance of closed doors versus non-closed doors, whereas with the second one we reveal the extent with which the variation of attendance influences the game outcomes and referee decisions.
NFL league is an outdoor sport event and so are attended with significantly more fans, thus we round the attendance up to the nearest 10000. For NBA and NHL games, attendance is rounded up to the nearest 1000.
8
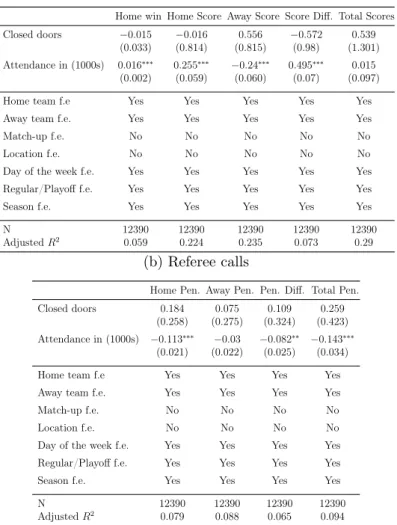
Table 2: Estimated effects of playing NBA games behind closed doors and various audience sizes on match results and referee decisions considering all games since Season 2011-2012 with a home court
(a) Match outcome
Home win Home Score Away Score Score Diff. Total Scores
Closed doors −0.015 −0.016 0.556 −0.572 0.539
(0.033) (0.814) (0.815) (0.98) (1.301) Attendance in (1000s) 0.016∗∗∗ 0.255∗∗∗ −0.24∗∗∗ 0.495∗∗∗ 0.015
(0.002) (0.059) (0.060) (0.07) (0.097)
Home team f.e Yes Yes Yes Yes Yes
Away team f.e. Yes Yes Yes Yes Yes
Match-up f.e. No No No No No
Location f.e. No No No No No
Day of the week f.e. Yes Yes Yes Yes Yes
Regular/Playoff f.e. Yes Yes Yes Yes Yes
Season f.e. Yes Yes Yes Yes Yes
N 12390 12390 12390 12390 12390
AdjustedR2 0.059 0.224 0.235 0.073 0.29
(b) Referee calls
Home Pen. Away Pen. Pen. Diff. Total Pen.
Closed doors 0.184 0.075 0.109 0.259
(0.258) (0.275) (0.324) (0.423) Attendance in (1000s) −0.113∗∗∗ −0.03 −0.082∗∗ −0.143∗∗∗
(0.021) (0.022) (0.025) (0.034)
Home team f.e Yes Yes Yes Yes
Away team f.e. Yes Yes Yes Yes
Match-up f.e. No No No No
Location f.e. No No No No
Day of the week f.e. Yes Yes Yes Yes
Regular/Playoff f.e. Yes Yes Yes Yes
Season f.e. Yes Yes Yes Yes
N 12390 12390 12390 12390
AdjustedR2 0.079 0.088 0.065 0.094
Notes:∗∗∗,∗∗;∗indicate significance from zero at 0.1%, 1%, and 5% levels, respectively, two-sided tests. Standard errors (reported in parentheses) are corrected for heteroskedasticity.
Table 3: Estimated effects of playing NFL games behind closed doors and various audience sizes on match results and referee decisions considering all no-draw games since Season 2011-2012 with a home court
(a) Match outcome
Home win Home Score Away Score Score Diff. Total Scores
Closed doors −0.107 −2.608 0.932 −3.54 -1.676
(0.07) (1.371) (1.48) (2) (2.036)
Attendance in (10000s) −0.005 0.452 0.361 0.091 0.812 (0.021) (0.421) (0.426) (0.614) (0.584)
Home team f.e Yes Yes Yes Yes Yes
Away team f.e. Yes Yes Yes Yes Yes
Match-up f.e. No No No No No
Location f.e. No No No No No
Day of the week f.e. Yes Yes Yes Yes Yes
Regular/Playoff f.e. Yes Yes Yes Yes Yes
Season f.e. Yes Yes Yes Yes Yes
N 2624 2624 2624 2624 2624
AdjustedR2 0.066 0.085 0.074 0.099 0.059
(b) Referee calls
Home Pen. Away Pen. Pen. Diff. Total Pen.
Closed doors 0.123 0.238 −0.115 0.361
(0.332) (0.374) (0.476) (0.524) Attendance in (10000s) 0.071 −0.018 0.089 0.053
(0.11) (0.115) (0.152) (0.167)
Home team f.e Yes Yes Yes Yes
Away team f.e. Yes Yes Yes Yes
Match-up f.e. No No No No
Location f.e. No No No No
Day of the week f.e. Yes Yes Yes Yes
Regular/Playoff f.e. Yes Yes Yes Yes
Season f.e. Yes Yes Yes Yes
N 2624 2624 2624 2624
AdjustedR2 0.046 0.076 0.045 0.074
Notes:∗∗∗,∗∗;∗indicate significance from zero at 0.1%, 1%, and 5% levels, respectively, two-sided tests. Standard errors (reported in parentheses) are corrected for heteroskedasticity.
10
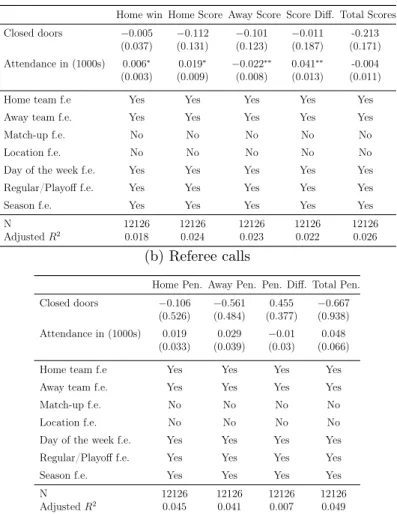
Table 4: Estimated effects of playing NHL games behind closed doors and various audience sizes on match results and referee decisions considering all games since Season 2011-2012 with a home court
(a) Match outcome
Home win Home Score Away Score Score Diff. Total Scores
Closed doors −0.005 −0.112 −0.101 −0.011 -0.213
(0.037) (0.131) (0.123) (0.187) (0.171) Attendance in (1000s) 0.006∗ 0.019∗ −0.022∗∗ 0.041∗∗ -0.004 (0.003) (0.009) (0.008) (0.013) (0.011)
Home team f.e Yes Yes Yes Yes Yes
Away team f.e. Yes Yes Yes Yes Yes
Match-up f.e. No No No No No
Location f.e. No No No No No
Day of the week f.e. Yes Yes Yes Yes Yes
Regular/Playoff f.e. Yes Yes Yes Yes Yes
Season f.e. Yes Yes Yes Yes Yes
N 12126 12126 12126 12126 12126
AdjustedR2 0.018 0.024 0.023 0.022 0.026
(b) Referee calls
Home Pen. Away Pen. Pen. Diff. Total Pen.
Closed doors −0.106 −0.561 0.455 −0.667
(0.526) (0.484) (0.377) (0.938) Attendance in (1000s) 0.019 0.029 −0.01 0.048
(0.033) (0.039) (0.03) (0.066)
Home team f.e Yes Yes Yes Yes
Away team f.e. Yes Yes Yes Yes
Match-up f.e. No No No No
Location f.e. No No No No
Day of the week f.e. Yes Yes Yes Yes
Regular/Playoff f.e. Yes Yes Yes Yes
Season f.e. Yes Yes Yes Yes
N 12126 12126 12126 12126
AdjustedR2 0.045 0.041 0.007 0.049
Notes:∗∗∗,∗∗;∗indicate significance from zero at 0.1%, 1%, and 5% levels, respectively, two-sided tests. Standard errors (reported in parentheses) are corrected for heteroskedasticity.
Table 2 displays the results of the nine regressions for NBA. We can see that the ATT regressor variable has a significant effect on the Home Win, Home score, Away score and Score difference outcome variables. On the other hand, the CD dummy regressor variable does not significantly influence match outcomes using this model where both regressors are included into the model. This indicates that as for NBA games the size of crowd plays a significant role in match outcomes and its effect is stronger than the effect of playing behind closed doors versus without closed doors. Estimated coefficients can be interpreted as changes in the probability of home team’s winning for the regression with Home Win outcome variable, whereas for the regressions with score outcome variables the estimated coefficients can be interpreted as changes in the expected score of the teams. The coefficients are in accordance with the expectations. The likelihood of home team’s winning increases with the size of audience, alongside with the expected points scored by the home team. Away team’s score decreases with the size of audience, and as a consequence the score difference between home and away team grows along with audience size.
All these effects are significant at 0.1% or lower. We do not see a significant change in the sum of the individual scores with different audience sizes. Regarding referee calls, the CD dummy regressor variable again does not significantly affect any outcomes. On the other hand, the ATT regressor variable has a significant effect on the number of home penalties, penalty difference and total penalties variables. The expected number of home penalties significantly (p < 0.1%) decrease with the audience size, whereas the number of penalties awarded to the away team are not influenced by the number of spectators. As a consequence the expected sum of home
and away penalties also significantly increase with audience size (p <0.1%). These results help us understand the balancing mechanism behind home advantage for NBA. The crowd puts a pressure on the referees and they are more lenient towards the home team to punish them with possible penalties. This pressure increases with the size of the audience. Nonetheless, the pressure of the crowd does not result in a significantly different number of referee calls awarded to the visiting team. This suggests that the referees fairly assess the potential fouls of the visiting team regardless of the size of the crowd, but are wary when they have to make decisions to punish the home team with penalties in front of a larger audience. Although we study the effect of audience size on match outcomes and referee decisions separately, this empirical study suggests that home team performs better in front of a greater number of spectators at least partially due to having to play with the help of a favourable referee bias.
Regarding NFL games we obtain entirely different results. Even though, as we can see in Table 1 this is the only league where the home team’s winning share behind closed doors fell below 50%, we do not see any significant regressor variables in Table 3 no matter what the outcome variable is. This indicates that when controlling for fixed effects, the presence and the size of crowd do not significantly affect any game outcome or referee decision variables even at 5%
significance level. This also suggests that NFL is fair in terms of referee decisions, based on the 10 considered seasons we cannot find evidence that cheering fans are able to put a pressure on the referees that would lead to biased decisions potentially favouring the home team. Furthermore, the home team is unable to derive any measurable benefit from the presence of supporting fans, no significant psychological advantage is observed that would lead to a better performance when playing in front of a greater number of spectators.
Finally, for NHL games we can see another unique result that is different compared to the previous two sport leagues. Table 4 displays the results for NHL, and as we can see the ATT regressor variable significantly affects the home win share (p <5%), home score (p <5%), away score (p <1%) and score difference (p <1%) outcome variables. Interpreting the coefficients of the regressions, the probability of home team’s winning increases along with the size of audience, the expected points scored by the home team also increases with the size of audience, whereas the the expected points of away team is smaller when playing in front of a bigger audience. As a consequence the score difference between the home and visiting team also gets greater with more fans. All these results are in line with our expectations. Again, similarly to the NBA games the CD dummy variable does not significantly affect any of the possible outcome variables suggesting that the effect of different audience size is stronger than the effect of playing with or without spectators. On the other hand, surprisingly none of the four referee decision outcome variables are significantly affected by either theCD or theATT regressor variables. Both the home and away penalty variables increase along with the size of the audience, but this rise is not significant even at 5% confidence level. This suggests that the NHL referee decision activity is not substantially affected by the presence or size of fan attendance, the supporting fans are unable to put any pressure on the referees that would influence their decision making. Nevertheless, home court advantage still exists and clearly the number of spectators gradually increase the performance of the home team. Therefore, we can speculate that the home advantage for NHL games is not entangled with any kind of referee bias. As the extent of home advantage depends on the size of the audience, we can claim that the players are able to gain an elevated psychological advantage from playing in front of a larger number of supporters.
We checked the robustness of these results for each of the three leagues by altering the methodology. We either use a subset of the filtered dataset or change the set-up of the panel regression. First in Tables 5–7 we only consider games with strictly positive attendance. That said, we excluded those matches that were played behind closed doors. This dataset contains all games before the measures due to the emergence of COVID-19 pandemic were introduced and the games after the onset of COVID-19 pandemic where some fans were re-allowed to attend the games. As for these observations the closed door dummy variable is always 0, therefore we
12
remove this from the panel regression and only leave in the ATT variable as a sole regressor.
The results in Table 5–7 are analogous to the ones we obtained previously for all three leagues.
NBA match outcomes and referee decisions are substantially affected by the size of the audience, NFL match outcomes and referee decisions are not significantly influenced by the number of fans, whereas NHL match outcomes are affected by attendance but referee decisions remain relentless to the change in the number of spectators. Clearly one can argue that the post COVID-19 games even with fan attendance are essentially different compared to the matches of previous normal seasons. Mask wearing for attendees at games were required, leading to completely different spectator behaviour during the game. Thus, we take a step forward and repeat the previous regression by only considering games prior to the emergence of COVID-19 pandemic. Doing so, we aim to understand that under normal circumstances what the impact of audience size on game outcomes is. Results are displayed in Tables 8–10. As for NBA games even under normal circumstances the size of crowd positively affects the performance of the home team and also the score difference between the two teams, besides with a growing crowd size the number of penalties awarded to the home team lowers significantly. Regarding NFL games, results suggest that even during normal times crowd size does not have a significant impact on neither team’s performances nor referee’s decisions. Regarding NHL games, the audience size does not perceivably influence the decision making of the referees, but even under normal circumstances the home score and the score difference between home and away team significantly increases with the size of audience.
Even though the share of home team’s winning only insignificantly rises with the crowd size, there is still a measurable impact caused by the number of spectators in terms of expected scored points.
Our second main robustness test is concerned with changing the fixed effect variables of the regression. Instead of fixing the home and away team, we can alternatively fix the concrete match- up. Certain match-ups, like derbies might have some individual traits that are not absorbed if the home team and away team are separately fixed. Fixing thus the match-up along with the location of the game we consider a separate panel regression. Results are displayed in Tables A1–A3 in the Appendix. These tables strengthen the robustness of the initial panel regression and bolster our findings. For all three leagues, we obtain the same kind of significant impacts of audience size on match outcomes and referee decisions as with the initial regression set-up.
Next, we also want to address the fact that not all stadiums have the same capacity. Regard- ing NBA stadiums, capacity is between 16867 and 20917, for NHL stadiums capacity is between 15321 and 21302 and for NFL stadiums capacity is between 61500 and 82500. Hence we can calculate for each game relative attendance or crowd density to measure what proportions of the seats of the stadiums were filled for the different matches. This crowd density variable clearly has a strong positive correlation with the attendance variable, yet it can still control inequalities between the available facilities of the different teams. Using this crowd density as the regressor variable instead of ATT, we rerun the panel regression considering games with strictly positive attendance. Results are shown in Tables A4–A6 in the Appendices. In terms of significance of the regressor variable for the different outcomes there is no fundamental difference compared to what we have earlier seen in Tables 5–7. For NBA games crowd density influences match outcomes and referee calls, for NFL games crowd density does not significantly influence match outcomes or referee calls, and for NHL games crowd density substantially influences match outcomes but not referee calls.
Finally, we consider a probit model for all three leagues where for the home team’s winning share binary outcome variable a probit regression is applied. Results can be seen in Table A7 in the Appendix. These are perfectly in line with our previous results, for NBA and NHL games audience size has a significant impact on the probability of home team’s winning, whereas for NFL there is no significantly identifiable impact.
To sum up, we got three different results for the three considered leagues. As for NBA, both team’s performances and referee’s decisions are significantly affected by the size of the
audience. For NHL, team’s performances are affected by the size of the audience, still this cannot be explained via increased social pressure on the referees as the number of penalties are not substantially different under different spectator sizes. Finally for NFL, neither team’s performances nor referee’s decisions are affected by the amount of the spectators based on our sample consisting of ten seasons. These findings hold even under normal circumstances when no safety measures are implemented. In conclusion, we can assert that social pressure on agent’s behaviour can be very different depending on the type of the activity. Our study also suggests that out of these three leagues NHL and NFL are fair in terms of decision making, whereas referee bias is more widespread in NBA games.
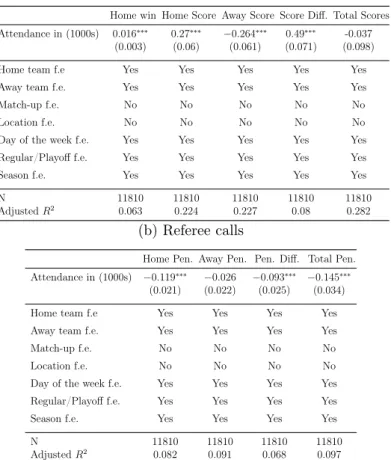
Table 5: Estimated effects of playing NBA games behind various audience sizes on match results and referee decisions considering all games since Season 2011-2012 with a home court and without closed doors
(a) Match outcome
Home win Home Score Away Score Score Diff. Total Scores Attendance in (1000s) 0.016∗∗∗ 0.27∗∗∗ −0.264∗∗∗ 0.49∗∗∗ -0.037
(0.003) (0.06) (0.061) (0.071) (0.098)
Home team f.e Yes Yes Yes Yes Yes
Away team f.e. Yes Yes Yes Yes Yes
Match-up f.e. No No No No No
Location f.e. No No No No No
Day of the week f.e. Yes Yes Yes Yes Yes
Regular/Playoff f.e. Yes Yes Yes Yes Yes
Season f.e. Yes Yes Yes Yes Yes
N 11810 11810 11810 11810 11810
AdjustedR2 0.063 0.224 0.227 0.08 0.282
(b) Referee calls
Home Pen. Away Pen. Pen. Diff. Total Pen.
Attendance in (1000s) −0.119∗∗∗ −0.026 −0.093∗∗∗ −0.145∗∗∗
(0.021) (0.022) (0.025) (0.034)
Home team f.e Yes Yes Yes Yes
Away team f.e. Yes Yes Yes Yes
Match-up f.e. No No No No
Location f.e. No No No No
Day of the week f.e. Yes Yes Yes Yes
Regular/Playoff f.e. Yes Yes Yes Yes
Season f.e. Yes Yes Yes Yes
N 11810 11810 11810 11810
AdjustedR2 0.082 0.091 0.068 0.097
Notes:∗∗∗,∗∗;∗indicate significance from zero at 0.1%, 1%, and 5% levels, respectively, two-sided tests. Standard errors (reported in parentheses) are corrected for heteroskedasticity.
14
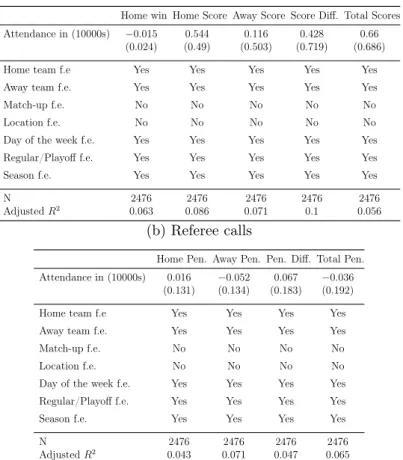
Table 6: Estimated effects of playing NFL games behind various audience sizes on match results and referee decisions considering all games since Season 2011-2012 with a home court and without closed doors
(a) Match outcome
Home win Home Score Away Score Score Diff. Total Scores Attendance in (10000s) −0.015 0.544 0.116 0.428 0.66
(0.024) (0.49) (0.503) (0.719) (0.686)
Home team f.e Yes Yes Yes Yes Yes
Away team f.e. Yes Yes Yes Yes Yes
Match-up f.e. No No No No No
Location f.e. No No No No No
Day of the week f.e. Yes Yes Yes Yes Yes
Regular/Playoff f.e. Yes Yes Yes Yes Yes
Season f.e. Yes Yes Yes Yes Yes
N 2476 2476 2476 2476 2476
AdjustedR2 0.063 0.086 0.071 0.1 0.056
(b) Referee calls
Home Pen. Away Pen. Pen. Diff. Total Pen.
Attendance in (10000s) 0.016 −0.052 0.067 −0.036 (0.131) (0.134) (0.183) (0.192)
Home team f.e Yes Yes Yes Yes
Away team f.e. Yes Yes Yes Yes
Match-up f.e. No No No No
Location f.e. No No No No
Day of the week f.e. Yes Yes Yes Yes
Regular/Playoff f.e. Yes Yes Yes Yes
Season f.e. Yes Yes Yes Yes
N 2476 2476 2476 2476
AdjustedR2 0.043 0.071 0.047 0.065
Notes:∗∗∗,∗∗;∗indicate significance from zero at 0.1%, 1%, and 5% levels, respectively, two-sided tests. Standard errors (reported in parentheses) are corrected for heteroskedasticity.
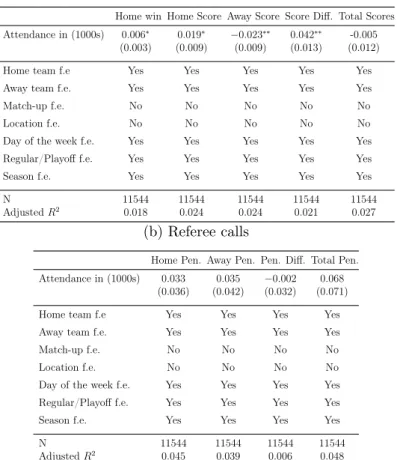
Table 7: Estimated effects of playing NHL games behind various audience sizes on match results and referee decisions considering all games since Season 2011-2012 with a home court and without closed doors
(a) Match outcome
Home win Home Score Away Score Score Diff. Total Scores Attendance in (1000s) 0.006∗ 0.019∗ −0.023∗∗ 0.042∗∗ -0.005
(0.003) (0.009) (0.009) (0.013) (0.012)
Home team f.e Yes Yes Yes Yes Yes
Away team f.e. Yes Yes Yes Yes Yes
Match-up f.e. No No No No No
Location f.e. No No No No No
Day of the week f.e. Yes Yes Yes Yes Yes
Regular/Playoff f.e. Yes Yes Yes Yes Yes
Season f.e. Yes Yes Yes Yes Yes
N 11544 11544 11544 11544 11544
AdjustedR2 0.018 0.024 0.024 0.021 0.027
(b) Referee calls
Home Pen. Away Pen. Pen. Diff. Total Pen.
Attendance in (1000s) 0.033 0.035 −0.002 0.068 (0.036) (0.042) (0.032) (0.071)
Home team f.e Yes Yes Yes Yes
Away team f.e. Yes Yes Yes Yes
Match-up f.e. No No No No
Location f.e. No No No No
Day of the week f.e. Yes Yes Yes Yes
Regular/Playoff f.e. Yes Yes Yes Yes
Season f.e. Yes Yes Yes Yes
N 11544 11544 11544 11544
AdjustedR2 0.045 0.039 0.006 0.048
Notes:∗∗∗,∗∗;∗indicate significance from zero at 0.1%, 1%, and 5% levels, respectively, two-sided tests. Standard errors (reported in parentheses) are corrected for heteroskedasticity.
16
Table 8: Estimated effects of playing NBA games behind various audience sizes on match results and referee decisions considering all games since Season 2011-2012 and until the emergence of COVID-19 pandemic with a home court
(a) Match outcome
Home win Home Score Away Score Score Diff. Total Scores Attendance in (1000s) 0.022∗∗∗ 0.304∗∗∗ −0.347∗∗∗ 0.651∗∗∗ -0.043
(0.003) (0.067) (0.069) (0.079) (0.111)
Home team f.e Yes Yes Yes Yes Yes
Away team f.e. Yes Yes Yes Yes Yes
Match-up f.e. No No No No No
Location f.e. No No No No No
Day of the week f.e. Yes Yes Yes Yes Yes
Regular/Playoff f.e. Yes Yes Yes Yes Yes
Season f.e. Yes Yes Yes Yes Yes
N 11219 11219 11219 11219 11219
AdjustedR2 0.072 0.223 0.224 0.089 0.275
(b) Referee calls
Home Pen. Away Pen. Pen. Diff. Total Pen.
Attendance in (1000s) −0.129∗∗∗ −0.004 −0.125∗∗∗ −0.133∗∗
(0.025) (0.026) (0.03) (0.04)
Home team f.e Yes Yes Yes Yes
Away team f.e. Yes Yes Yes Yes
Match-up f.e. No No No No
Location f.e. No No No No
Day of the week f.e. Yes Yes Yes Yes
Regular/Playoff f.e. Yes Yes Yes Yes
Season f.e. Yes Yes Yes Yes
N 11219 11219 11219 11219
AdjustedR2 0.084 0.093 0.073 0.098
Notes:∗∗∗,∗∗;∗indicate significance from zero at 0.1%, 1%, and 5% levels, respectively, two-sided tests. Standard errors (reported in parentheses) are corrected for heteroskedasticity.
Table 9: Estimated effects of playing NFL games behind various audience sizes on match results and referee decisions considering all games since Season 2011-2012 and until the emergence of COVID-19 pandemic with a home court
(a) Match outcome
Home win Home Score Away Score Score Diff. Total Scores Attendance in (10000s) −0.037 0.178 0.332 −0.153 0.51
(0.027) (0.547) (0.555) (0.79) (0.768)
Home team f.e Yes Yes Yes Yes Yes
Away team f.e. Yes Yes Yes Yes Yes
Match-up f.e. No No No No No
Location f.e. No No No No No
Day of the week f.e. Yes Yes Yes Yes Yes
Regular/Playoff f.e. Yes Yes Yes Yes Yes
Season f.e. Yes Yes Yes Yes Yes
N 2358 2358 2358 2358 2358
AdjustedR2 0.07 0.086 0.072 0.103 0.054
(b) Referee calls
Home Pen. Away Pen. Pen. Diff. Total Pen.
Attendance in (10000s) 0.181 −0.106 0.287 0.075 (0.152) (0.151) (0.205) (0.222)
Home team f.e Yes Yes Yes Yes
Away team f.e. Yes Yes Yes Yes
Match-up f.e. No No No No
Location f.e. No No No No
Day of the week f.e. Yes Yes Yes Yes
Regular/Playoff f.e. Yes Yes Yes Yes
Season f.e. Yes Yes Yes Yes
N 2358 2358 2358 2358
AdjustedR2 0.037 0.068 0.051 0.055
Notes:∗∗∗,∗∗;∗indicate significance from zero at 0.1%, 1%, and 5% levels, respectively, two-sided tests. Standard errors (reported in parentheses) are corrected for heteroskedasticity.
18
Table 10: Estimated effects of playing NHL games behind various audience sizes on match results and referee decisions considering all games since Season 2011-2012 and until the emergence of COVID-19 pandemic with a home court
(a) Match outcome
Home win Home Score Away Score Score Diff. Total Scores Attendance in (1000s) 0.005 0.021∗ −0.014 0.035∗ 0.007
(0.003) (0.01) (0.01) (0.015) (0.013)
Home team f.e Yes Yes Yes Yes Yes
Away team f.e. Yes Yes Yes Yes Yes
Match-up f.e. No No No No No
Location f.e. No No No No No
Day of the week f.e. Yes Yes Yes Yes Yes
Regular/Playoff f.e. Yes Yes Yes Yes Yes
Season f.e. Yes Yes Yes Yes Yes
N 11167 11167 11167 11167 11167
AdjustedR2 0.018 0.023 0.025 0.021 0.027
(b) Referee calls
Home Pen. Away Pen. Pen. Diff. Total Pen.
Attendance in (1000s) 0.04 0.01 0.031 0.05 (0.039) (0.047) (0.037) (0.077)
Home team f.e Yes Yes Yes Yes
Away team f.e. Yes Yes Yes Yes
Match-up f.e. No No No No
Location f.e. No No No No
Day of the week f.e. Yes Yes Yes Yes
Regular/Playoff f.e. Yes Yes Yes Yes
Season f.e. Yes Yes Yes Yes
N 11167 11167 11167 11167
AdjustedR2 0.046 0.039 0.006 0.048
Notes:∗∗∗,∗∗;∗indicate significance from zero at 0.1%, 1%, and 5% levels, respectively, two-sided tests. Standard errors (reported in parentheses) are corrected for heteroskedasticity.
4 Conclusion and discussion
It has long been observed that social pressure potentially changes behaviour and decision making, individuals tend to seek a conformist behaviour.
The COVID-19 pandemic offers a rare opportunity to study the social pressure in a sport context. A lot of papers exploited the naturally exogenous change in the crowd size to better understand referee bias and its causal relationship with home and away teams’ performances for European football. To our knowledge this is the first paper that aims to contribute to this growing literature by investigating the mechanism behind home advantage for three major American sport leagues (NBA, NFL, NHL) considering audience sizes and referee decisions. The articles studying European football games overwhelmingly support the notion that referee bias favouring the home team significantly reduces without a partisan crowd, also that home team’s performance deteriorates without this crowd.
For the three considered sports of this study, we have obtained different types of balancing mechanisms. In terms of match outcomes, the results reveal a significantly positive relationship between home court advantage and audience size for NBA and NHL games. On the other hand there is no empirically evident significant relationship between home court advantage and audience size for NFL games. Regarding referee calls, for NBA we observe significantly greater referee bias towards home team in terms of awarded penalties for the teams as crowd size grows, but we have not observed significant relationship between crowd size and referee bias for NFL and NHL. The interpretation of these results is that for NBA games home crowd puts a pressure on the referees that results in biased decisions which ultimately leads to better home team’s