2006–2018
Viktor Pál University of Szeged, Hungary E-mail: pal.viktor@geo.u-szeged.hu Gábor Lados University of Szeged, Hungary E-mail: ladosg@geo.u-szeged.hu Zsófia Ilcsikné Makra University of Szeged, Hungary E-mail:
makra.zsofia@geo.u-szeged.hu Lajos Boros University of Szeged, Hungary E-mail: borosl@geo.u-szeged.hu Annamária Uzzoli Geographical Institute, Research Centre for Astronomy and
Earth Sciences, Hungary E-mail:
uzzoli.annamaria@csfk.org Szabolcs Fabula University of Szeged, Hungary
E-mail:
Fabula.Szabolcs@geo.u-szeged.hu Keywords:
health workforce, physicians, core-periphery, concentration indices, NUTS 2 regions
The shortage and uneven geographic distribution of health workers is considered a severe global problem nowadays. Recent studies examining inequalities in health workforce supply at various spatial scales suggest that health workers’ geographic distribution follows a core-periphery pattern as the more developed areas are generally better supplied with health labour than the less developed ones. Here, we explore the regional patterns and temporal changes of the geographic distribution of physicians in the European Union (EU) at the Nomenclature of territorial units for statistics (Nomenclature des unités territoriales statistiques – NUTS) 2 level between 2006 and 2018. We also compare the levels of concentration and inequality in the geographic distribution of physicians, economic development, and health outcomes. We utilise a mix of statistical methods such as descriptive statistics, indices of concentration and inequality, and bivariate correlation analysis based on Eurostat data. Our results provide evidence that the regional distribution of physicians in the EU shows a core-periphery pattern: NUTS regions with capital cities or metropolitan areas have more physicians. In addition, the regional patterns of the distribution of physicians in the EU are stable in time, and their geographic concentration is strengthening in the long run. Our results also suggest that there is a positive relationship between the geographic distribution of physicians and health outcomes; however, this relationship needs further investigation.
Introduction
In healthcare systems, human resources are regarded as one of the key elements that helps in maintaining the whole system. However, due to labour force shortages, it often becomes ‘the weakest link’ in this system. Globally, health needs and demands are growing much faster than healthcare capacities. Nevertheless, the training of a health worker, especially for specialists, usually takes a very long time compared to other professionals: it may take ten years for a health worker to become a practising specialist. Thus, health labour can be regarded as a scarce and very valuable asset.
This increases the already high demand for human resources in health care, leading to a shortage of health workers in many areas, and granting a high position for these workers in the labour market.
The difference between demand and supply for health professionals is one of the major drivers of migration of health workers. On the one hand, this shortage is seen at different geographical scales; on the other hand, it exacerbates spatial disparities of healthcare professionals. Globally, most highly skilled health professionals live and work in core regions (Tagai et al. 2018). Nevertheless, the health status of a population is usually worse in peripheral regions. Hence, there is a shortage of health workers in areas where the demand for health labour is the highest.
The shortage and uneven geographical distribution of health workers is a major issue in the EU as well. This has been alleviated by significant migration because of the liberalisation of labour markets. However, emigration of health workers exacerbates the lack of human resources in peripheral regions; for example, East Central Europe is one of the biggest sources of emigrant health workers within the Union (Buchanan et al. 2014, Zuk et al. 2019).
Considering these differences in health labour supply, it is crucial to identify areas with low human resource capacity. European researchers focus primarily on differences between countries and analyse national-level data, but pay less attention to the spatial disparities within countries (e.g., Witter et al. 2020). In addition, several studies from non-European countries compare the geographic distributions of health professionals, economic development, and health status with each other by using national and sub-national territorial units as the spatial framework of research (e.g., Carvalho et al. 2012, Egri 2017).
To address this research gap, this study aims to analyse the geographical distribution of health professionals in the EU, measure its changes over the past one and a half decade, and highlight factors which are interrelated to the spatial distribution of health workers.
Using Eurostat data, we compile a database on frequently used statistical indicators for examining the distribution of health workers, economic development, and health status at the NUTS 2 territorial level. We also examine how these indicators are correlated to each other using statistical methods. The remainder of
this study is structured as follows: first, via a literature review focusing on core- periphery theory, we provide a short overview about the spatiality of human resource provision in health care. Then, we provide a description of our statistical database and our research methods. Finally, we summarise our results and end the paper with some concluding remarks.
Geographical distribution of healthcare professionals:
literature review
One of the major challenges today is the global shortage of health professionals.
There are several reasons for this shortage. First, it is estimated that there is a shortage of 10 million health workers in the global labour market. Furthermore, this shortage is projected to increase over the next few decades (Buchan 2002, WHO 2006, [2]). The COVID-19 pandemic (Kincses−Tóth 2020) also demonstrates that infectious diseases are still challenging even in the 21st century and could jeopardise the functioning of the entire health system by straining health workers (Black et al.
2020).
Second, there is a methodological challenge: official statistics do not always cover active staff numbers. For example, Karan et al. (2019) pointed out such inconsistencies in their Indian case study: on the one hand, there were differences between the official numbers of health workers registered by national and regional authorities; on the other hand, as many as 20% of these professionals could be out of the healthcare system (e.g., emigrated, left, or are planning to leave their professions and looking for another job). Nevertheless, here, we do not address such gaps in statistics on health workers in detail.
Third, there is a disproportionate geographical distribution of health workers between different regions. Studies show that economically more developed regions are better supplied with health workforce; furthermore, the territorial distribution of health workers is generally more favourable in developed countries than in developing regions (WHO 2006, Siyam−Dal Poz 2014, Scheffler et al. 2018).
However, the role of geographical scales is crucial because this territorial distribution shows different patterns at the macro-regional, national, and regional scales. For example, Kanchanachitra et al. (2011) found that there is no shortage in the entire East-Asian macro-region; however, at the national and regional levels there are significant territorial inequalities. As a further aspect of geographical scales, the urban-rural dichotomy also plays a key role. In general, the distribution of health professionals is more favourable in urban areas than in rural or remote, sparsely populated regions (Chen et al. 2004, Anand et al. 2008, Meliala et al. 2013). Even with the principle of progressivity in health care, when the more complicated, special cases are treated in bigger hospital centres and the simpler, more common cases are decentralised, this territorial inequality of healthcare professionals causes
huge problems in rural and peripheral regions [1]. Moreover, an urban-rural dichotomy can be observed in both more developed and less developed countries (Dussault−Franceschini 2006). However, Ono et al. (2014) show that the degree of urban-rural inequality differs by country. This is partly due to the definition of ‘rural area’ and partly due to different data collection practices. Therefore, based on the antecedents in the literature, it is worth considering the role of geographical scales in the study of the territorial distribution of health professionals and giving a greater role to the territorial divisions of the sub-national levels as units of analysis.
We make two general statements about the spatial distribution of health professionals that are relevant to our own research. On the one hand, as several studies demonstrate, regional indicators measuring the supply of health professionals show a close relationship with other socio-economic indicators;
especially, there is strong correlation with gross domestic product (GDP) per capita and income (Correia−Veiga 2010, Carvalho et al. 2012). Furthermore, the geographical distribution of health professionals shows a significant relationship with health status indicators (e.g., mortality rate, life expectancy at birth), and not just economic ones (Anand et al. 2008, Aristovnik 2015). Still, regional patterns of health indicators also correlate with economic centres and peripheries (Uzzoli 2016).
However, territorial inequalities are quite persistent. Inequalities in the geographical distribution of health professionals are increasing or sustaining over time, as studies conducted at sub-national levels in the United Kingdom (UK) (Hann−Gravelle 2004), Portugal (Correia−Veiga 2010), and Japan (Tanihara et al. 2011, Hara et al.
2017) show. These studies also present that the territorial distribution of health workers is embedded in a social context, considering the socio-economic spatial structure and development trends of the study area.
Recent EU-level studies partially support these statements. According to surveys, there is no significant correlation between the economic performance of individual countries and the number of health professionals per 1,000 people. For example, in terms of physicians, Greece, Lithuania, and Bulgaria were above the EU average in 2016, while the Netherlands, Finland, Belgium, Luxembourg, Ireland, the UK, and Hungary were below it (OECD/EC 2018). However, regarding trends in human resource supply, there are differences between countries (Daugirdas−Pociute- Sereikiene 2018, Pavolini−Kuhlmann 2016). Furthermore, several global and national reports highlight that physicians tend to be concentrated in urban regions;
this is because physicians are more strongly attached to hospitals and specialised institutions, and prefer the more urbanised regions to rural ones (OECD 2017, OECD/EC 2018). Winkelmann et al. (2020) had slightly different results when they highlighted major inequalities between NUTS 2 regions in the distribution of healthcare workers within the EU: there was an approximately 4.5-fold difference between regions for both doctors and nurses. Physicians tend to be concentrated in metropolitan regions around larger cities, whereas the concentration of nurses is
higher in sparsely populated areas. Here, due to data availability, we focus exclusively on the spatial distribution of physicians. In contrast, Winkelmann et al.
(2020) also faced these problems (lack of data), and compared 15 countries for physicians and 8 countries for nurses. In comparison, our study covers a wider range of EU countries.
Considering these antecedents of the literature, we formulate three hypotheses:
1. The pattern of the territorial distribution of doctors in the EU follows the pattern of global centres where the more economically developed regions, especially metropolitan regions, are better covered by health workers.
2. The patterns (such as inequality) of the territorial distribution of doctors are consistent over time as their concentration strengthens rather than weakens.
3. The territorial distribution of doctors shows a positive correlation with indicators of health status: the health outcomes of the population is generally more favourable in regions that are better supplied with health labour.
Data and methods
The case study and the territorial division of the research
This research focuses on the members of the EU and the UK. Although the UK is no longer an EU member state, this withdrawal has happened recently and the details of the post-Brexit relationship between the EU and the UK are under negotiation. Furthermore, the country itself employs many physicians from the EU.
The UK was one of the most popular destination countries for health workers during the past decades. Thus, the country has had a significant influence on the spatiality of physicians in Europe. Hence, this analysis covers 28 countries.
During this research, the NUTS classification was the basic territorial division.
However, using this framework has several benefits as well as limitations (see also, Brandmueller et al. 2017, Egri−Kőszegi 2018, Dudek−Sedefoğlu 2019). We have conducted our analysis at NUTS 2 level, but in the case of Germany, the UK, Ireland, and Lithuania we have used data from NUTS 1 level. NUTS 2 level provides data with appropriate details to measure territorial inequalities in a core- periphery context. However, in the above-mentioned countries we have changed the geographical scale of our analysis due to a significant lack of data (for example, in the cases of Germany and Ireland, economic and demographic data were available for NUTS 2 level, but data for health indicators were available only for NUTS 1 level).
As NUTS territorial units change over a certain period, it was necessary to choose one of the NUTS classifications. Our research analysis uses the NUTS 2016 version; however, flexibility was needed due to the availability of data. Hence, we used the NUTS 2013 classification units for the Polish Mazovia region (including
the capital, Warsaw) and Central Hungary (including Budapest). Without these changes, some dimensions could not have been measured and compared through time. Moreover, Melilla from Spain was excluded because of the lack of data.
Altogether, 224 regions (32 on NUTS 1 level, and 192 on NUTS 2 level) were involved in this analysis.
Research dataset
Along with the number of physicians, other demographic, economic, and health data have been analysed. To interpret spatial processes appropriately, we also considered temporal changes in these indicators. We compared four-year periods from 2006 to the present: 2006, 2010, 2014, and 2018. Thus, we could analyse changes in territorial inequalities since the enlargement of the EU in 2004. This period can be characterised by the gradual liberalisation of the EU labour market, and includes the economic crisis of the late 2000s, which also had significant labour market effects (Glorius 2018, Illés 2018). Initially, we also aimed to collect data from 2002 to shed light on the situation before the 2004 enlargement of the EU.
However, due to an extensive lack of data, we excluded data from 2002.
Several demographic, economic, and health indicators were considered here.
Finally, due to data availability, the following indicators were used: life expectancy at birth, ageing index, net migration rate (per 100,000 inhabitants), mortality rate, GDP per capita in purchasing power standard (PPS), share of human resources in science and technology, share of economically active population (aged between 15 and 74), number of patients (per million people), number of doctors (per 100,000 people), number of hospital beds (per 100,000 people), and standardised death rates.
Since the available databases do not provide data on the number of specialist doctors, it was not possible to consider the differences in the spatial distribution of specialist doctors and general practitioners.
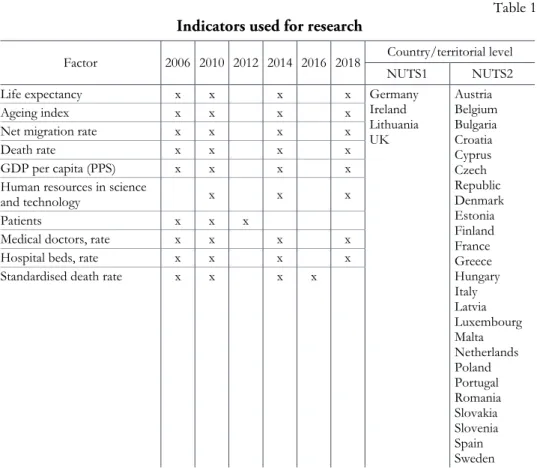
In most cases, the data source was the Eurostat database. However, this official source does not cover each indicator. Hence, we used data from various national statistical offices, national agencies, international organisations (for example, the Organisation for Economic Co-operation and Development [OECD]), and other official sources (such as the Encyclopaedia Britannica) to minimise data gaps (Table 1).
Table 1 Indicators used for research
Factor 2006 2010 2012 2014 2016 2018 Country/territorial level NUTS1 NUTS2 Life expectancy x x x x Germany
Ireland Lithuania UK
Austria Belgium Bulgaria Croatia Cyprus Czech Republic Denmark Estonia Finland France Greece Hungary Italy Latvia Luxembourg Malta Netherlands Poland Portugal Romania Slovakia Slovenia Spain Sweden Ageing index x x x x
Net migration rate x x x x Death rate x x x x GDP per capita (PPS) x x x x Human resources in science
and technology x x x Patients x x x Medical doctors, rate x x x x Hospital beds, rate x x x x Standardised death rate x x x x
Despite all these data sources, there were several missing records and contradicting official numbers we had to deal with. In one case, the number of practising physicians in the UK was modified using a secondary data source (OECD) because there was significant difference (a deviation of 20–40%) between aggregated national and regional data from 2009 onwards. Therefore, the regional data for 2008 have been extrapolated using the average annual changes of the national-level data in the UK. As the next step of secondary data collection, data for missing years were calculated using a linear prediction method. This was necessary, because the chosen statistical analysis methods measuring concentration were sensitive to missing datasets, omitting data-deficient regions would have significantly modified the results. Contrarily, omitting spatial levels with empty cell values would have reduced the number of regions included in the study to an extent that the results would also have been statistically misleading. Challenging deficiencies for basic data such as population or GDP in PPS were also observed. This was even more typical for more complex indicators such as the standardised mortality rate or
the ageing index. Although the dynamics of change may be affected by this data change, completely empty cell values would have further influenced the results.
Another way to fill in the missing records was to take the data of the nearest year available (instead of the linear forecast), wherever possible (+/–2 years). This has been the case, for example, in the case of standard mortality rate or patients, but in some countries, we had to do the same for doctors (for example, Belgium: data from 2011 was used instead of 2010; the Czech Republic: 2013 instead of 2014; the UK: 2016 instead of 2018; Luxembourg: 2017 instead of 2018; and Sweden: 2017 instead of 2018), population (Mayotte: 2009 instead of 2010), and GDP (Mayotte:
2006 instead of 2010, 2009 instead of 2010) (see Table 1).
If even the above-mentioned methods did not ensure adequate occupancy for an indicator, it was not included in the analysis. The number of nurses is a typical example. Unfortunately, we could not consider this indicator in our analysis because on the one hand, Eurostat only provided data at NUTS 2 level until 2014; on the other hand, data from several countries were missing and were not available in national databases. Furthermore, sometimes definitions of the indicator were not uniform. For instance, nurses were defined in two different ways in two countries or (time) periods. Among economic indicators, the number of enterprises and income data were excluded from the analysis for similar reasons.
Methodology of statistical analysis
Data were analysed using two mathematical-statistical methods. First, we examined the spatial concentrations of the absolute number of physicians, GDP in PPS, and population to measure territorial inequalities. Afterwards, concentration indicators were calculated for four different years. We used descriptive statistical indicators, such as mean, median, range, standard deviation, relative standard deviation, and relative range, to characterise the dataset. In addition, we used more complex indicators to express the degree of spatial concentration. Using the Gini index (Shimamoto 2019), we could draw conclusions about the relative magnitude of the spatial concentration of physicians. Using the Herfindahl-Hirschman index (HHI) (Ben said 2021) and the concentration index, the unevenness in the regional distribution of physicians was measured. Finally, based on the Dual indicator, we deduced the ratio of sub-average and above-average subgroups within an indicator.
Therefore, we could estimate the level of concentration (for example, the number of physicians is more concentrated in regions where their original numbers are already high, or not).
Second, in the regional comparison, we also examined the relationships among demographic, economic, and health data because of the core-periphery relationship.
Using SPSS statistical software, we examined the effect of each indicator on every other indicator via a correlation matrix using Pearson's correlation. During the
calculations, we had to consider two factors influencing the results. On the one hand, the lack of data was so extensive that the above-mentioned methods for missing data did not work. Therefore, we had to ignore blank values in calculations.
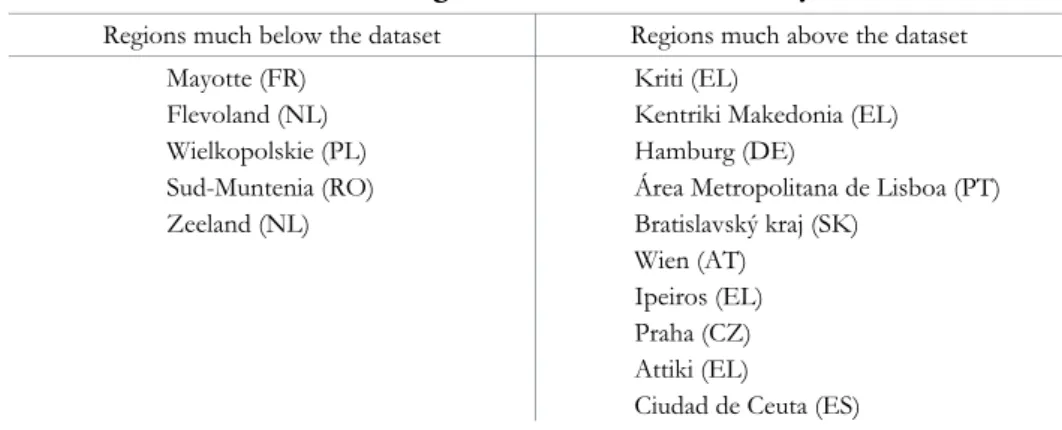
On the other hand, extreme values in the dataset could also have statistically modified the results. Thus, based on the most important indicator of our study, the number of doctors per 100 thousand people, regions with extreme values were excluded (Table 2).
Table 2 Excluded EU regions from correlation analysis
Regions much below the dataset Regions much above the dataset Mayotte (FR)
Flevoland (NL) Wielkopolskie (PL) Sud-Muntenia (RO) Zeeland (NL)
Kriti (EL)
Kentriki Makedonia (EL) Hamburg (DE)
Área Metropolitana de Lisboa (PT) Bratislavský kraj (SK)
Wien (AT) Ipeiros (EL) Praha (CZ) Attiki (EL)
Ciudad de Ceuta (ES)
We also measured both the territorial distribution and the differences in statistical mean of medical doctors by NUTS 1/NUTS 2 regions at the country- and EU-level. First, the group of countries was divided into sub-groups based on physician density (the number of medical doctors per 100,000 inhabitants). Second, several countries (Croatia, Cyprus, Estonia, Ireland, Latvia, Lithuania, Luxembourg, Malta, and Slovenia) were excluded because each consist of only one or two NUTS 2 regions. We used a variety of statistical methods to measure territorial differences.
On the one hand, we chose spatial statistical indicators (weighted mean, weighted standard deviation, and weighted relative standard deviation). On the other hand, spatial distribution at the country level was analysed by calculating the ratio of the physician density of the second highest-valued region to that of the highest-valued region, the ratio of the physician density of the highest-valued region to the country mean, and the ratio of the weighted mean of the country to that of the EU. In this second stage, the previously used statistical indicators (HHI, Gini index) were not used due to the extreme differences among countries regarding the number of NUTS 2 and NUTS 1 regions. The results are presented in maps.
Relationship among the geographic patterns of health workforce, economic development, and health outcomes in the EU: Empirical results
Here, we present and discuss our empirical findings in three subsections. First, we examine the descriptive statistics of the indicators introduced in the methodology section. Second, we highlight the results of the measures of geographic concentration and inequality for health workforce, economic development, and health outcomes. Finally, we present the bivariate correlations among the datasets of the analysed indicators.
Regional patterns and temporal changes in the distribution of health workforce, economic development, and population in the EU
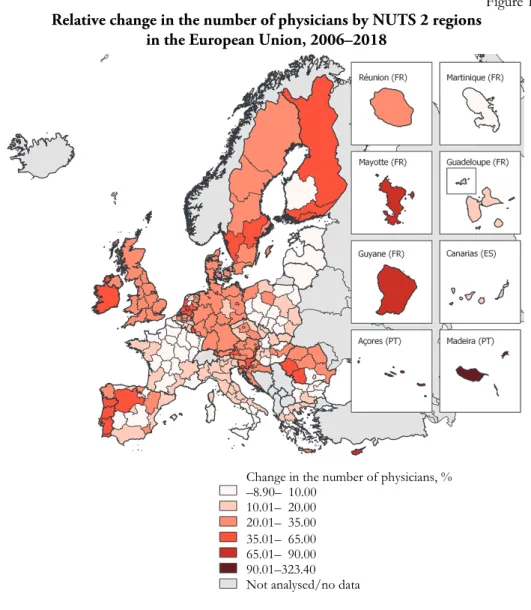
Analysis of the statistics on health workforce suggests that the overall supply of physicians in the EU has significantly increased in recent years: the total number of physicians in the EU grew by 300,000 between 2006 and 2018, with an average rise of 21% across the NUTS regions. The mean and median values of the regional datasets of the number of physicians also increased between 2006 and 2018, from 7,106 to 8,436, and from 4,543 to 5,142, respectively. Regarding regional differences, the number of physicians increased in all NUTS territorial units considered, except for 12 regions. The highest absolute growth was observed in Nordrhein-Westfalen (+16,742), whereas the largest relative growth was observed in Ciudad de Ceuta (+323%). Out of the regions showing a decrease, the highest levels of absolute and relative drop were recorded in Wielkopolskie (–517; –9%) (Figure 1).
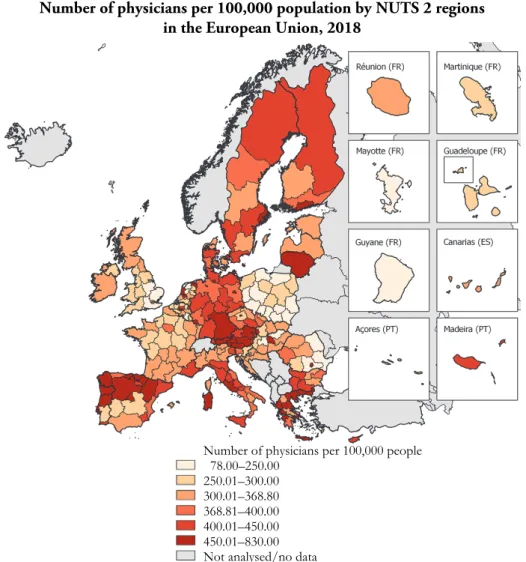
Physician density (i.e., the number of physicians per 100,000 population) also increased in the EU between 2006 and 2018: the average growth was 15%, from 320.4 to 368.8 physicians per 100,000 population, respectively. Regions with the top ten growth rates are in Portugal (5), Romania (2), Spain (2), and Cyprus. The highest levels of growth can be observed in Ciudad de Ceuta (+261.7%), Região Autónoma da Madeira (+96.9%), and Região Autónoma dos Açores (+84.9%). However, in 13 regions, physician density decreased between 2006 and 2018. Five of these regions are in France, three are in Spain, while the remaining six are in separate countries (Finland, Netherlands, Italy, Greece, and Poland, respectively). Notably, two NUTS 2 regions with capital cities also showed a decline in physician density (Île de France:
–5.1%; Lazio: –1.7%). Nevertheless, regions with capital cities and other metropolitan areas are still relatively well-supplied with physicians. This is also corroborated by the fact that of the 30 regions with the highest physician density in 2006, 11 were regions with capital cities (for example, Attiki, Praha, and Wien, among others) while others were regions with major metropolitan areas (for example, Hamburg, Bremen). In 2018, capital regions consisted slightly less than one third (9) of the 30 top-ranked NUTS units. However, the remaining ones
include several metropolitan regions (for example, Hamburg, Bremen, Utrecht, Salzburg). In contrast, no capital region is found among the 30 NUTS units with the lowest physician density in 2006 and 2018 (Figure 2). Regions with the highest decrease in physician density are Illes Balears (–19.7%), Wielkopolskie (–11.3%), and Länsi-Suomi (–9.7%). Notably, however, extreme fluctuations are observed in the data of some regions, for example, Ciudad de Ceuta (924.4. in 2010, 271.6 in 2014, and 829.7 in 2018), Comunidad Foral de Navarra (568.7 in 2010, 345.2 in 2014, and 508.5 in 2018), and Länsi-Suomi (491.4 in 2010, 336.8 in 2014, and 354.7 in 2018). However, this phenomenon can be attributed to errors in the collection of statistical data.
Figure 1 Relative change in the number of physicians by NUTS 2 regions
in the European Union, 2006–2018
Change in the number of physicians, % –8.90– 10.00
10.01– 20.00 20.01– 35.00 35.01– 65.00 65.01– 90.00 90.01–323.40 Not analysed/no data
Figure 2 Number of physicians per 100,000 population by NUTS 2 regions
in the European Union, 2018
Descriptive statistics on indicators of economic development (GDP PPS) and population also suggest an increase for the 2006–2018 period. However, the rate of growth differs for each indicator. The average rate of growth for GDP is 33% over the reference period: GDP has increased in most NUTS units, except for 13 regions. Regions with the highest absolute and relative positive change are in France (Île de France: +210,347 PPS; Mayotte: +156%), whereas regions with the highest absolute and relative fall are in Greece (Attiki: –17,767 PPS; Dytiki Ellada: –21%).
Between 2006 and 2018, the increase in mean and standard deviation for nominal GDP exceeded the increase in mean and standard deviation for the number of physicians, implying a higher increase in the concentration of GDP in this period.
Number of physicians per 100,000 people 78.00–250.00
250.01–300.00 300.01–368.80 368.81–400.00 400.01–450.00 450.01–830.00 Not analysed/no data
In comparison to GDP, the population of the analysed NUTS regions changed moderately, with an average increase of 3% from 2006 to 2018. The highest absolute and relative growth rates are recorded in Greater-London and Mayotte (+1,340,865 and +60%, respectively), whereas the highest absolute and relative decline is observed in Nord-Est, Romania, and Severozapaden, Bulgaria (–513,763 and –19%, respectively). In summary, our analysis suggests that the average supply of physicians across the analysed EU regions significantly improved in the 2006–2018 period, and it kept pace with increasing demand (i.e., growing GDP and population) (Table 3).
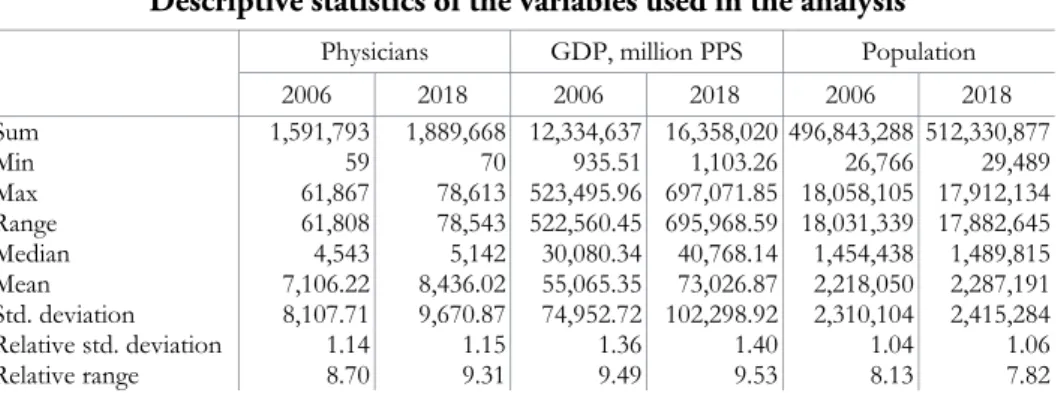
Table 3 Descriptive statistics of the variables used in the analysis
Physicians GDP, million PPS Population
2006 2018 2006 2018 2006 2018 Sum 1,591,793 1,889,668 12,334,637 16,358,020 496,843,288 512,330,877
Min 59 70 935.51 1,103.26 26,766 29,489
Max 61,867 78,613 523,495.96 697,071.85 18,058,105 17,912,134 Range 61,808 78,543 522,560.45 695,968.59 18,031,339 17,882,645 Median 4,543 5,142 30,080.34 40,768.14 1,454,438 1,489,815 Mean 7,106.22 8,436.02 55,065.35 73,026.87 2,218,050 2,287,191 Std. deviation 8,107.71 9,670.87 74,952.72 102,298.92 2,310,104 2,415,284 Relative std. deviation 1.14 1.15 1.36 1.40 1.04 1.06 Relative range 8.70 9.31 9.49 9.53 8.13 7.82
Regional patterns and temporal changes of the geographic concentration of health workforce, economic development, and health outcomes in the EU We also investigate the concentration in the geographic distribution of physicians.
In addition, we calculate the indices of concentration and inequality for population numbers and nominal GDP at NUTS 2 level (Table 4).
Table 4 Levels of concentration and inequality for the indicators used in the analysis
2006 2012 2014 2018
Physicians
HHI 102.76 103.15 103.42 103.31
Dual index 4.68 4.70 4.76 4.74
Gini index 0.498 0.501 0.500 0.499
GDP, million PPS
HHI 127.36 128.82 132.38 132.25
Dual index 5.89 5.75 5.78 5.84
Gini index 0.556 0.551 0.555 0.557
Population
HHI 93.07 93.07 93.33 94.43
Dual index 4.29 4.30 4.32 4.36
Gini index 0.475 0.477 0.478 0.481
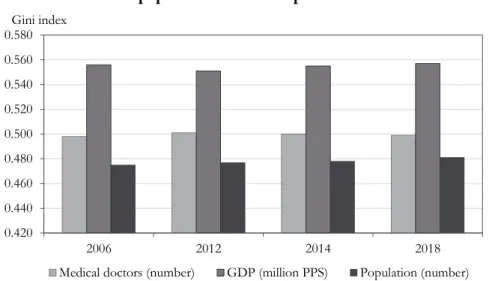
Among the three examined indicators, the concentration of GDP increased the most on average between 2006 and 2018, as the values of Gini index, HHI, and Dual index illustrate. Regarding the intensity of concentration change, the picture is more complex: the growth in concentration is the fastest for physicians according to HHI and Dual index, and for population according to the Gini index (Figures 3–5).
Figure 3 HHI scores for the number of physicians, GDP, and population
in the European Union
0 20 40 60 80 100 120 140
2006 2012 2014 2018
HHI
Medical doctors (number) GDP (million PPS) Population (number)
Figure 4 Dual index scores for the number of physicians, GDP, and population
in the European Union
0.00 1.00 2.00 3.00 4.00 5.00 6.00 7.00
2006 2012 2014 2018
Dual index
Medical doctors (number) GDP (million PPS) Population (number)
Figure 5 Gini index scores for the number of physicians, GDP, and
population in the European Union
0.420 0.440 0.460 0.480 0.500 0.520 0.540 0.560 0.580
2006 2012 2014 2018
Gini index
Medical doctors (number) GDP (million PPS) Population (number)
The scores of Gini index, HHI, and Dual index show increasing geographic concentration in the number of physicians over the 2006–2018 period. In this regard, it is worth considering the characteristics of the EU labour market. The enlargements of the EU in 2004, 2007, and 2013, and the subsequent gradual liberalisation of its common labour market have facilitated the intra-EU mobility of highly skilled health workers. In principle, such changes could have fostered a more even geographic distribution of health workers across the EU. However, regional data reflect the immense concentration of health professionals, especially that of physicians, in metropolitan regions. Presumably, the further liberalisation of the EU labour market and the economic crisis of the late 2000s have also strengthened this uneven distribution. However, diverging national health policies and historical development trajectories of EU member states should be considered as well. As each country examined here has its own public healthcare system, there is no such thing as a fully competitive European labour market for health workers. Thus, national labour market differences clearly influence the supply of health professionals across the member states.
In addition, the evolution of national policies on health care and labour market has led to the development of an abundant health workforce pool in some countries, especially in former state-socialist East Central European member states.
However, this does not mean that regional inequalities of health workforce supply are absent in these countries.
Further, note that the EU is not a closed labour market: the share of health workers from overseas countries is relatively high in some Northern and Western
European countries. These countries are not only destinations for but also sources of health labour (e.g., to North America). Nevertheless, overseas emigration of health workers can be observed in other EU member states as well. Although this outward migration from EU countries will probably intensify due to a globalising labour market, such migration flows are not considered here.
Another issue is methodological: the statistical data on physicians used for our study show the number of healthcare staff who were registered as physicians or medical doctors in EU member states between 2006 and 2018. However, these statistics do not provide information about the internal structure of the group of physicians: for example, there might be considerable imbalances among specialist categories, or between public and private sectors, not to mention the overlaps and hybrid constellations between these sectors in various countries.
As mentioned above, the overall number of physicians in the EU increased over the 2006–2018 period. However, this growth can only partly be explained by the enlargement of the Union; it is rather attributed to the growth of healthcare needs and demands. Although the growth is constant, there is a downward trend in its intensity: it was 6.3% over 2006–2010, 6.3% over 2010–2014, and 5.9% over 2014–
2018. Meanwhile, the number of physicians per 100,000 population also increased, from 325.8 to 380.2, in 2006 and 2018, respectively.
Increasing concentration can be observed in the case of the analysed variables, illustrated by the moderate but steady growth of Dual index scores (physicians, population) and by the increasing range of datasets (physicians per 100,000 population). Growing concentration can also be detected in the case of GDP.
Regarding Dual index scores for the number of physicians, note that neither the number of regions above or below the mean value changed between 2006 and 2018:
in both years, there were 67 (157) regions in the former (latter) group. These figures suggest that although inequality did not increase in an extreme manner, it was already high at the beginning of the examined period (with twice as many below- average regions as above-average ones).
Correlations among regional datasets of health workforce, economic development, and health outcomes
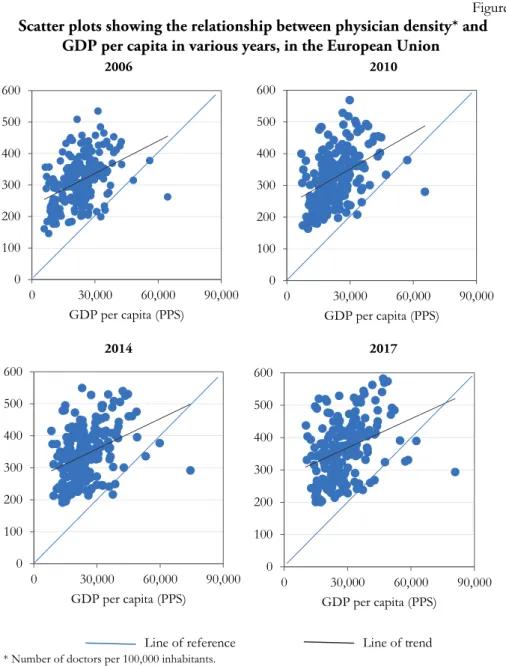
We also calculated bivariate correlation coefficients among the selected variables on health workforce, economic development, and health outcomes. First, we presumed a linear relationship between the regional datasets of physician density and GDP per capita. We visualised this relationship by creating scatter plots for each year. The scatterplot diagrams show a linear but moderately strong relationship between the two variables that weakens with time (Figure 6).
Figure 6 Scatter plots showing the relationship between physician density* and
GDP per capita in various years, in the European Union
2006 2010
0 100 200 300 400 500 600
0 30,000 60,000 90,000 GDP per capita (PPS)
0 100 200 300 400 500 600
0 30,000 60,000 90,000 GDP per capita (PPS)
2014 2017
0 100 200 300 400 500 600
0 30,000 60,000 90,000 GDP per capita (PPS)
0 100 200 300 400 500 600
0 30,000 60,000 90,000 GDP per capita (PPS)
Line of reference Line of trend
* Number of doctors per 100,000 inhabitants.
We created a boxplot diagram to detect outlier values within the dataset of physician density. Subsequently, we find the following outliers among the NUTS regions: Mayotte, Flevoland, Wielkopolskie, Sud-Muntenia, and Zeeland (extreme low values); Kriti, Kentriki Makedonia, Hamburg, Área Metropolitana de Lisboa, Bratislavský kraj, Wien, Ipeiros, Praha, Attiki, and Ciudad de Ceuta (extreme high values). These results are partially consistent with previous observations on the
spatial distribution of physicians. This is especially true for extreme high values, as several capital-city and metropolitan regions can be found in the outliers’ list.
Outliers have been excluded from correlation analysis to avoid their distortion effect.
For each year, the relationship between physician density and GDP per capita has been measured using the Pearson correlation coefficient. Values of Pearson coefficient show positive moderate correlation between the two variables, ranging from 0.355 to 0.421 (p < 0.01) (Table 5). This means a moderately strong relationship between the regional distribution of health workforce supply (represented by physician density) and economic development (represented by GDP per capita). Thus, considering regions with high levels of GDP per capita as economic core areas, the results suggest that there is a core-periphery pattern in the regional distribution of physicians in the EU. However, note that although the relationship between the two variables seems logical, this connection cannot be considered as deterministic. Furthermore, values of the Pearson coefficient show decreasing correlation, and thus, a weakening relationship between the two variables in the examined period. Therefore, the values of the determination coefficient (which is the square of the Pearson correlation coefficient) also show a downward trend: 16.9% in 2006, and 12.6% in 2018. Thus, the proportion of variance in physician density that is predictable from GDP per capita is less than 20% for both years. Presumably, other factors show significant correlation with physician density.
We also examine the relationship between physician density, and various economic and health indicators. Compared to previous studies (e.g., Aristovnik 2015), our research covers a longer period, and gives an opportunity to analyse the temporal changes of the correlation between indicators. Pearson coefficient values show significant correlations between the variables included in the analysis.
However, the strength of relationships changed over time: the values of the correlation between physician density and human resource in science and technology, and life expectancy weakened between 2006 and 2018. In a slightly different manner, relationship between physician density and ageing index strengthened until 2014 and weakened afterwards. Unlike the other indicators, physician density is inversely correlated with standardised death rate. Furthermore, this relationship shows moderate fluctuations over time (strengthening between 2006 and 2010, weakening from 2010 to 2018) (Table 5).
Regarding health indicators, physician density has a positive moderate correlation with life expectancy, and a negative moderate correlation with standardised death rate. However, recent studies (e.g., Aristovnik 2015) suggest that there is not necessarily a strong correlation between physician supply and health outcomes (e.g., life expectancy, death rates). A possible explanation to this phenomenon is that due to the mobility of health workers, regions adjacent to metropolitan areas might perform better than expected based on their economic
development and physician density (positive spill-over effect). While we do not consider the mobility of patients and physicians, such factors should be considered in the future for the evaluation of results and the formulation of policy recommendations.
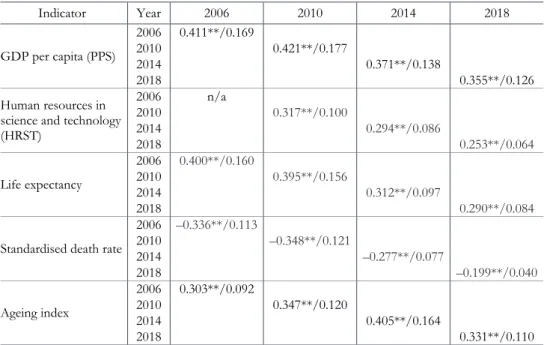
Table 5 Values of Pearson correlation coefficient show the relationship between physician density,* and other economic and health indicators for various years
Indicator Year 2006 2010 2014 2018
GDP per capita (PPS)
2006 0.411**/0.169
2010 0.421**/0.177
2014 0.371**/0.138
2018 0.355**/0.126
Human resources in science and technology (HRST)
2006 n/a
2010 0.317**/0.100
2014 0.294**/0.086
2018 0.253**/0.064
Life expectancy
2006 0.400**/0.160
2010 0.395**/0.156
2014 0.312**/0.097
2018 0.290**/0.084
Standardised death rate
2006 –0.336**/0.113
2010 –0.348**/0.121
2014 –0.277**/0.077
2018 –0.199**/0.040
Ageing index
2006 0.303**/0.092
2010 0.347**/0.120
2014 0.405**/0.164
2018 0.331**/0.110
* Number of doctors per 100 thousand people.
Note: Values for each year should be construed as follows: correlation and determination coefficients/all coefficients are significant at p < 0.01.
Spatial differences within the countries
The weighted averages of physician density increased in most analysed countries between 2006 and 2018. The East Central European countries and Greece had the most significant growth, while similar processes are also observed in the Netherlands and Germany. Various reasons could explain the widening inequalities;
for example, the outmigration of doctors from the East Central European countries had affected the regions differently, and thus, contributed to the growth of intra- country inequalities.
The comparison of the highest and second highest values (Figure 7) within countries provides more or less similar results. In 2018, Czech Republic, Slovakia, Spain, Romania, and Hungary had the largest difference between the first and second regions. Thus, healthcare provision is the most concentrated in these
countries. In most cases, the most important cause of these scores was the outstanding values of capital regions, demonstrating the significance of urban hierarchy. The case of Spain highlights the role of overseas territories as well: these regions increase intra-country regional disparities. The lowest differences between the first two regions can be observed in Bulgaria, Poland, the UK, France, and Italy.
Furthermore, the scores of weighted relative standard deviation show a similar pattern.
Figure 7 The ratio of the physician density of the NUTS 2/NUTS 1 region with the second
highest value to the physician density of the NUTS 2/NUTS 1 region with the highest value (2018), and weighted relative standard deviation of NUTS 2- /NUTS 1-level physician density data (2006, 2010, 2014, 2018) by country
The trend of the weighted relative standard deviations of doctors per 100,000 inhabitants shows a slight decrease within the EU (2006: 27.57, 2018: 27.51).
However, significant differences occur between countries. In the cases of the Czech Republic, Hungary, Romania, Slovakia, and the Netherlands, the weighted relative standard deviation exceeds 30. This shows the great variability in their data. The deviations for Belgium and Greece are between 20 and 30. The remaining countries
Ratio of second highest value to highest value, 2018, % 53.22–68.45
68.46–87.86 87.87–99.45
Weighted relative standard deviation, 2006 Weighted relative standard deviation, 2010 Weighted relative standard deviation, 2014 Weighted relative standard deviation, 2018 Not analysed/no data
49.55 40 30 20 10
show low levels: the values of Spain, Poland, and Germany increase, while other countries have decreasing weighted relative standard deviations.
Figure 8 The ratio of national-level physician density to
EU average physician density by country, 2018
Comparing the differences between the maximum values and averages by countries, Czech Republic, Romania, and Spain have outstanding scores. Belgium, Hungary, Slovakia, and the Netherlands are all characterised by relatively high values as well. However, their scores are considerably lower compared to the first group.
The temporal changes within the countries with highest scores show that Spain had a significant increase; Romania had a significant decrease, while the Czech scores were more or less stable between 2006 and 2018. This shows that there are different development paths beyond the similar scores.
In 2018, 12 countries were above the European average of the number of doctors per 100,000 inhabitants (Figure 8). The numbers decrease in Italy and France, while they increase in others (e.g., Portugal, Romania, Germany).
Meanwhile, due to the growing number of doctors at the European level, some
Ratio of country-level density to EU average, 2018, %
63.15–100.00 100.01–120.00 120.01–137.35
Ratio, country data to EU average, 2006 Ratio, country data to EU average, 2010 Ratio, country data to EU average, 2014 Ratio, country data to EU average, 2018 Not analysed/no data
140.34 100 50
countries experienced an increasing gap between values and the European average.
This shows that the improvements are spatially concentrated within the EU.
Conclusions
Here, we explored the regional patterns and temporal changes of the geographic distribution of physicians in the EU at the NUTS 2 regional level between 2006 and 2018. Furthermore, we compared the levels of concentration and inequality in the geographic distribution of physicians, economic development, and health indicators.
At the beginning of our research, we made two assumptions based on previous studies. First, although the absolute number of physicians in the EU increased over the study period, their regional distribution presumably shows considerable unevenness. Second, there is probably significant relationship between the geographic distribution of physicians, and the regional inequalities in economic development and health outcomes. To test these assumptions, we developed three hypotheses and tested them using the following statistical methods: descriptive statistics, indices of concentration and inequality, and Pearson correlation coefficients.
The first hypothesis is supported by our analysis: the geographic distribution of physicians in the EU shows a core-periphery pattern as more economically developed NUTS regions are better supplied with medical doctors. This is mirrored by the fact that core regions (i.e., where capital cities or other metropolitan areas are located) are overrepresented among NUTS units with high values of physician density, whereas there are no core regions among NUTS units with low physician density. According to the values of indices measuring concentration and inequality (Gini index, HHI, and Dual index), considerable concentration can be observed in the regional distribution of physicians. However, the level of concentration is lower than in the case of GDP. The concentration of physicians is also illustrated by values of significant positive correlation between physician density and various indicators of economic development (GDP per capita, human resources in science and technology, and patent applications). However, and importantly, specialised health care (provided with specialist doctors) is mainly concentrated in hospitals in large cities. We cannot use and test this differentiation due to data limitations. This is a limitation of the interpretation of our results.
The second hypothesis is also supported. This hypothesis suggests that the regional patterns of the geographic distribution of physicians in the EU are durable in time, and the concentration of this health workforce is strengthening in the end.
According to the values of Gini index, HHI, and Dual index, the concentration of physicians increased, although slightly, in the study period.
The third hypothesis is partially supported. This hypothesis suggests that there is positive relationship between the geographic distribution of physicians and that of
health outcomes. Our research was limited by the lack of available data; thus, only two health indicators, life expectancy at birth and standardised death rate, have been included. Physician density shows a positive correlation with life expectancy and negative correlation with standardised death rate. However, values of Pearson coefficient show only low/moderate level of correlation. Furthermore, for both indicators, the correlation with physician density weakened over the examined period. Health outcomes are the results of complex processes. Therefore, future research should consider other factors as well.
Based on the inequality indices, we did not find clear patterns within the EU.
The scores indicate the significance of neighbourhood effect, especially in East Central Europe, where Czech Republic, Slovakia, Hungary, and Romania exhibit similar spatial differences. Germany, Austria, Switzerland, and Italy also exhibit similar tendencies. As the examples of several countries demonstrate, capital regions and overseas territories can increase intra-country regional differences in physician density due to their extreme values.
In conclusion, we show that although the overall supply of physicians working in the EU has increased, their spatial distribution has become more uneven in recent years. This phenomenon may exacerbate regional inequalities in health provision as more economically developed regions are better supplied with health workers than less developed ones. This shortage of health workers might place a heavy burden on residents living in peripheral areas. Thus, our results imply that core-periphery patterns in health provision are becoming more entrenched across the EU, albeit one of the EU’s objectives is to provide every resident with equal access to care.
However, this objective is difficult to achieve due to increasing concentration of health workforce. There is a need for common policies to reduce inequalities in health workforce supply and mitigate the negative impacts of this maldistribution.
Although there are progressive initiatives (e.g., Action Plan for the EU Health Workforce, published in 2012), health provision is still a national prerogative in the EU. Therefore, forms of concerted action, such as intergovernmental coordination or the compensation of regions that are extremely vulnerable to the outmigration of health workers (e.g., most Eastern European countries), should be emphasised more in EU-level policy making.
Acknowledgements
This study is financed by the Hungarian National Research, Development and Innovation Office within the frameworks of research project “Geographical aspects in the migration of the Hungarian health care professionals” (pr. nr.: 124938).
REFERENCES
ANAND, S.–FAN, V. Y.–ZHANG, J.–ZHANG, L.–KE, Y.–DONG, Z.–CHEN, L. C. (2008):
China's human resources for health: quantity, quality, and distribution The Lancet 372 (9651): 1774−1781. https://doi.org/10.1016/S0140-6736(08)61363-X ARISTOVNIK,A. (2015): Regional performance measurement of healthcare systems in the
EU: A nonparametric approach Lex Localis 13 (3): 579−593.
https://doi.org/10.4335/13.3.579-593(2015)
BEN SAID,F. (2021): Recent tendency in Tunisian industrial firms’ location Regional Statistics 11 (2): 81–101. https://doi.org/10.15196/RS110204
BLACK, J. R. M.–BAILEY, C.–PRZEWROCKA, J.–DIJKSTRA, K. K.–SWANTON, C. (2020):
COVID-19: The case for health-care worker screening to prevent hospital transmission The Lancet 395 (10234): 1418−1420.
https://doi.org/10.1016/ S0140-6736(20)30917-X
BRANDMUELLER,T.–SCHÄFER,G.–EKKEHARD,P.–MÜLLER,O.–ANGELOVA-TOSHEVA,V.
(2017): Territorial indicators for policy purposes: NUTS regions and beyond Regional Statistics 7 (1): 078–089. https://doi.org/10.15196/RS07105
BUCHAN,J. (2002): Global nursing shortages. Are often a symptom of wider health system or societal ailments BMJ 324: 751–752.
https://doi.org/10.1136/bmj.324.7340.751
BUCHANAN,J.–WISMAR,M.–GLINOS,I.A.–BREMMER,J. (2014): Health professional mobility in a changing Europe Observatory Studies Series 32. The European Observatory on Health Systems and Policies – World Health Organization, Copenhagen.
CARVALHO,R.D.S.–DINIZ,A.S.–LACERDA,F.M.–MELLO,P.A.D.A. (2012): Gross Domestic Product (GDP) per capita and geographical distribution of ophthalmologists in Brazil Arquivos Brasileiros de Oftalmologia 75 (6): 407–411.
https://doi.org/10.1590/S0004-27492012000600007
CHEN,L.–EVANS,T.–ANAND,S.–BOUFFORD,J.I.–BROWN,H.–CHOWDHURY,M.–CUETO, M.–DARE, L.–DUSSAULT, G.–ELZINGA, G.–FEE, E.–HABTE, D.–
HANVORAVONGCHAI, P.–JACOBS, M.–KUROWSKI, C.–MICHAEL, S.–PABLOS- MENDEZ,A.–SEWANKAMBO,N.–SOLIMANO,G.–STILWELL,B.–DE WAAL,A.–
WIBULPOLPRASERT, S. (2004): Human resources for health: overcoming the crisis The Lancet 364 (9449): 1984–1990.
https://doi.org/10.1016/S0140-6736(04)17482-5
CORREIA, I.–VEIGA, P. (2010): Geographic distribution of physicians in Portugal The European Journal of Health Economics 11 (4): 383−393.
https://doi.org/10.1007/s10198-009-0208-8
DAUGIRDAS,V.–POCIUTE-SEREIKIENE,G. (2018): Depopulation tendencies and territorial development in Lithuania Regional Statistics 8 (2): 46−68.
https://doi.org/10.15196/RS080203
DUDEK, H.–SEDEFOĞLU, G. (2019): Modelling severe material deprivation rates in EU regions using fractional response regression Regional Statistics 9 (2): 130–147.
https://doi.org/10.15196/RS090210
DUSSAULT, G.–FRANCESCHINI, M. C. (2006): Not enough there, too many here:
understanding geographical imbalances in the distribution of the health workforce Human Resources for Health 4 (1): 12.
https://doi.org/10.1186/1478-4491-4-12
EGRI,Z.(2017): Regional health inequalities in the European macroregion from the East Central European perspective Regional Statistics 7 (1): 197–224.
https://doi.org/10.15196/RS0711
EGRI,Z.–KŐSZEGI,I.R. (2018): A gazdasági-társadalmi (komplex) térszerkezet kelet-közép- európai képe Területi Statisztika 58 (1): 27−56.
https://doi.org/10.15196/TS580102
GLORIUS,B. (2018): Migration to Germany: Structures, processes, and discourses Regional Statistics 8 (1): 3−28. https://doi.org/10.15196/RS080101
HANN,M.–GRAVELLE,H.(2004): The maldistribution of general practitioners in England and Wales: 1974–2003. British Journal of General Practice 54 (509): 894−898.
HARA, K.–OTSUBO, T.–KUNISAWA, S.–IMANAKA, Y. (2017): Examining sufficiency and equity in the geographic distribution of physicians in Japan: a longitudinal study BMJ Open 7 (3): e013922. https://doi.org/10.1136/bmjopen-2016-013922 ILLÉS,S. (2018): Gazdasági válság és cirkuláció Területi Statisztika 58 (1): 103−122.
https://doi.org/10.15196/TS580105
KANCHANACHITRA, C.–LINDELOW, M.–JOHNSTON, T.–HANVORAVONGCHAI, P.–
LORENZO,F.M.–HUONG,N.L.–WILOPO,S.–DELA ROA,J.F.(2011): Human resources for health in southeast Asia: shortages, distributional challenges, and international trade in health services The Lancet 377 (9767): 769−781.
https://doi.org/10.1016/S0140-6736(10)62035-1
KARAN, A.–NEGANDHI, H.–NAIR, R.–SHARMA, A.–TIWARI, R.–ZODPEY, S. (2019): Size, composition and distribution of human resource for health in India: new estimates using National Sample Survey and Registry data BMJ Open 9 (4):
e025979. https://doi.org/10.1136/bmjopen-2018-025979
KINCSES, Á.−TÓTH, G. (2020): How coronavirus spread in Europe over time: national probabilities based on migration networks Regional Statistics 10 (2): 228–231.
https://doi.org/10.15196/RS100210
MELIALA, A.–HORT, K.–TRISNANTORO, L. (2013): Addressing the unequal geographic distribution of specialist doctors in Indonesia: The role of the private sector and effectiveness of current regulations Social Science & Medicine 82 (1): 30−34.
https://doi.org/10.1016/j.socscimed.2013.01.029
[OECD/EC] Organisation of Economic Co-operation and Development/European Commission (2018): Health at a Glance: Europe 2018. State of Health in the EU Cycle OECD Publishing, Paris.
[OECD] Organisation of Economic Co-operation and Development (2017): Health at a Glance 2017: OECD Indicators. OECD Publishing, Paris.
ONO, T.–SCHOENSTEIN, M.–BUCHAN, J. (2014): Geographic Imbalances in Doctor Supply and Policy Responses OECD Health Working Papers 69, OECD Publishing.
PAVOLINI, E.–KUHLMANN, E. (2016): Health workforce development in the European Union: A matrix for comparing trajectories of change in the professions Health Policy 120 (6): 654−664. https://doi.org/10.1016/j.healthpol.2016.03.002 SCHEFFLER, R. M.–CAMPBELL, J.–COMETTO, G.–MAEDA, A.–LIU, J.–BRUCKNER, T. A.–
ARNOLD,D.R.–EVANS,T. (2018): Forecasting imbalances in the global health labor market and devising policy responses Human Resources for Health 16 (5).
https://doi.org/10.1186/s12960-017-0264-6
SHIMAMOTO, K. (2019): Empirical analysis of the distribution of urban parks in Japan Regional Statistics 9 (2): 148–172. https://doi.org/10.15196/RS090203
SIYAM, A.–DAL POZ,M.R. (2014): Migration of health workers. WHO Code of Practice and the global economic crisis World Health Organization, Geneva.
TAGAI, G.–BERNARD, J.–ŠIMON, M.–KOÓS, B. (2018): Two faces of peripherality: labour markets, poverty, and population dynamics in Hungary and Czechia Regional Statistics 8 (2): 19−45. https://doi.org/10.15196/RS080204
TANIHARA,S.–KOBAYASHI, Y.–UNE,H.–KAWACHI, I. (2011): Urbanization and physician maldistribution: a longitudinal study in Japan BMC Health Services Research 11 (1):
260. https://doi.org/10.1186/1472-6963-11-260
UZZOLI, A. (2016): Health inequalities regarding territorial differences in Hungary by discussing life expectancy Regional Statistics 6 (1): 139−163.
https://doi.org/10.15196/RS06108
[WHO] WORLD HEALTH ORGANIZATION (2006): Working Together for Health. The World Health Report 2006 World Health Organization, Geneva.
WINKELMANN, J.–MUENCH, U.–MAIER, C. B. (2020): Time Trends in the Regional Distribution of Physicians, Nurses and Midwives in Europe BMC Health Services Research 20: 937. https://doi.org/10.21203/rs.3.rs-42104/v1
WITTER, S.–HAMZA, M.M.–ALAZEMI, N.–ALLUHIDAN, M.–ALGHAITH, T.–HERBST, C.
(2020): Human resources for health interventions in high- and middle-income countries: findings of an evidence review Human Resources for Health 18 (43): 17.
https://doi.org/10.1186/S12960-020-00484-W
ZUK, P.–ZUK, P.–LISIEWICZ-JAKUBASZKO, J. (2019): Labour migration of doctors and nurses and the impact on the quality of health care in Eastern European countries: The case of Poland The Economic and Labour Relations Review 30 (2):
307–320. https://doi.org/10.1177/1035304619847335
INTERNET SOURCES
[1] http://www.who.int/disabilities/care/matrix.docx (downloaded: 19 October 2020) [2] [WHO] WORLD HEALTH ORGANIZATION (2016): Health workforce and services. Draft global
strategy on human resources for health: workforce 2030
https://apps.who.int/gb/ebwha/pdf_files/WHA69/A69_38-en.pdf (downloaded: 12 October 2020).