Internationalisation (Transnationalisation) of the Enterprise Sector
*Working paper
Authors Baranyi, Márton
Endrődi-Kovács, Viktória Miklós, Gábor
Nagy, Sándor Gyula Ph.D.
Palánkai, Tibor, professor emeritus Summary
As part of a wider research program we analysed the theoretical framework and the recent developments of the process of internationalisation (transnationalisation) of the small- and medium- sized enterprises generally in the European Union and with a specific view on Hungary and Spain. We tried to highlight the trends and barriers of internationalisation. We carried out document analyses, interviews, analyses of statistical databases and an own data collection with online survey.
Keywords: internationalisation, SME, competitiveness JEL: F15, F29,
If cite this paper please use: Nagy-Palánkai-Miklós-Endrődi-Baranyi (2011): Internationalisation (Transnationalisation) of the Enterprise Sector. Working Paper, Corvinus University of Budapest
* The study was supported by European Union and the Hungarian Government (project nr. TÁMOP4.2.1B-09/1KMR-2010- 2010-005). It is the result of the research activities in the subproject “The international economic processes and the competitiveness of domestic business.
Content
CONTENT ... 2
INTRODUCTION ... 3
1. THEORIES OF INTERNATIONALISATION ... 4
1.1.INTERNATIONALISATION –INTEGRATION -TRANSNATIONAL COMPANIES... 4
1.2.PROCESS OF INTERNATIONALISATION -EUROPEAN INTEGRATION ... 5
1.3.INTERNATIONALISATION – TRANSNATIONAL COMPANY NETWORK ... 11
1.4.THEORIES ON FACTORS AND MODELS OF INTERNATIONALIZATION OF COMPANY SECTOR ... 13
2. STATE OF INTERNATIONALIZATION EUROPEAN SMES BY THE EARLY 2000S ... 17
2.1.THE EUROPEAN SITUATION GENERALLY ... 17
2.2.THE RESULTS OF THE COMMISSION REPORT ... 18
3. CHARACTERISTICS OF INTERNATIONALIZATION OF THE HUNGARIAN SME SECTOR ... 20
3.1.TRENDS IN INTERNATIONALISATION OF HUNGARIAN SME SECTOR ... 20
3.2.ROLE OF PROPERTY RELATIONS AND SIZE OF ENTERPRISES IN THE INTERNATIONALIZATION ... 22
3.3.MOTIVATION AND DESTINATION OF TRADE AND INVESTMENTS ... 24
3.4.PERFORMANCE OF HUNGARIAN SME SECTOR BETWEEN 2000 AND 2009(IN NUMBERS) ... 27
3.5INTERNATIONALIZATION OF HUNGARIAN SMES (RESULT OF AN ONLINE SURVEY) ... 37
4. THE INTERNATIONALIZATION OF THE SPANISH SME SECTOR ... 43
4.1THE PROCESS AND STATE OF INTERNATIONALIZATION OF SPANISH ECONOMY ... 43
4.2.BARRIERS OF INTERNATIONALISATION ... 49
4.3.SOME BEST PRACTICES ... 51
4.4THE POSSIBLE STATE SUPPORTS AND SERVICES TO HELP THE PROCESS OF INTERNATIONALISATION OF SMES ... 54
SUMMARY CONCLUSIONS ... 57
NOTES OF TABLES AND CHARTS ... 58
REFERENCES ... 59
Introduction
The emerging global integration in the last decades was marked by rapid and intensive internationalization of company sectors. The main product of this process was the appearance of Transnational Companies (TNCs). Their first emergence can be put for the 1960s years, but we can experience their rapid and substantial expansion mainly from the 1970s years.
In the present global economy, the transnational company with its internal and external cooperation and business relations is such a modern production and entrepreneur organisation, which closely follows from the technological and social challenges of our age, and strives for global optimalisation of its resources and activities. The global company* structures organically emerged from the cooperation of developed economies, while their role and relations to other regions (developing countries) was exogenous and contradictory for a long time. Several forms and structures of international companies had existed before, but TNCs could be considered as new phenomenon, as totally new entities. Now, they have growingly become global (appearance of TNCs of emerging countries).
We define transnational companies in a broad and general sense, the multinational or
„international concerns” are considered as their special forms. There are contradictory and varying definitions of TNCs, but according to some UN terminologies, those companies can be considered
„transnational”, which with more than 25% of their activity (production, capital, turn over or employment) abroad operate in more than one country. The transnationality extends to production activities, ownership relations and management. Besides transnationality, the existence of global business strategy, central decision making and economic power (market influence and size) are often stressed.
The TNC integrates and optimizes its activities on global scale. Their novelty lies in all of these features.
* Transnational company is a syntetic term, officially used by international organisations (UN). Multinational company is a sub-cathegory of TNCs with multinational ownership, while „nationalally” owned companies can be TNCs if they operate abroad. „Global” companies are rather jounalistic refferences to TNCs. „International”
companies existed since long time, as many companies had branches or investments abroad already from 19th century. TNCs optimise their activities in global dimensions. That is new, which applies only for the last 50 years of world economy.
1. Theories of Internationalisation
1.1. Internationalisation – Integration - Transnational Companies
According to estimates TNCs give about 20 to 30% of global GDP, and about 70% of international trade is related to them in some way or other. They control about 80% of global technology trade, and about 90% of technology transfers are realised inside the TNCs. The R&D capacities of developed countries are concentrated overwhelmingly to TNCs, the extra profits from innovation and technological reconstructions have been realised primarily by TNCs. The ICR greatly contributed to global allocation of resources and maximalisation of efficiency on global scale. On their basis, the global company infrastructures and method of organisation of production and business have been developed and broadly extended.
Primarily, the globally organised and manoeuvring companies are able the minimize expenditures and utilize resources and production factors. The TNCs are the main actors, who are able maximally exploit the advantages of global division of labour, and the world market prices are on a large extent based on expenditures of their globally organised and optimised production.
The TNCs are characterised by great mobility and flexibility. They easily and rapidly can transfer capacities and production from one country to another, especially when the technology is easily removable, the fix expenditures are limited, and the trained labour is available. The main producers usually are followed by their suppliers, but TNCs often tend to rely on local partners. These background industries (local SMEs) may play important role in the economic development of a country.
The TNCs are often connected with oligopolistic behaviours. Inside the companies the so called transfer prices are broadly applied, which helps the hidden and illegal transfer and redistribution of incomes, and tax evasion. This way the advantages of global division of labour are distributed inside the companies, while for the outsiders, high monopolistic type of prices (on components or services) are charged. That can put the partners outside the transnational company spheres in competition at disadvantage.
The expansion of transnational company division of labour have greatly contributed to globalisation of national markets. The opening of national economies in the last decades was a large extent realised by TNCs. In the developed countries, the impacts of growing import competition are directly felt on the domestic markets. According to estimates, in USA, greater part of industrial products faces global competition even on local markets.
“The spread of the capitalist mode of production and free trade following the World War II led to the development of a complex and highly integrated world economy in which international trade and investments flows occur on a massive scale at increasingly rapid rates. International economic structures based on finance and trade have led to increasing interdependence and closer ties between countries. An important part of this process is associated with the growth of transnational production, with the increasing ability of firms to locate parts of their production overseas, while still maintaining direct control over the activities of foreign subsidiaries. This move by many enterprises to spread their activities into other countries has bolstered the globalization process, broadening the links between countries.” (O’Brien et al., 2007: 184).
From points of view of global integration, and transnationalisation the spectacularly rapid expansion and growing internationalisation of capital markets from the 1980s should be particularly stressed. The liberalization and deregulation of capital markets played an important role, which was accompanied by the new communication and information technologies (round the clock stock exchanges). The globalization of financial relations showed extraordinary expansion, particularly in comparison to real economy. The process in Europe was accelerated by the single market and the introduction of the Euro.
1.2. Process of Internationalisation - European integration
In the last more than 50 years we can experience a very rapid and intensive internationalisation of European economies. The EU members reached high level of integration of their economies, which had broad impacts on economic development, mutual cooperation and structure of the economies of member states. This can be measured both in terms of trade, and flows of factors of production.
In the last 50 years the trade among the members grew very dynamically, in fact on the long run, about one and half times more rapidly than their GDP. As result, the economy of the member states
have become strongly internationalised, and achieved a high level of interdependence. In fact, we can state that this lead to a very dynamic and high level of integration.
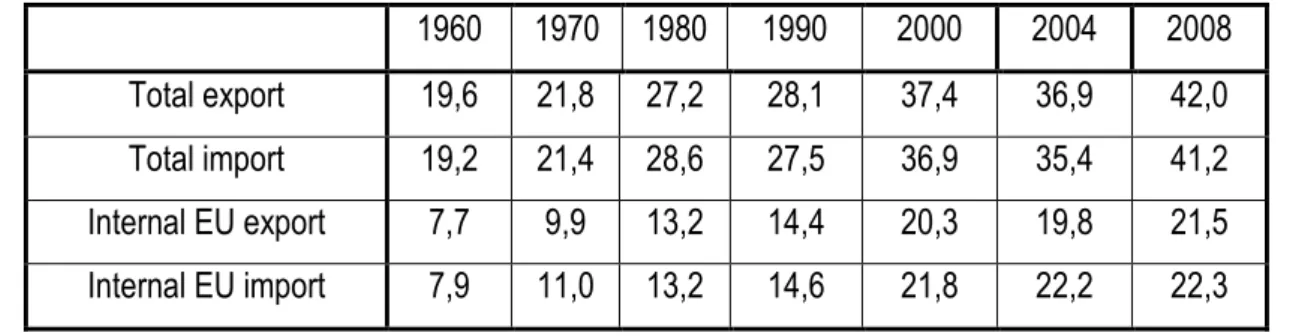
1. table Trade flows of goods and services (in %of GDP %, EU15)
1960 1970 1980 1990 2000 2004 2008
Total export 19,6 21,8 27,2 28,1 37,4 36,9 42,0
Total import 19,2 21,4 28,6 27,5 36,9 35,4 41,2
Internal EU export 7,7 9,9 13,2 14,4 20,3 19,8 21,5 Internal EU import 7,9 11,0 13,2 14,6 21,8 22,2 22,3 Sources: European Commission: 2001 Broad Economic Policy Guidelines. Europe in Figures, Eurostat Yearbook 2009. Eurostat. 2010.
The data show that the EU economies are characterised by relatively high levels of external dependence, which in the last half of the century more than doubled (it grew from about 20% in 1960, to 42% in 2008).
Even greater dynamism characterise the growth of internal trade among the EU members.
Between 1960 and 2008, the share of internal export and import of goods and services almost tripled (it increased from 8% to 22 of GDP), which resulted in a high level of interdependence among the EU members. If we accept the 10% as a minimum dependence threshold, then the practically by the early 1970s they overstepped the threshold of interdependence, and by the 2000s years they produced double of this level. That reflects a high level of real integration among the EU members.
The interdependence was strengthened by technological and production cooperation, and high level of infrastructure of integration was built up (transport, communication, financial services etc.). On the basis of intensive internationalisation and transnationalisation of company sector, the strong foundations of integration were created, the process have become irreversible. Under these circumstances, the quitting the integration process would mean such high costs, which would be unacceptable for any partners, and therefore, it is not a relevant alternative. At the high intensity of integration that applies equally to euro-zone membership as well.
Of course, there are great differences among the countries, which depend on several factors.
Among them, the size of the country, its level of development, and structural openness of economy should be particularly stressed.
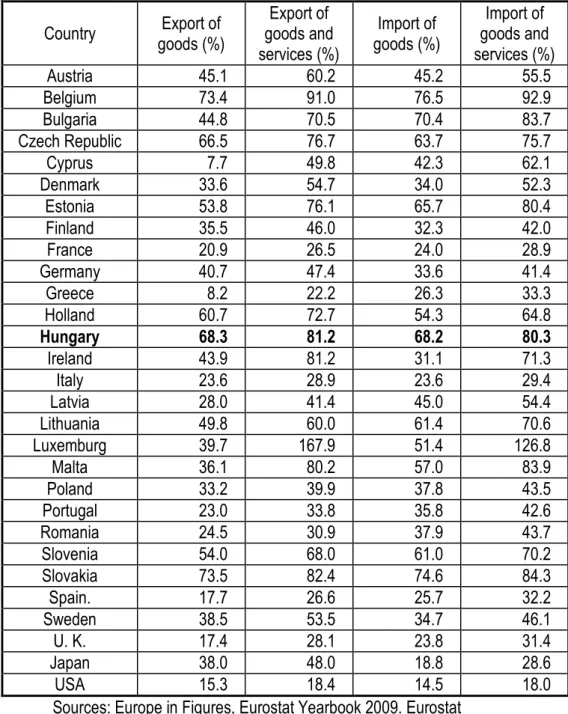
2. table Share of trade of goods and services in GDP in 2008 (%)
Country Export of goods (%)
Export of goods and services (%)
Import of goods (%)
Import of goods and services (%)
Austria 45.1 60.2 45.2 55.5
Belgium 73.4 91.0 76.5 92.9
Bulgaria 44.8 70.5 70.4 83.7
Czech Republic 66.5 76.7 63.7 75.7
Cyprus 7.7 49.8 42.3 62.1
Denmark 33.6 54.7 34.0 52.3
Estonia 53.8 76.1 65.7 80.4
Finland 35.5 46.0 32.3 42.0
France 20.9 26.5 24.0 28.9
Germany 40.7 47.4 33.6 41.4
Greece 8.2 22.2 26.3 33.3
Holland 60.7 72.7 54.3 64.8
Hungary 68.3 81.2 68.2 80.3
Ireland 43.9 81.2 31.1 71.3
Italy 23.6 28.9 23.6 29.4
Latvia 28.0 41.4 45.0 54.4
Lithuania 49.8 60.0 61.4 70.6
Luxemburg 39.7 167.9 51.4 126.8
Malta 36.1 80.2 57.0 83.9
Poland 33.2 39.9 37.8 43.5
Portugal 23.0 33.8 35.8 42.6
Romania 24.5 30.9 37.9 43.7
Slovenia 54.0 68.0 61.0 70.2
Slovakia 73.5 82.4 74.6 84.3
Spain. 17.7 26.6 25.7 32.2
Sweden 38.5 53.5 34.7 46.1
U. K. 17.4 28.1 23.8 31.4
Japan 38.0 48.0 18.8 28.6
USA 15.3 18.4 14.5 18.0
Sources: Europe in Figures, Eurostat Yearbook 2009. Eurostat
After 1990, the Hungarian economy reached a particularly high level of internationalisation and integration. With more than 68% of trade of goods in GDP, the external dependence of Hungary is extremely high, and in this respect, she is third after Belgium and Slovakia. The proportions are similar in terms of import. At the other extreme, the shares of Cyprus (7.7%) and Greece (8.2%) are even bellow the magic 10%. With about 12-13% of export and import of services in GDP, Hungary is close the EU average.
In spite of liberalization of movements of production factors, historically the integration processes in the company sector was slow and contradictory in the first decade of EEC. The integration concentrated to trade relations, while till early 1970s the capital fusions or joint enterprises were only sporadic, and company relations were limited only loose production cooperation.
The structural crisis from early 1970s forced the companies to increased technological and structural adjustment, and the improved efficiency and management became a requirement. On the long run, the constraints for integration were strengthened, and the companies growingly exploited the integration as a source of cutting costs and increasing efficiency.
From the 1970s, the growing internationalization (transnationalisation) of company sectors was one of the most important developments of European integration. By the 1980s, as result of re- arrangement of production and capital relations, the former one way character of transnationalisation process (expansion of American companies into Western-Europe) changed, and it become growingly global. The big European companies took also global strategies and expansion, and they were joined by the Japanese, who also became actively participants of global and regional integration processes. It was an important new development, that from the 1970s-1980s, the relative isolation of American economy, among others due to rapidly growing European and Japanese investments came to end, and the internal American economy have become part of global competition and cooperation, or put it otherwise, that of global integration. The so called newly industrialised countries, particularly from Asia, actively joined the global integration processes.
By the years of 2000s, the transnationalisation of European reached a high level, and the European TNCs become active participants of global integration. The EU gives about 20% of world production, but its role in globalization is much greater. “In our days, more than half of the transnational companies of the world have European headquarters. One third of the largest firms of the world are from the Union. The globalization of companies has two dimensions. On the one hand, they extend their activities through expansion of their foreign investments, buying up companies or in form of green field investments. On the other hand, they cooperate or merger with other transnational firms. These giant companies have their own representation of interests (Round table of European Industrialists) and they are able to influence the institutions of the EU. The European direct investments were boosted particularly after 1992, due to creation of the European single market, the increased global competition, and opening of the East-European markets.” (Zádor, 2001:115).
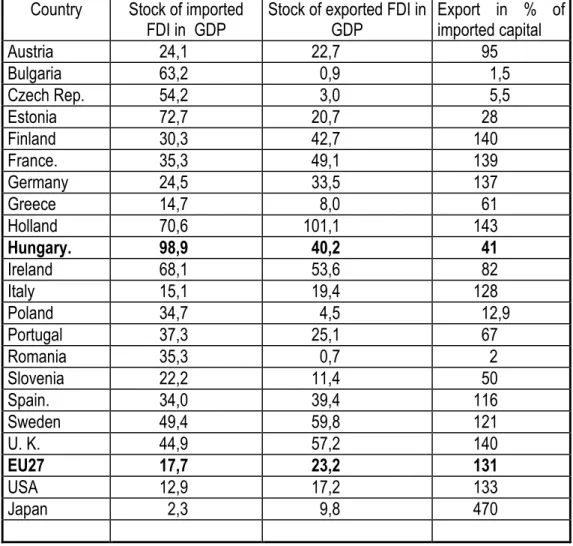
3. table Stock of FDI in GDP in 2007, relation of stock of exported and imported capital in the European Union
Country Stock of imported FDI in GDP
Stock of exported FDI in GDP
Export in % of imported capital
Austria 24,1 22,7 95
Bulgaria 63,2 0,9 1,5
Czech Rep. 54,2 3,0 5,5
Estonia 72,7 20,7 28
Finland 30,3 42,7 140
France. 35,3 49,1 139
Germany 24,5 33,5 137
Greece 14,7 8,0 61
Holland 70,6 101,1 143
Hungary. 98,9 40,2 41
Ireland 68,1 53,6 82
Italy 15,1 19,4 128
Poland 34,7 4,5 12,9
Portugal 37,3 25,1 67
Romania 35,3 0,7 2
Slovenia 22,2 11,4 50
Spain. 34,0 39,4 116
Sweden 49,4 59,8 121
U. K. 44,9 57,2 140
EU27 17,7 23,2 131
USA 12,9 17,2 133
Japan 2,3 9,8 470
Sources: Eurostat Yearbook 2009. Eurostat. European Commission.
The intensity of integration can be measured by the flows of factors of productions, particularly that of capital and labour. In fact, both the flow and the stock data are important. The capital export (Cx) and capital import (Cm) refers to dynamics of integration, while the stock indices, which can be expressed in GDP (Cx/GDPX100) and Cm/GDPX100), signal the intensity of integration in a given moment.
The high shares of FDIs in the GDPs indicate the strong intensity of integration processes. At the same time, it is striking that there are substantial differences among the EU member countries. This signals differences in intensity of their integration, but other factors play also important role. It is obvious that the size, structure and level of development of the country may substantially influence the proportions, but such factors as geographical position, historical and cultural traditions and not at last the social and political factors have to be taken into account. The proportions of FDIs to GDP as relation
to size and level of development of the country are in the band of 30-50%, but the EU average is only around 20%. Some countries, like Hungary, Estonia, Ireland or Netherlands are characterised by extremely high proportions, which may express the traditional capital exporter role (Netherlands), or the high capacity for attraction of foreign direct investments (new members). The proportions of Greece, Italy and Slovenia are deeply bellow average, but again the reasons behind are different. In case of Greece, it refers to the low level of intensity of its integration, while in case of Slovenia the economic policy factors are the explanations. It is also striking, that Japan intensively joined the internationalisation-transnationalisation processes from the 1980s, but its capital flows kept its one-way character.
The internationalisation process is characterised by strong capital interconnections. The mutual investments, the export and import of capital are one of the main indicators of global integration, and its positive balance
The relation of capital export to import (Cx/CmX100) is one of the important indicators of interdependence and intensity of integration. It closely correlates with the level of development of the region or the country. In a country, the share of foreign investments can be very high, and it can indicate the intensive participation in global or regional integration. But if the country has no or minimal capital export, then it is expression of one sided dependencies, and it signals the asymmetries of its integration.
The highly developed countries are characterized not only by high shares of foreign investments in GDP, but also by their positive balances. In the majority of OECD countries the capital export exceeds the capital import by roughly 30-40%. Besides substantial mutual capital turnover, the developed countries of the EU are characterized also by net foreign capital investment positions. The dynamics of this change is therefore, good indicator also the process of integration and level of development. In this respect, Spain produced a remarkable development, in the last 15-20 years they have become important capital exporters.
Spain now is one of the main capital exporters to Latin-America, which indicates its global orientation. From the old members only few are net capital importer, but their position may be substantially different. Ireland has high intensity (FDI in GDP), while the balanced position of Austria is accompanied by a lower intensity.
The Greek and Portuguese positions are similar, but with very different intensities.
In the last few years, the capital export of the new members also started. Slovenia, Hungary and Estonia are the pioneers in the process. It is remarkable development from points of view of their integration. (The Hungarian data seem to be exaggerated, according the Hungarian statistics, the direct capital export of the country in 2009 was around €15bn, which is only 20% of the registered capital import.) In the other new members the capital export just started, and it signals the still existing asymmetries of their integration. “The capital export is closely related to the level of development, and in
case of an expanding economy its increase is inevitable. At the same time, there is no rule, that to a given level of development how large capital export is needed. Therefore, in an absolute way, it is impossible to decide, that Hungary is ahead or behind to the “normal”. This is also influenced by level of development of geographically near countries, and its capacity to attract capital.” (Világgazdaság, 2004.
június 30.)
1.3. Internationalisation – transnational company network
The global production and business form a complex system, in which besides the big TNCs the cooperating and contracting SMEs, banks and other service companies play an important role. That is why now days we must rather speak about transnational company structures or networks. “Today, the globalization of production is organised in a large measure by MNCs. Their pre-eminence in world output, trade, investment and technology transfer is unprecedented. Even when MNCS have a clear national base, their interest is in global profitability above all. MNCs have grown from national firms to global concerns using international investment to exploit their competitive advantages. Increasingly, however, they are using joint ventures and strategic alliances to develop and exploit those advantages and to share the costs of technological innovation. But the growing globalization of production is not limited to MNC activity, for over the last decades there has been a significant growth in producer-driven and buyer-driven global production and distribution networks. The globalization of business is thus no longer confined to the MNCs but also embraces SMEs.” (Held, 2005: 282). As the development of the last period shows, these networks have been growingly institutionalised and taken legal forms. „While there has been a significant expansion of transnational production in the last three decades it has also become more institutionalized as strategic alliances, subcontracting, joint ventures and other forms of contractual arrangements regularize interfirm networks.” (Held, 2005: 274).
The emergence of transnational networks shows contradictory development in the EU. In most countries, the big foreign companies built up complex cooperation networks with national small and medium companies. These SMEs can be daughter companies, but often they are connected to one or more big companies as contractual partners, service providers or suppliers. The other part of the SME sector claims a transnational company status on its own rights. These SMEs comply with the requirement of a TNC (minimum 25% of its activity is in more than one country), and they not only conduct foreign trade, but they have foreign investments, they conclude production, research and service contracts with foreign partners, and in their business strategies they follow the pattern of the large TNCs.
In our analysis, we consider the transnational networking one of the most important characteristics and indicator of internationalisation and integration. It has particular importance from points of view of balancedness and quality of integration. As the SMEs are organic parts of transnational networks, their position and success greatly influence the development of integration processes.
The main deficit of European integration is that the internationalisation of SME sector in the EU is far not satisfactory, and it is far bellow the potentials and the necessities. According to the Observatory of European SMEs, only 8% of total EU27 SMEs are involved in export, only 12% of the input of an average SME are purchased abroad and 5% of SMEs in the EU receive some income from foreign business partnerships either from subsidiaries or joint ventures abroad.
The picture is more positive and encouraging in the developed countries of the EU. There are many SMEs, which not only contract with big TNCs, but follow transnational company strategies, invest abroad, and have direct and permanent foreign partners. According to a German surveys (Going International 2007), the average German medium sized company has business relation with 16 countries. 72% of the questioned have partners in the new member countries, but this proportion is 63%
for Asia and 53% for North-America. (Világgazdaság, 28 November 2007, 6. o)
The internationalisation of SME sector is considered as a crucial factor both points of view of increasing competitiveness of their own, and also for their country. “The SMEs are likely to benefit disproportionately from pro-competitive effects of internationalisation: internationalisation provides the SME with both growth and increased competitiveness, and is thus a fundamental engine for its long term sustainability.” EU Commission, 2007: 17) In the EU the internal market and the euro can play a role. “The internal market has the potential to be a main engine for SME growth. It can allow them to face international competition better, both at home and abroad.” (ibid. 30)
In the new members and consequently in Hungary, the weakness of local supply to big foreign investors is still generally characteristic. The foreign investors bring their traditional suppliers, and limit their local activity mostly to assembling. For a local SME, it is very difficult to gain a supplier status. The main reason is that difficult to meet the high technological and quality standards, but the insistence and devotion to traditional partners also play a role. The local supply to foreign production is often minimal, but it generally hardly exceeds the 20-30%. It is even rarer that a SME can gain exporter status, supplying to a production base in abroad.
In Hungary, still there are only few SMEs, who venture for foreign business. In 2005, in case of locally owned companies, their export was only 10% of their net turnover. In 2007, only 19,4% of export revenues came from Hungarian SMEs. „Most of the Hungarian small firms, including many „gazelles”,
have no export, but many have to confront with the fact, that their domestic markets have been tightened by import competition.” * (Papanek: 2010:359) The asymmetries of integration of new members is reflected in the weaknesses of their participation in the transnational networks.
In many respects, Hungary is characterised by high intensity of its global and European integration, but as far as the participation of its SME sector in integration processes is concerned, it is seriously lagging behind. That is a serious distortion, and it reduces the quality of its integration. It should be stressed also that even most of the “local” companies are parts (often suffering) of that interdependence, as a part of their inputs comes from foreign TNCs, or they have to face foreign competition often in direct ways (small shops contra chains of large supermarkets).
In the last 20 years, the Hungarian economy has become organic part of transnationalisation processes. At the same time, this process is still largely one sided, and it only started to change. In this respect, Hungary is somewhat before the other countries of the region. The process is accompanied by the transnationalisation of local company structures (in Hungary, MOL and OTP Bank, Trigranit, Matáv or Fornetti), but one can mention only few SMEs among them (Lipóti Pékség). The expansion of Hungarian „transnationals” concentrates mostly to the neighbouring Central European countries. As it is stressed by the Commission study on the issue relating to SMEs: “a pro-active attitude to global competition and markets is increasingly becoming not a choice but matter of necessity.” (EU Commission, 2007: 7).
1.4. Theories on Factors and Models of Internationalization of Company Sector
There are several factors, which influence the process and efficiency of internationalization, when they invest abroad and decide about their operation or business strategies. While they follow, usually, a general strategy and policy, when they turn to international markets, their attitude and finally their success depend on different external and internal factors, both in micro- and macro-economic, social and political circumstances.
1. Effects of technology and innovation. The innovation is one of the main factors of business success on international market, and maximalisation (optimalisation) of company profits. According to
* In the international literature, „gazelles” are the rapidly growing small firms.
“innovation theory” the internationalization is similar when a new product appears in the market. In this process Leonidou and Katsikeas separate three periods:
1. Before the internationalization: The enterprise doesn’t export, it only produces for the domestic market or aims at satisfing the domestic demand.
2. Beginning period: the enterprise exports but it is ad hoc, and the foreign investment is a planned activity in the future.
3. Developed period: It means permanent presence in foreign markets, and it is able to export as well as to invest capital into foreign possibilities. (Leonidou – Katsikeas, 1996.)
In general, the innovation is the introduction of “something new”, be it a new technology, a new internal structure, new marketing procedures. (Annamária Inzelt, research director at Pénzügykutató Zrt).
The presence of multinational companies may facilitate and promote the spread of R&D among the SME sector, due to the fact that a simple cooperation (let alone R&D cooperation) between an international company and a SME can be mutually beneficial for both parties.
Innovative SMEs are much more likely to be successful on foreign markets contrary to those entrepreneurships that are lacking innovation. However, it has to be emphasised that innovation is a risky activity, which particularly apply to its financing. So in light of this, innovation not only presumes an entrepreneur attitude, but a financing one as well. Financing is the key to success in most of the cases, when venturing in innovation. This explains why the EU funds gained importance in the last few years in terms of innovation; however, tendering EU funds is usually time consuming and labour intensive.
Many entrepreneurs see that the necessary bureaucratic work required for the tenders is not worth the effort. (See: A hazai kis- és középvállalkozások esélyei a nemzetköziesedő tudásgazdaságok korában)
As A. Inselt claims, for the internationalisation of the SME sector, new markets, knowledge, and new technology can be considered as the most important necessities in order to be successful.
Moreover, highly qualified professionals are also inevitable, whereas cooperation among the small enterprises would also be beneficial. It must be clearly seen that the Hungarian SMEs are not in the same position in terms of competitiveness as other players, so the Hungarian SME sector should primarily focus on those areas, where the investment-demand is relatively low.
Both innovative and non-innovative entrepreneurships find competitiveness and information the two most important factors in terms of their internationalisation. The innovative organisations are motivated by internationalisation in order to obtain new knowledge, new technology and gain new markets. The non-innovative entrepreneurships aim for internationalisation in order to obtain qualified professionals and to reduce transactional costs.
2.. “Psychical Distance”. According to “psychical distance” theories, the enterprise expanded firstly in the neighbouring countries. It was particularly true to countries, where significant national minority of the mother country of the enterprise lives (it can apply also before the evolution of the free trade areas/zones or custom unions). It means that small and medium enterprises of a given country want to expand, primarily to those countries which are very similar considering the cultural features (Szerb – Márkus, 2008, p.43).
Of course, the internationalization is based primarily on economic factors and processes. These macro and micro aspects cancel the idea of the size of enterprises and use the so called OLI-paradigm by Dunning:
1. ownership advantages 2. locational advantages
3. internationalization advantages (Dunning, 1993).
Similarly to other countries, the Hungarian corporate sector is not homogeneous. The companies’
size, activity, aims, ownerships are very different; and firms have different motivations when they make investments abroad. Based on the motivation of investment John Dunning distinguished four types of foreign direct investments: 1) resource seeking investments, which are made in order to access to some basic resource or input; 2) market seeking investments, which are made in order to access or enter to a new market; 3) efficiency seeking investments with which companies can increase their efficiency (generally with reducing their costs) and 4) strategic seeking investments, with which companies gain competitive advantages against their competitors (Dunning. 1993).
3. The “Born Global”. The so called „Born Global” theory can show some similar features with the previous ones. The “evolutionary learning” and “innovation theory” may interconnect, because the evolution periods can be jumped over as the companies appear in the international market already at their foundation (Sass, 2010, p.12). As result, building up strategies for domestic and external markets overlap, and usually they have their own crucial innovation capacity to be able to participate and be successful in the process of internationalization during (very) short time. They generally work in the high-tech sector or in the pharmaceutical industry (Morgan – Thomas, Jones, 2009).
4. The Uppsala-model. According to this theory (basis of Johanson–Vahlne, 1977) the firms internationalise slowly in different steps and the most important feature of the model is the path
dependency. The first step is to export to overseas market(s) through independent channels (e.g. sales agents). In the second step companies establish sales outlet in overseas market(s) (by acquiring local firm or by setting up new facility). The third step is to license foreign manufacturer to produce for overseas market(s). In the fourth step firms establish production facility overseas by acquiring local firm or by setting up new facility. To set up a new facility is more risky and more expensive. According to this approach the reasons of internationalisation can be divided in two groups: domestic push factors as e.g.
openness, not sufficient (not large) size of country and international pull factors as e.g. huge and open foreign markets. This theory was born and was popular in the 1970s, the mentioned authors examined the internationalisation of Swedish companies. Their main conclusion was, that the internationalisation of companies is slow; and happens in little steps. The theory could be criticized from several viewpoints;
for example the order of steps can be reversed or one/few step/steps can be skipped. Moreover, the model examined primarily the internationalisation of Swedish companies and in the 1970, when getting suitable information from foreign markets was more difficult, problematic, time-consuming and risky than nowadays.
Generally, in the case of several Hungarian enterprises we can observe the steps of the Uppsala theory. The first step of internationalisation is to open sales agencies abroad (in most cases this already have happened in the 1970s and 1980s). This facilitates to gather information about the foreign market and makes to realise market expectation easier. The next step is to establish commercial, then production facilities. The pharmaceutical factories, companies are good examples to the Uppsala theory (Antalóczy-Éltető, 2002)
2. State of internationalization European SMEs by the early 2000s
The European Commission published a report in 2010, which goal was to provide an updated and comprehensive overview of the level of internationalisation of European SMEs and derive conclusions and recommendations from it. According to the Commission internationalisation means not only exports or foreign direct investments but all activities that put small and medium size enterprises into a meaningful business relationship with a foreign partner. So it refers to exports, imports, foreign direct investments, international subcontracting and international technical co-operation as well. The data, conclusions and recommendations are based on a survey of 9480 SMEs in 33* European countries during Spring 2009 (European Commission, 2010).
2.1. The European situation generally
The report states that a considerable number of European SMEs are internationalised, but generally their international activities realise in the Internal Market. So partner markets are mostly other EU countries, but in the field of import, China’s role is very important. The European SMEs are more internationalised than Japanese or American companies (which are not surprising, because of the relevant role of Internal Market). Moreover, the two most common modes of internationalisation are exports and imports. For example, within the EU 27, 25% of SMEs export, of which about 50% goes beyond the Internal Market. Similarly, within the EU27, 29% of SMEs import, of which 50% originate from countries outside the Internal Market. In addition, 7% of member states’ SMEs are involved in technological co-operation with a foreign partner, 7% are a subcontractor, 7% have foreign subcontractor and 2% are active in foreign direct investment. The Commission claimed that there is a direct link between the level of internationalisation and the size of company, so a larger company tends more to internationalise. For example, in terms of exports, 24% of micro, 38% of small and 53% of medium-sized SMEs are active on foreign markets (for imports these percentages are 28-39-55).
Moreover, there is a correlation between the size of country and internationalisation: generally, the
* The survey examined the 27 member states of EU and 6 non-EU countries: Croatia, Iceland, Liechtenstein, the Former Yugoslav Republic of Macedonia, Norway and Turkey.
smaller countries’ SMEs are more internationalised. Furthermore, trade, manufacturing, transport, communication and research are the most internationalised sectors; exporting and importing activities augment in intensity by the age of companies (e.g. every third company exports that have existed for 25 years or more). In addition, most often SMEs start international activities by importing, and if SMEs both import and export, they start with import twice as often as starting with export (39% vs. 18%). 42% of enterprises started with imports and exports in the same year. Unfortunately, only a few - about 4% - of all internationally inactive SMEs plan to start international activities in the near future. But it is a considerable progress that companies involved in e-commerce are more internationally active; the use of Internet erased some barriers for internationalisation. But some serious barriers can be observed.
According to SMEs the most important internal barriers are: price of their own product or service and the high cost of internationalisation. The most important external barriers are: lack of capital, lack of adequate information, lack of adequate public support and the costs of or difficulties with paperwork associated with transport. Moreover, the awareness of public support programmes among SMEs is low and also use of public support is rather limited (financial support is used more by the larger SMEs while non-financial support by the smaller ones) (European Commission, 2010]).
2.2. The results of the Commission Report
The European Commission supports the internationalisation of SMEs because being internationally active has lots of advantages: these companies reach higher turnover growth, have higher growth of employment (the partners enjoy the same higher growth) and they are also more active with process innovations. The Commission’s most important recommendations for SME Policy Support are: 1) awareness and use of public support programmes need to be promoted much more actively, 2) easier access to support measures for micro enterprises, 3) because of the link between innovation and internationalisation, it is useful to design and present policy support measures aimed at stimulating innovation and internationalisation in conjunction. 4) Not only focus on export, because import is also an important activity for SMEs, this is a stepping stone to broader internationalisation. 5) Foster e- commerce, because it may increase internationalisation and can erase the barriers. Finally, 6) lack of information is an important barrier for internationalisation and might be due to a market failure. So it is important at EU level to collect and analyse information on foreign markets. The study shows that in Hungary 5% of the internationally active SMEs use financial public support. With this, Hungary standed at 12th place of 33 in 2009. There are six countries where this percentage is above than 10% (Austria
where 47% of internationally active SMEs use financial public support, the next is Turkey – 32%, Greece and Latvia – 17%, Germany and Norway – 14%). In Hungary, the use of non financial public support is not relevant (European Commission, 2010).
The survey states that lots of European SMEs do not export at all; only 8% of these companies were involved in exports in 2005. Generally, small and open economies’ enterprises have a much higher involvement in exports. This is true in case of Hungary: 9% of companies have some turnover from exports, this is little higher than the average in the European Union – 8%. But other small and open economies’ enterprises have higher proportion. (The first is Estonia with 23%; moreover, our neighboring countries such as Slovenia, Austria and Slovakia also have much higher proportions: 21%, 14% and 12% of enterprises have revenue from exports). If we examine the exports’ share in the revenues, Hungary does not perform well, only 3,3% of incomes derive from exports (only a few countries have lower proportion. The average of EU 25 and EU27 is 4,6%, EU15 is 4,4% and NMS10 and 12 are 5,3 and 5,1%). It can be considered positive that the Hungarian expectations in this field are optimistic, most of the asked SMEs assume that their exports’ share in their income will increase in the future (The Gallup Organization [2007]). There are lots of SMEs in Hungary (99,9% of companies are SMEs), but their share of total exports was only 37% in 2008 (the micro and small enterprises’ share is 23%, medium sized companies’: 14%, big companies’: 63%). So we can state that it is necessary to increase the role of SMEs in the field of export. At the same time, it is encouraging, that we can observe a progress in this dcirection: in the last years the Hungarian SMEs developed a lot and converged to the general level European SMEs (Kállay et al. 2008 and 2010).
3. Characteristics of Internationalization of the Hungarian SME sector
3.1. Trends in internationalisation of Hungarian SME sector
Recently, the importance of internationalization of company sector was more and more recognised both as factor of improving competitiveness and success of integration by the experts and the economic politicians as well. In the last years, in Hungary several studies were published on the issue.
László Szerb and Gábor Márkus published one of the most detailed reports about the topic in 2008. They examined not only the export activity, but they also analyzed the foreign capital and the property relations as well. Additionally, they surveyed the domestic activity of the firms with foreign property and they tested a hypothesis about the significance of relation between the knowledge of foreign language and the foreign trade activity.
László Kállay and Imre Lengyel showed in a detailed report that the two most important indicators of the internationalization of SME sector were the export activity and the foreign direct investments (Kállay – Lengyel, 2008, p.55 - 66.).
In a conference summary, Ildikó Neumanné Virág’s made some conclusions about the export activity of Hungarian SMEs. According to her paper from the investigated fifty companies with significant export ratio in revenues, 20 ones could realize 90 % of their revenues from export.
In sectoral breakdown, 25 % of the export revenues of SMEs came from the manufacturing industry. About 30 % export revenues were realized at the firms with small value-added products or which were involved only in trade. And finally 55 % of the export revenues originated from companies producing chemical products or machines. (Neumanné, 2008, p. 412).
The importance of relation between openness and internationalisation should be particularly stressed. “At macro-economic level, the internationalization can be indicated with the openness of a country”. (Szerb – László, 2008, p. 37). Hungary is a classical small export-orientated country (Kállay – Lengyel, 2008, p. 55). According the intensity of her trade and capital integration with the world
economy, she is one of the most internationalised economies in the world. The similar high level of openness and integration characterises the other countries in the Central-European region.
After 1990, the economic openness of Hungary has greatly increased as result of rapid expansion of volume of her external trade. Before 1989 the Hungarian external trade was about 70 % of the GDP.
Since then, this had been increasing and hit the maximum around 150% of GDP in 2001. This period was separated into two parts by Kállay and Lengyel: the first one is the “early period of evolution of the market economy” and the second is the “developed period” (Kállay – Lengyel, 2008, p.55).
We should call attention to the fact, that the Hungarian capital export is one of the most significant FDI considering the capital export from the new EU members. After the enlargement in 2004 the volume of Hungarian capital export rose by 281 %, so Budapest is the first in this comparison (Szerb – Márkus, 2008, p. 38). As it is pointed out by László Kállay and Imre Lengyel: the Hungarian (and generally the Central-European) situation, due to EU membership is very special, because Budapest (and the others) had to adapt itself (themselves) to the new conditions and to step into a new, more intensive competition. “The internationalization of the SMEs evolved with internationalization of their domestic business environment.” (Meyer – Skak, 2002, p. 180).
László Szerb and Gábor Márkus research tried to make observation on which theories apply better at the investigated questions. Their survey includes answers of 502 enterprises. It is stratified and representative and covers the Hungarian situation from the period between 2003 and 2006 (it overlaps the years accession to EU).
According to he survey of László Szerb and Gábor Márkus, the Hungarian SME sector face several problems:
1. Just 39,6 % of the analyzed enterprises had foreign relations and only 15,4 % could create export and import relations in parallel.
2. In these relations the EU-members have dominant positions; the ratio of EU was 87 %. These data could prop up the „evolutionary theory” better than the „network one”.
3. The structure of the incomes was investigated, particularly how much of them were from export revenues. The export revenues could be realised mostly by those enterprises, whose export revenues was more than 10 % of their whole incomes.
4. According the survey, just 4 % of the companies had more than 75 % of their total income from export. This value is still bigger than in the case of those companies which had 10-24 % or 50-74% export revenue from their total income; all of these companies represent only a
dozen from the total 502. If we consider the geographical shares the network theory is the dominant, while Germany’s role is much stronger than Austria’s, Slovakia’s or Romania’s.
5. The foreign ownership was higher in the medium enterprises (20 %) and in the lower in the small ones (11 %).
6. The summary classification of these SMEs distinguished according to export revenues seems particularly interesting: 86,6 % of the asked companies does not have any export revenues, 11,6 % of them are in (at least) one domestic alliance with foreign partners and only 1,8 % of the enterprises participates in international cooperation (it means just 9 firms) (Szerb – Márkus, 2008, p.52).
7. Finally the authors looked for some correlation between the existing of foreign relations and language knowledge. According to their results in the case of those managers who engaged in import too, can speak a foreign language by 20 % more than who buys inputs only from the domestic market. (Szerb – Márkus, 2008, p.55)
The insufficiencies of the language knowledge were also strengthened by GKI (Institute of Economic Research). According to it, the Hungarian SMEs don’t value it as much as it should be necessary, particularly in comparison with similar data from other developed - first of all OECD – countries. Worse result can be found only in Japan and Spain (Dr. Papanek, 2009, p.46).
3.2. Role of property relations and size of enterprises in the internationalization
The research by Szerb – Márkus focus on function between property relations and internationalisation. Their conclusion was that: the internationalization of property relations is more significant than the internationalization in terms of export. An explanation can be that there are some SMEs with foreign background and they produce exclusively on the domestic (Hungarian) market.
(Szerb – Márkus, 2008, p. 39).
In contrast, Kállay – Lengyel authors brought the size of enterprises into focus. They concluded that the size of enterprises had primary role considering the level of the internationalization (Kállay – Lengyel, 2008, p.55). The export ratio of SMEs in the analyzed 19 European countries was 13% and in Hungary 9,9%. In the case of companies with more than 250 employees, the export ratio is about 21 %
(it is more by 8 % points than at the SMEs) while this ratio in Hungary is 32 % (the difference is 20,1 % points!) (Kállay – Lengyel, 2008, p.64).
László Szerb and Gábor Márkus got similar results. They examined data of the year 2003 and they received that 39,6 % of the SMEs could realize export revenue. But at the same time, these are less than 15 % of total net revenue of SME sector.
A survey from 2006 made by GEM (Global Entrepreneurship Monitor), with 500 SMEs which have one employee at least [by the Hungarian law micro firms are the ones employing less than 10 people (i.e. 0-9)]. came to similar results. Only 23 % of the asked companies exported and the value of their export exceeded the half of the whole revenues only at 6 % of the companies. In the meantime 32 % of the firms imported and around 40 % of them had external relations. (Dr. Papanek (edit.), 2009, p.43).
It is interesting to note that the export revenue decreased on all level – level of the micro, small and medium enterprises between 2005 and 2007. The value of the decrease was 14 % at the small enterprises and a bit less and 11,2 % at the medium ones. These bad data were produced by the Hungarian firms when there was prosperity in the world economy. Only the big companies could increase their export incomes by 3,7 %. In sectoral terms, the process was also unfavourable: the value of the export of manufacturing industry fell down by 30 % between 2004 and 2007 (it was an 8 % points decrease) while the export of commercial services rose by 17 % (a 4 % points increase) (Dr. Papanek (edit.), 2009, p.44).The size of companies was emphatic in Neumanné’s survey too. According to her
“the export of enterprises and their export intensity (export/income) goes up with their own number”
(Neumanné, 2008, p. 413). We can complete this statement with those companies with at least 50 % public property exports least and ones with at least 50 % foreign property exports the most (Incze, 2008.)
According to geographical proportions, the least export orientated SMEs are located in the Southern-Transdanube Region and in the regions of Plain (Alföld). And it isn’t a surprising that the most export orientated firms are situated in the Western-Danube and the Central – Hungarian Region (Budapest and Pest County). The micro and the big companies in Central-Hungarian Region can realize the largest revenues from export and the medium and big ones in the Western-Danube Region are the most export orientated (Neumanné, 2008, p. 413).
If we analyze the sales in terms of market share, in 2003 we can see that the size of firms is very important. The medium enterprises can sell just 20% of their goods and services in export markets. But this number is much less concerning the small enterprises (the ratio is just 6,8 %), while there aren’t any
similar data concerning the micro enterprises (in practice, this value is about 1,5). The Kállay – Lengyel paper emphasizes, the bigger companies intend to export more (Kállay – Lengyel, 2008, p. 67-68).
Kállay – Lengyel calls attention to the importance of the effects of FDI on the internationalization of SMEs. According to their report, the foreign interest of enterprises increases in direct proportion to their size. Only 28 % of the small firms had foreign interests, while at the medium enterprises which employ 50-249 persons, this value is 49,1 % and it is 52,9 % in the case of big (non-SME) companies.
In addition, there is a very strong relation between the export-orientation and the foreign ownership.
This correlation is even more striking if we take that in Hungary the foreign-owned small enterprises can export more than the big (non-SME) enterprises with Hungarian ownership (Kállay – Lengyel, 2008, p.
71-72).
3.3. Motivation and Destination of Trade and Investments
The comparisons of the research by Szerb – Márkus, Kállay – Lengyel etc. with that of Katalin Antalóczy and Andrea Éltető bring interesting results. In the beginning of 2000 they made a research to analyse the Hungarian companies’ motivation, problems which invested money in abroad, how they did it and with what effects. (They also examined Estonian, Czech and Slovenian companies and they compared the results.) Because of lack of data, in order to better understand the investors’ behaviour, the survey was based on questionnaire. One weakness of the sample is that among the asked 57 firms, only 22 have sent back the questionnaire and even these were incomplete. They did not answer some questions. Moreover, the sample was mostly based on old big companies, which are represented in the manufacturing industry, had foreign ownerships and had shares on stock exchange. (But these companies invested abroad mostly, so the sample can be considered representative.) (Antalóczy-Éltető, 2002).
82% of the asked Hungarian companies said that the main reason of his foreign direct investment was to gain and enter into a new market. At the same time, the motivation for reducing costs as a strategic goal; was not considered relevant. (The results are similar to what surveys has found in the case of inflow foreign direct investments, namely why foreigners invest in Hungary.) Moreover, according to the survey, in the 1990s the stronger competition also motivated the Hungarian companies to make more foreign direct investments. The motivation to gain new markets had the desired result: the export and market share of companies increased and the firms’ financial performance improved (this
result was surprising because foreign direct investments are very costly in the beginning). The impact of foreign direct investments on employment and import were not relevant. Furthermore, the Hungarian companies were able to obtain cheap resources also (Antalóczy-Éltető, 2002).
The companies’ risks of foreign direct investments can be various. We can distinguish company and country specific risks. Antalóczy and Éltető divided the risks of investments into five groups in their questionnaire: financing, lack of financial resources, lack of suitable workforce, lack of information and country specific risks. According to the survey the problems of the internationalisation are: problems with the target country, lack of financial sources and lack of suitable workforce. 63,6% of Hungarian companies said that the most important risks were in connection with the target country (its country risk, investment climate). This is not surprising because most of the subsidiaries have been established in Eastern Europe (mostly in Ukraine and Romania), where market economy is less stable than in Central or Western Europe. The second, but less considerable problem is financing (according to 41% of companies). In the case of smaller companies, however, this is bigger, more important problem. 36,3%
of respondents said that the lack of suitable workforce is an important or very important problem of internationalisation. The domestic factors (as administrative obstacles and regulation) and the lack of information were considered less important problems. According to the asked enterprises the economic policy, which helps the Hungarian enterprises to acquire foreign markets, to get information, tax allowances or supported by bank credits are very important. The government should give political support, guarantee and power of lobby and even help to sustain the foreign offices abroad. The decrease of bureaucracy and the economic treaties among countries can better facilitate the possibility of the foreign investment (Antalóczy – Éltető, 2002).
A study received similar results in 2002 who investigated the possibilities of international expansion of a Hungarian small enterprise (the Turris Babel Ltd, which is in the interpreter and translation services) (Bognár). During the survey the Turris Babel Ltd. used the data from the Association of Hungarian Translation Bureaus and of Romanian Translation Bureaus and two interviews were made with one of the heads of enterprise and the head and founder of the other firm. Additionally as a potential client he asked some bids in letter from 15 local translation bureaus and bigger international ones in Hungary and Romania too. His analysis could show that Turris Babel Kft was motivated by the market acquiring and a stronger presence in the East-Central European Region to expand in Romania. On the other hand decrease of the costs and some competition advantages were also important. But to tell the truth the size of the Romanian market was the main motivation of the company. Furthermore they could receive information easier about the foreign market, the special features of the business environment due to common culture, the closeness of market and perhaps the known language. Significant factor was the human relation capital and some bigger projects appeared
in the markets. The main obstacle of the internationalization was the capital deficit (heads of the smaller enterprises prefer the domestic markets). Moreover many companies have bad strategies, so the Hungarian firms (we mean translation bureaus) concentrate the Hungarian market and prefer the smaller, domestic contracts.
In the case of Hungary (similarly to other member states) the main export destination of enterprises in the European Union is Germany. According to the study of the Commission Hungary’s main destination of exports is the European Union (68% of exports is realised within EU). This proportion is close to the EU average. Hungary keeps close commercial contacts with European non- EU countries (e.g. with countries of Former Yugoslavia). 25% of Hungarian export goes to Europe outside of EU. This value is high, just Slovenia has higher proportion: 51%, which is not surprising because of his traditional relationship with the countries of Former Yugoslavia. At the same time, the proportion of exports to outside Europe is not significant (8% of total exports), this does not reach neither the average of the European Union, nor the average of the new member states (e.g. in case of Poland and Czech Republic this proportions are 22 and 30%). According to Hungarian SMEs the main constraints to exporting are: lack of capital, regulation in non-EU countries and different regulations in other EU countries. Differently from other member states lack of knowledge of foreign markets is not considered as a relevant constraint. On the other hand, the companies feel the lack of capital as the biggest constraint: every fifth enterprises say that this is the most important problem of exporting. This problem is not unique, in most of the new member states feel the same way (e.g. in Czech Republic, Lithuania and also in Austria, Belgium and Ireland) (The Gallup Organization, 2007).
SMEs do not sell only their product abroad, but also buy inputs (raw materials, energy, capital and labour) from the global market. So it is important to examine the percentage of inputs purchased abroad. In EU average, it is 12% of the total inputs of SMEs. This percentage is the highest in the smallest and most open economies in Europe, e.g. in Malta (46%), Luxembourg (40%) or Ireland (35%).
In Poland and Slovakia this proportion is 14%. In case of Hungary this is 12%, which is the average of the European Union and the new member states.
One of main the shortcomings of the Hungarian SMEs is in relation to their foreign business partnerships. Overall, 5% of SMEs in the EU receive income from foreign business partnerships, either from subsidiaries or joint ventures abroad. In case of Hungary the proportion of enterprises gaining any revenue from foreign subsidiary or joint venture abroad is only 0,2%. This is lower just in Bulgaria (0,1%). Hungarian SMEs should invest in foreign subsidiaries or joint ventures because it has lots of advantages (e.g. they can get closer to final costumers, can easily adapt the changes of costumers’
expectations, can access to finance or can reduce the labour/administrative costs). With these the companies can easily increase their competitiveness.) (The Gallup Organization, 2007).
In sum we can state that the Hungarian SMEs made significant progress in the field of internationalisation: the proportions of foreign exports and imports reach the average of the EU; they diversify the export relations, but most of the exports is realised in the area of the European Union. It is important to progress in the field of foreign business partnerships, and it is necessary to decrease the role of the main constraints to exporting, mostly the lack of capital.
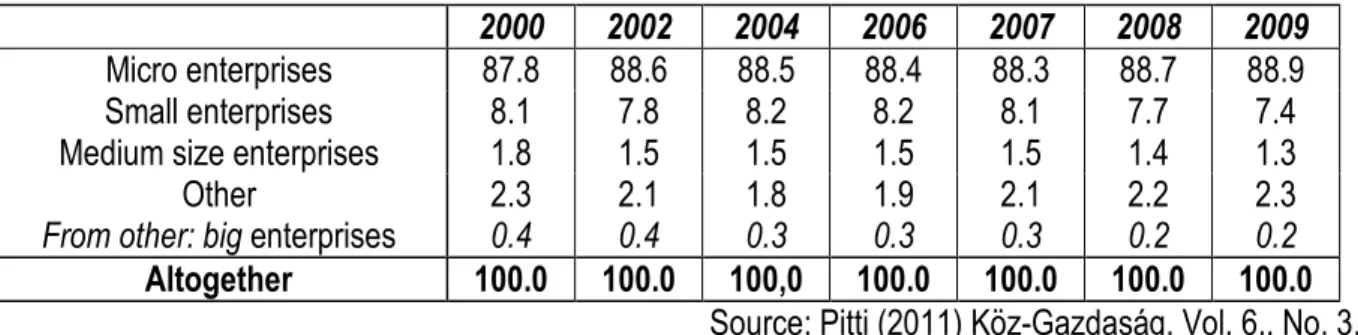
3.4. Performance of Hungarian SME sector between 2000 and 2009 (in numbers)
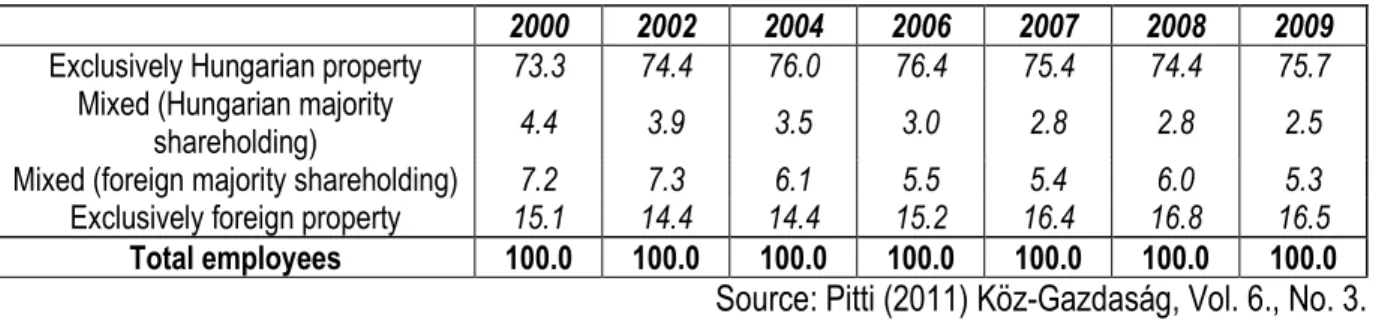
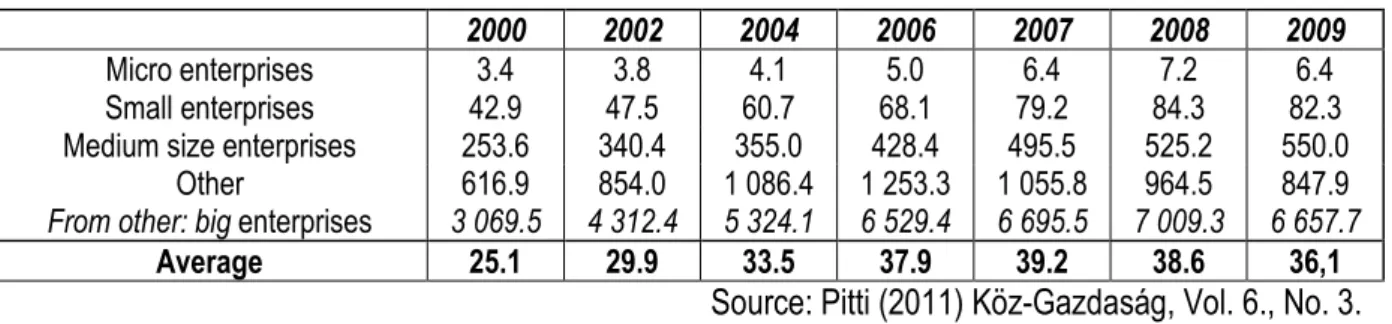
Although some features of market economy were already created during the last decade of the planned economy, the true characteristics of SME sector in Hungary only emerged and became clearly visible after the economic transition of the country. The transition process had many effects on the country’s economy, including the infant SME sector: the shift of economic activity, the radical modification of the ownership proportions, the alteration of the traditional external economic relations, and the slow but steady shrink of the intervention of the state. Although the most important characteristics of the Hungarian economy – including the SME sector – have already evolved, the traits are not static and constant but rather altering. In order to understand and grasp the essence of the current state of the Hungarian sector, the most important figures regarding the SME sector will be demonstrated by primarily relying on researcher Zoltán Pitti’s current analysis (“A gazdasági teljesítmények vállalkozási méretfüggő jellemzői Magyarországon, Köz-Gazdaság 2011 október”). The following paragraphs show the most important characteristics of the Hungarian economy and SME sector, namely the number of companies, the distribution of enterprises regarding their ownership proportions, size, average number of employees, and added value.
One of the most crucial statistics regarding a country’s economy is the number of enterprises and companies. Regarding the enterprises, the following table gives a broad overview of the type of economic activities, and institutional forms in Hungary: