1
Rethinking Kyoto compliance from a consumption-based perspective
Maria Csutora1, Zsofia Mózner2, Corvinus University of Budapest
Hungary
Maria.csutora@uni-corvinus.hu1, zsofia.mozner@uni-corvinus.hu2,
Abstract Environmental consequences of international trade are quite relevant for climate change policy. Apparent decoupling of GHG emission and GDP growth, observed in several European countries, is partly due to the increasing dislocation of manufacturing industries from the developed world to emerging economies. Consequently, decoupling is coupled with increasing GHG emission embodied in imported products from these nations. The article scrutinises the GHG emission embedded in Hungarian import of Chinese products. It argues that a stagnating GHG emission observed in Hungary is intertwined with hidden GHG export to China that takes place through trading of goods. Objective evaluation of compliance status with Kyoto targets would require a consumption-based accounting of GHG emissions rather than a production-based one, unless we accept facing a BIG problem at global level.
Keywords: GHG emissions, consumption-based accounting, embodied emissions, international trade
Introduction
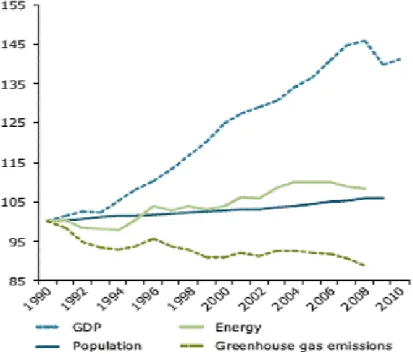
Europe is proud of being successful in decoupling greenhouse gas (GHG) emission from the growth in GDP. A massive growth in GDP could be observed during the 2000s, intertwined with a solid reduction in GHG emission. This suggests that climate policy is doing well in Europe, setting an example for other parts of the world (Figure 1). Other continents kept increasing their carbondioxide emissions, China being responsible for a major part of the increase during these years (Figure 2).
This achievement is partly real and partly unreal. While the manufacturing sector did reduce its impact on climate in Europe, a rapid growth in emission of the transport sector was reported during the same period indicating further development of globalisation and increasing role of trade (Figure 3). Dislocation of manufacturing industries from industrialised countries to emerging countries is partly responsible for this reduction.
Decreasing impacts by passing them over to others may be either intentional as a part of a so- called “escape strategy”, or simply the consequence of relocation towards lower labour costs.
Csutora (2011). Thus, calculating the impacts of trade on emission records is of utmost importance in drawing correct conclusions regarding the success or failure of climate policy.
This article sets the trade impacts between Hungary and China in the focus of such research, asking the question of how much this achievement is real and how much is it due to increasing trade in embedded emission.
2
Figure 1. Decoupling of GHG emissions and GDP growth in the European Union
Source: European Environmental Agency (2010)
Figure 2. National CO2 emissions for selected countries
Source: World Resources Institute (2011)
3
Figure 3. Trends in emission of manufacturing sector and transport sector in Europe
Source: European Environmental Agency (2010)
Research question and the importance of trade accounting
In recent years there has been a growing concern about the emission trade balances of countries. Trade is not only a major factor in forging a country’s economic structure, but contributes to the movement of embodied emissions beyond countries’ borders. This issue is especially relevant from the carbon accounting policy and domestic production perspective, as it is known that the production-based principle is employed in the Kyoto agreement. This issue is extremely relevant for China and its trading partners because of the embedded emissions of the imported products and services, which are of Chinese origin.
As for the methodological part of the emission accounting GHG emission data are conventionally calculated based on production-related emission data. During the last decade, however, input-output based calculation of environmental emissions, based on the work of Leontief and proposed by Bicknell et al. (1998) for calculating consumption-based emissions, became extremely widespread both in science and in policy. By far such kind of calculations became integral part of Eurostat and OECD statistics, but not part of the emission accounting policy. The increased consumption in so-called Annex I countries is met by expanded production in non-Annex I countries as already stated in the studies of (Peters and Hertwich, 2008; Rothman, 1998; Weber and Matthews, 2007).
So, for most European and North-American countries production-based calculation of GHG emission is significantly higher than the value given by a consumption-based approach.
The opposite is true for China and other emerging countries. This means that the environmental impacts due to bilateral and multilateral trade are considered at present
‘invisible’, the costs and benefits are fairly ignored.
The following overview of studies about China’s embodied emissions and our calculations illustrate the significance of the methodology of emission accounting.
4
Some facts about China and its GHG emissions from previous studies
During the past few decades China has become a rapidly developing economy, which does not only mean that it became one of the most influential players of world economy, but the economic development, the increased production have resulted in growing environmental burdens as well. Looking at the emission data, the national CO2 emissions have almost doubled between 2002 and 2007 and by this China became the world’s biggest emitter of CO2
(Gregg et al., 2008).
China is in high need to curb its emissions, but it argues as for Wu (2007) that ‘‘[t]he ramifications of limiting the development of developing countries would be even more serious than those from climate change’’. The solution would not really be able to moderate the Chinese production to a great extent, but another viewpoint should be taken into account, namely the emissions because of foreign exports.
The role of exports is extremely high in the Chinese economy, it accounted for 33% of China’s GDP in 2005, increasing from 12% in 1987. China argues that it should not be held responsible for emissions attributable to the production of exports.
Current environmental policies and obligations, such as the Kyoto Protocol, are framed in such a way that it is possible for developed (Annex I) countries to move towards their domestic and international commitments by shifting their carbon-intensive industries overseas and to depend on the enhancement of international trade to meet the expectations and demands of their consumers. This can result in even higher global CO2 (and other pollutant) emissions if the imported goods use more GHG-intensive production processes than the domestically produced goods that they displace.
There have been several studies that estimated the emissions embodied in China’s exports (and imports), but few studies have focused on this as the primary issue. According to Ahmad and Wyckoff (2003) in 1997, 15% of China’s emissions were embodied in exports and 3% of China’s domestic emissions were imported.
Feenstra et al. (1998) evaluated the size of the US – China trade balance, from which economic benefits and environmental costs might be estimated; Peters et al. (2004, 2006) and Peters and Hertwich (2006) carried out a structural analysis of the environmental impacts of international trade and looked specifically at Chinese emissions.
Peters and Hertwich (2008) have examined the emissions embodied in trade for 87 countries and regions and found that in 2001 China exported 24% of its CO2 emissions and imported 7% of China’s domestic emissions. These results already show the growing proportion of emissions because of the economic growth which has been taking place in China.
Weber et al. (2007) have calculated the Chinese embodied CO2 emissions allocated to the final demand categories and results show (Figure 4.) that the emissions due to governmental and household consumption have increased slightly, but the emissions of exports have risen significantly.
5
Figure 4: Share of exported CO2 in China according to destinations
Source: Weber and Matthews (2007)
Analysing the share of the exported products from 1987 in China, the exports to the US and EU27 became significant, accounting for 40% of the exported CO2 emissions. These data also support the Chinese argument that industrialised countries should take the responsibility for the imported emissions.
Recently (in 2005), substantial fractions of total emissions were due to exports of electronics (22% of total), metal products (13%), textiles (11%), and chemical products (10%). The large growth in export emissions is increasingly due to advanced products.
Looking at the 1995 breakdown of export emissions was substantially different: 19% textiles, 13% electronics, 12% machinery, and 10% chemicals, and 7% metal products (Weber et al., 2007).
However, this large growth in exported emissions is not likely to be due to the climate policy in the Annex I countries. They are more likely to be the result of lower labour costs in China, which are considered to be its advantage in producing goods. Still, caution is needed whenever analysing the compliance status of European countries with the Kyoto protocol, as this hidden trade of GHG is not accounted for in official statistics.
From an economic point of view the low cost of Chinese production is favoured by consumers, but it contributes to the degradation of the local Chinese environment (Streets et al., 2006) and the global environment effects of climate change, because of increased trading activities. Weber et al. (2007) have concluded as well that the growth rate of the emissions from the production of exports is greater than the growth rate of total emissions, showing the particular importance of exports to China’s growth in CO2 emissions.
6
Production- or consumption-based emission accounting
According to the Kyoto agreement, current National Emission Inventories are production- based. Therefore its drawback is that the emissions include all greenhouse gas emission and removal taking place within the country borders, so the emissions due to production for exports are included as well, but emissions due to imports are not included (Mózner, 2011).
According to Peter and Hertwich (2008) the consumption-based National Emission Inventories (NEI) would have a number of advantages, and it would be consistent with the current logic of international trade. Such inventories would cover more global emissions with limited participation; increase mitigation options; encourage cleaner production; and supporting the spread of environmental policies such as Clean Development Mechanism (CDM).
It should be noted that the consumption-based approach has several pieces of disadvantages as well, as it would require more complex calculations, thus it would increase uncertainty. Lenzen et al. (2007) suggest sharing responsibility between producers and consumers, where the responsibility would amount to weighting the emissions embodied in imports and exports. Table 1. presents a comparison between the production-based and consumption-based National Emission Inventories.
Table 1. A comparison of the production-based and consumption-based National Emission Inventories (NEI)
Allocation of national emissions
Criteria Production-based NEI (territorial-based
NEI)
Consumption-based NEI
Emissions covered Administered territory Global
Allocation Domestic production Domestic consumption Allocation of trade Includes exports, not
imports
Includes imports, not exports
Comparability Consistent with GDP Consistent with national consumption Consistent with
trade policy No Yes
Complexity Low High
Transparency High Low
Uncertainty Lower Higher
Mitigation analysis Domestic mitigation
only Global mitigation
Source: Peters (2008)
7
Overview of Chinese-US and Chinese-UK trade and emissions
In the following section an overview is given of the emission trade balances of the USA and the UK, one of China’s largest importers.
Shui and Harris (2005) have raised three interesting questions concerning the environmental effects of the US-China trading activities and they have calculated the embodied emissions of the trade.
Their results are the following:
1. US CO2 emissions would have increased from 3% to 6% if the goods imported from China were produced in the US.
2. 7-14% of China’s current CO2 emissions were a result of producing exports for US consumers.
3. US-China trade has increased global CO2 emissions by an estimated 720 million metric tons.
They conclude that export of US technologies to China and expertise related to clean production and energy efficiency could help in the future to moderate the environmental impacts. Figure 5. shows the avoided US emissions and the trade values of Chinese exports
Figure 5: Avoided CO2 emission for the US vs. trade values of Chinese exports to the US (1997-2003)
Source: Shui and Harris (2005)
As for the trade balance Shui and Harris (2005) conclude the following:
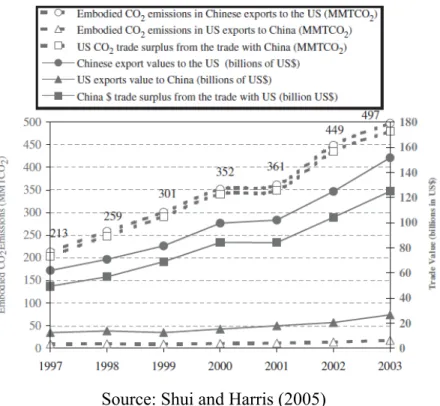
1. As expected, the CO2 embodiment in Chinese exports (plain circles with a dashed line in Fig. 6) follows the growth trend of the trade value of Chinese exports to the US (solid circles with a solid line in Fig. 6). It may indicate that the structure of Chinese exports and fuel structures of China’s industrial sector did not change significantly during the study period,
8
2. Due to the relatively insignificant value of US exports to China (solid triangles with a solid line in Fig. 6), the growth trends of US–China trade balance (solid squares with a solid line in Fig. 6) and associated CO2 embodiment balance (plain squares with a dashed line in Fig. 6) are dominated by Chinese exports.
While the production of exports for US consumption are a significant source of China’s annual CO2 emissions, rapid growing domestic demand and production of exports to other countries are a primary driving force for increasing China’s carbon emissions.
Figure 6. China trade surplus vs. US net CO2 embodiment, 1997-2003
Source: Shui and Harris (2005)
Li and Hewitt (2008) have studied the China-UK emission trade balance and according to their analysis:
The UK avoided emitting 69 Mt of CO2 in 2004 as a result of importing goods from China, rather than manufacturing the same type and quantity of goods domestically. This reduced the UK’s national potential CO2 emissions by 11% (total UK CO2 emissions for the year 2004 were 555 Mt; Defra, 2007).
For comparison, the CO2 emissions embodied in the manufacture of goods in the UK and exported to China in 2004 were estimated, to be 2.3Mt of CO2, or 0.4% of total UK emissions for the year.
China emitted 4707Mt of CO2 in 2004 (Energy Information Administration, 2008), a fraction of which was associated with the manufacture of goods subsequently exported to the UK. The manufacture of these goods resulted in CO2 emissions of approximately 186Mt in 2004. In other words, 4% of China’s CO2 emissions in 2004 were as a result of producing goods for the UK market. This quantity of CO2 is greater than the 69 Mt of CO2 required to manufacture the same goods in the UK, due to the greater relative carbon intensity of Chinese industry, through its greater use of coal and less efficient manufacturing methods compared with the UK.
9
Research results of the embodied CO
2emissions of Chinese products in Hungary
GHG emission embedded in import from China has been calculated using the SIOT (symmetric input-output) tables from the OECD’s STAN Database for Structural Analysis (OECD, 2011) and GHG emission statistics published by Eurostat and using Chinese emission data from the article Zhang et al. (2011).The input-output approach has the essential advantage of being able to track the transformation of goods through an economy, tracing impact from final product back to raw resources. It also captures the impact of exchanged goods and services. This application is used after Leontief, whose studies (Leontief, 1936 and 1970) are a starting point for the methodology.
The carbon emission values were calculated using the consumption-based accounting approach, where the emissions of both from domestic production for domestic demand and emissions because of imported products were used in the calculation.
As a result of the calculations, the carbon emissions were gained on sectoral level as well and the aim was to calculate the emissions generated in China due to products exported and consumed in Hungary. Both CO2 and GHG embodied emissions were calculated.
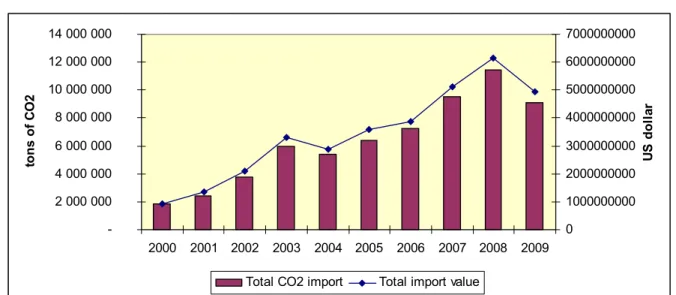
Figure 7. shows the CO2 emissions from 2000, which are embodied in products imported by Hungary from China. Not surprisingly, Hungarian trends also indicate growing importance of embodied CO2 emission, as there is a significantly increasing trend in embodied emissions. The increasing import value indicated as well the growing trading activities between the two countries, however the value embodied in the emissions are not accounted for by the importing country. It can be clearly seen that embodied CO2 has tripled during eight years, and then fell back in 2009 due to the emergence of economic crises.
Figure 7: CO2 import embodied in products from China 2000-2009
- 2 000 000 4 000 000 6 000 000 8 000 000 10 000 000 12 000 000 14 000 000
2000 2001 2002 2003 2004 2005 2006 2007 2008 2009
tons of CO2
0
1000000000 2000000000 3000000000 4000000000 5000000000 6000000000 7000000000
US dollar
Total CO2 import Total import value
Source: authors’ own calculations (2011)
10
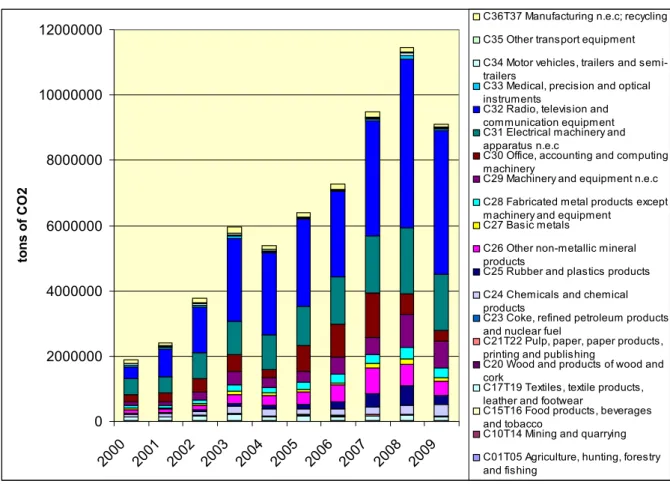
Analysis of the emissions embodied in imports at a sectoral level is shown in Figure 8. We can see that the sector of Manufacturing of radio, television and communication equipment have attributed to the highest share in that increase, the sector of Office, accounting and computing machinery, and Electrical machinery and apparatus contribute also to a high share.
These are the main sectors where there has been a great increase in imports and the production of the imported products is quite energy-demanding. The products related to the Other non-metallic mineral sector have also shown a great increase as imported goods. Still their CO2 impacts are relatively small compared to other sectors. It is of great importance to analyse and find out those industrial sectors which can be held responsible to a great extent for the embodied CO2 emissions..
Figure 8. Structure of Hungarian CO2 import from China
0 2000000 4000000 6000000 8000000 10000000 12000000
2000 2001
2002 2003
2004 2005
2006 2007
2008 2009
tons of CO2
C36T37 Manufacturing n.e.c; recycling C35 Other transport equipment C34 Motor vehicles, trailers and semi- trailers
C33 Medical, precision and optical instruments
C32 Radio, television and communication equipment C31 Electrical machinery and apparatus n.e.c
C30 Office, accounting and computing machinery
C29 Machinery and equipment n.e.c C28 Fabricated metal products except machinery and equipment
C27 Basic metals
C26 Other non-metallic mineral products
C25 Rubber and plastics products C24 Chemicals and chemical products
C23 Coke, refined petroleum products and nuclear fuel
C21T22 Pulp, paper, paper products, printing and publishing
C20 Wood and products of wood and corkC17T19 Textiles, textile products, leather and footwear
C15T16 Food products, beverages and tobacco
C10T14 Mining and quarrying C01T05 Agriculture, hunting, forestry and fishing
Source: authors’ own calculations (2011)
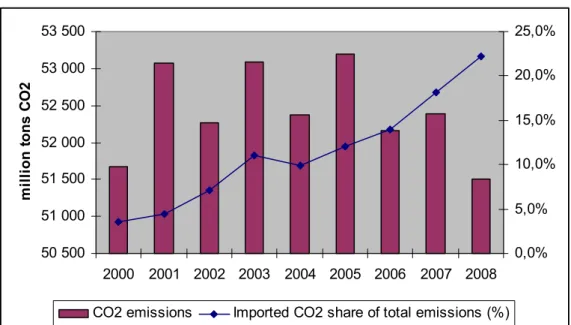
The CO2 emissions in Hungary between 2000 and 2009 were quite variable, but it is clear that there has not been a growth in the emission level of the country, despite the growing consumption. The more or less stable or even a bit decreasing trend of CO2 emissions can be explained by the growing level of imports, by which the demand of final consumers were met.
Figure 9. clearly show this relationship and it is noteworthy that the share of imported products of China has risen from 5% to more than 20% in less than 10 years.
11
This increasing trend means that the responsibility of Hungarian consumers for Chinese CO2 emissions is growing and Hungary is becoming more and more dependant on the Chinese economy and environmental resources as well, which are partly extracted in order to be used for exported products later.
Figure 9: CO2 emissions in Hungary and emissions embodied in imports 2000-2009
50 500 51 000 51 500 52 000 52 500 53 000 53 500
2000 2001 2002 2003 2004 2005 2006 2007 2008
million tons CO2
0,0%
5,0%
10,0%
15,0%
20,0%
25,0%
CO2 emissions Imported CO2 share of total emissions (%)
Source: authors’ own calculations (2011)
National GHG emission and GHG embodied in import
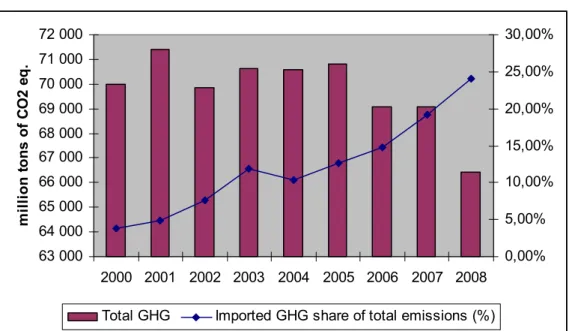
Regarding total GHG emissions, Hungary follows the tendency of other European countries of ensuring a relatively stable level of GHG emission, while increasing the import from emerging countries that leads to increasing share of emission embodied in trade (Figure 10). The GHG emissions embodied in imports from China have grown by more than four times after 2000. This growth is significant concerning the Chinese national emissions as well, as it means that an increasing proportion of the national emissions are generated because of producing goods for Hungary and also for other developed countries. As for Hungary, achievements in decreasing national emission are coupled with increasing share of imported GHG.
The stable or slightly decreasing level of GHG emissions in Hungary, while the consumption was increasing, cannot be explained by growing technological efficiency or decoupling. But the dynamic growth in quantity and share of Chinese emissions can account for this (Figure 12), creating a biased picture both in Hungary in the efficiency of climate reduction policy and environmental impacts of consumption and in China concerning the growing GHG emissions due to exported products and its responsibility for its national emissions.
12
Figure 10. Total GHG import of Hungary from China
- 2 000 000,00 4 000 000,00 6 000 000,00 8 000 000,00 10 000 000,00 12 000 000,00 14 000 000,00 16 000 000,00 18 000 000,00
2000 2001 2002 2003 2004 2005 2006 2007 2008 2009
tons of CO2 eq.
0 1000 2000 3000 4000 5000 6000 7000
Million US dollar
Total GHG import Total import value
Source: authors’ own calculations (2011)
Figure 11. Total GHG import from China and imported share of total emissions
63 000 64 000 65 000 66 000 67 000 68 000 69 000 70 000 71 000 72 000
2000 2001 2002 2003 2004 2005 2006 2007 2008
million tons of CO2 eq.
0,00%
5,00%
10,00%
15,00%
20,00%
25,00%
30,00%
Total GHG Imported GHG share of total emissions (%)
Source: authors’ own calculations (2011)
The picture, concerning our research results, is still incomplete. Methodology applied is based on monetary statistics and SIOT tables. This fact leads to distortions, as labour costs are quite different in emerging countries and in industrialized ones. Adjusting for this distortion would further increase the share of embodied GHG import in total emission and this can be a fruitful area of future research as well.
13
Figure 12. Material flow accounts for EU15
Source: European Environmental Agency (2010)
According to Figure 12. about 35% of material flows is imported in EU15, a much higher share than indicated by monetary accounts. This suggests further distortions in calculating the embodied GHG content of imports. The EU is heavily dependent on natural resources of other regions and losing control over manufacturing industries supporting the consumption of its citizens. This growing dependence of developed countries and the use of the sink-capacity of developing countries are creating a more difficult situation in climate talks. Results of the study and previous empirical proofs suggest the need for sharing the responsibility for embodied GHG emissions.
Consequences for Kyoto compliance
Some of the achievements on EU in decoupling GHG emission and GDP growth are fake and biased. The question could be raised, whether Europe and US should be held responsible for GHG emission embodied in import. If yes, the price of imported goods should be attached to express the value of embedded GHG.
In a consumption-based approach European countries should be held responsible for emissions embedded in import. Hence, it would be more difficult to achieve Kyoto compliance . More effort should be mobilised for climate policy, including more resources allocated to clean development mechanism (CDM) projects.
Such a change in approach would be clearly beneficial for China. More capital accumulated for clean development projects could be required, these resources could be spent on alternative energy and energy savings projects. Pollution burden and pollution intensity is higher in China, but China has already taken over the role in developing renewable energy technologies. China may also take the leading role for other environmental innovations in the future.
Material flow of waste
0 1000 2000 3000 4000 5000 6000 7000
2000 2001 2002 2003 2004 2005 2006 2007 Time
000 ton Total Imports
Total Exports Material flow accounts for EU15
1 000 000 1 500 000 2 000 000 2 500 000 3 000 000 3 500 000 4 000 000 4 500 000 5 000 000 5 500 000
2000 2001 2002 2003 2004 2005 2006 2007 Time
000 ton Domestic Extraction Used
Total Imports Total Exports
14
Conclusions
Environmental consequences of international trade are quite relevant for climate change policy. Apparent decoupling of GHG emission and GDP growth, observed in several European countries, is partly due to the increasing dislocation of manufacturing industries from the developed world to emerging economies. Consequently, decoupling is coupled with increasing GHG emission embodied in imported products from these nations. Embodied import related emission should be added to national values when calculating compliance status with Kyoto targets. Empirical results of the study confirm the importance of the consumption-based emission accounting in the case of Chinese exports to Hungary as well.
During the recent years decreasing GHG emissions in Hungary were coupled with growing imports from China and growing embodied emissions, thus using the sink-capacity in China.
Thus objective evaluation of compliance status would require a consumption-based approach rather than a production based one, unless we accept facing a BIG problem at global level (Csutora, 2012).
15
References
Ahmad, N., Wyckoff, A.A. (2003): Carbon Dioxide Emissions Embodied in International Trade of Goods. Organisation for Economic Co-operation and Development (OECD), Paris.
Bicknell, K.B., Ball, R.J., Cullen, R., Bigsby, H.R. (1998): New methodology for the Ecological Footprint with an application to the New Zealand economy. Ecological Economics 27, pp. 149– 160.
Csutora, M. (2011): From eco-efficiency to eco-effectiveness: The policy-performance paradox. Society and Economy, 33 (1): pp. 161-181.
Csutora, M. (2012): One More Awareness Gap? The Behaviour–Impact Gap Problem. Journal of Consumer Policy, 2012, in press, DOI 10.1007/s10603-012-9187-8
EEA (European Environmental Agency) (2010): State of the environment report No 1/2010 http://www.eea.europa.eu/soer Accessed at: 2011. 10. 01.
EIA (2007): International Energy Annual 2005. Energy Information Administration.
Feenstra, R.C., Wen, H., Wing, T.W., Shunli, Y. (1998): The US–China bilateral Trade balance: its size and determinants. NBER Working Papers 6598, National Bureau of Economic Research, Inc.
Gregg, J.S., Andres, R.J., Marland, G. (2008): China: emissions pattern of the world leader in CO2 emissions from fossil fuel consumption and cement production. Geophysical Research Letters 35, L08806.
Leontief, W. (1936): Quantitative Input and Output Relations in the Economics System of the United States. Review of Economics and Statistics 18(3): 105–125.
Leontief, W. (1970): Environmental Repercussions and the Economics Structure of Input- output Approach. Review of Economics and Statistics 52(3): 262–277.
Li, Y., Hewitt, C.N. (2008): The effect of trade between China and the UK on national and global carbon dioxide emissions. Energy Policy 36, 1907–1914
McGregor, R. (2007): China Takes Stand on Climate. Financial Times, Beijing.
Mózner, Zs. (2011): Applying consumer responsibility principle in evaluating environmental load of carbon emissions. Society and Economy 33(1): 133-144.
OECD Stan Database. (2011): Available at:
http://stats.oecd.org/Index.aspx?DataSetCode=STAN Accessed at: 2011. 10. 01.
Peters, G. P. (2008): From production-based to consumption-based national emission inventories. Ecological Economics 65(1): 13-23.
Peters, G., Briceno, T., Hertwich, E. (2004): Pollution Embodiment in Norweigian Consumption Working Paper 6/2004, Industrial Ecology Programme. Norweigian University of Science and Technology (NTNU), Trondheim, Norway.
Peters, G., Hertwich, E.G. (2006): Structural analysis of international trade: environmental impacts of Norway. Economic Systems Research 18, 155–181.
16
Peters, G., Weber, C., Liu, J.R. (2006): Construction of Chinese energy and emissions inventory. Reports and working paper for Industrial Ecology Programme in Norwegian University of Science and Technology (NTNU).
Peters, G.P., Hertwich, E.G. (2008): CO2 embodied in international trade with implications for global climate policy. Environmental Science and Technology 42, 1401–1407.
Rothman, D.S. (1998): Environmental Kuznets curves—real progress or passing the buck? A case for consumption-based approaches. Ecological Economics 25, 177–194.
Shui, B.-Harris, R.C.(2006): The role of CO2 embodiment in US–China trade Energy Policy 34 (2006) 4063–4068
Streets, D., Yu, C., Bergin, M., Wang, X., Carmichael, G. (2006): Modeling study of air pollution due to the manufacture of export goods in China’s Pearl River Delta.
Environmental Science and Technology 40, 2099–2107.
Streets, D.G., Jiang, K., Hu, X., Sinton, J.E., Zhang, X.-Q., Xu, D., Jacobsen, M.Z., Hansen, J.E. (2001): Recent reductions in China’s greenhouse gas emissions. Science 294, 1835–
1837.
Weber, C.- Peters, G.P.- Guan, D.-Hubacek,K. (2008): The contribution of Chinese exports to climate change. Energy Policy 36 (2008) 3572– 3577
Weber, C., Matthews, H.S. (2007): Embodied environmental emissions in US international trade 1997–2004. Environmental Science and Technology 41, 4875–4881.
World Resource Institute (WRI) – CO2 emissions (2011)
http://cait.wri.org/cait.php?page=graphcoun&url=form&pOpts=open&pHints=shut&men u=emit&start=1990&end=2007§or=natl&update=Update&c1=36&c2=185&c3=184
&c4=85&c5 Accessed at: 2011. 10. 01.
Wu, C. (2007): Action plan aims to cut gas emissions. China Daily.