Brain Sci. 2020, 10, 68; doi:10.3390/brainsci10020068 www.mdpi.com/journal/brainsci
Article
Lemur Tyrosine Kinase 2 (LMTK2) Level Inversely Correlates with Phospho‐Tau in Neuropathological Stages of Alzheimer’s Disease
János Bencze 1,2, Máté Szarka 3,4,5, Viktor Bencs 1, Renáta Nóra Szabó 2,6, László V. Módis 2, Dag Aarsland 7,8 and Tibor Hortobágyi 2,6,7,8,*
1 Department of Pathology, Faculty of Medicine, University of Debrecen, 4032 Debrecen, Hungary;
bencze.janos@med.unideb.hu (J.B.); bencsv95@gmail.com (V.B.)
2 MTA‐DE Cerebrovascular and Neurodegenerative Research Group, Department of Neurology, University of Debrecen, 4032 Debrecen, Hungary; szabo.renata.nora@gmail.com (R.N.S.); laszlo.modis@gmail.com (L.V.M.)
3 Horvath Csaba Memorial Institute of Bioanalytical Research, Research Centre for Molecular Medicine, University of Debrecen, 4032 Debrecen, Hungary; szarka.mate@med.unideb.hu
4 Vitrolink Ltd., 4033 Debrecen, Hungary
5 Institute for Nuclear Research of the Hungarian Academy of Sciences (ATOMKI), 4026 Debrecen, Hungary
6 Institute of Pathology, Faculty of Medicine, University of Szeged, 6725 Szeged, Hungary
7 Department of Old Age Psychiatry, Institute of Psychiatry Psychology and Neuroscience, King’s College London, London, SE5 8AF, UK; dag.aarsland@kcl.ac.uk
8 Centre for Age‐Related Medicine, SESAM, Stavanger University Hospital, 4011 Stavanger, Norway
* Correspondence: tibor.hortobagyi@kcl.ac.uk
Received: 20 December 2019; Accepted: 25 January 2020; Published: 27 January 2020
Abstract: Alzheimer’s disease (AD) is the most common neurodegenerative dementia. Mapping the pathomechanism and providing novel therapeutic options have paramount significance. Recent studies have proposed the role of LMTK2 in AD. However, its expression pattern and association with the pathognomonic neurofibrillary tangles (NFTs) in different brain regions and neuropathological stages of AD is not clear. We performed chromogenic (CHR) LMTK2 and fluorescent phospho‐tau/LMTK2 double‐labelling (FDL) immunohistochemistry (IHC) on 10–10 postmortem middle frontal gyrus (MFG) and anterior hippocampus (aHPC) samples with early and late neuropathological Braak tau stages of AD. MFG in early stage was our ‘endogenous control’
region as it is not affected by NFTs. Semiquantitative CHR‐IHC intensity scoring revealed significantly higher (p < 0.001) LMTK2 values in this group compared to NFT‐affected regions. FDL‐
IHC demonstrated LMTK2 predominance in the endogenous control region, while phospho‐tau overburden and decreased LMTK2 immunolabelling were detected in NFT‐affected groups (aHPC in early and both regions in late stage). Spearman’s correlation coefficient showed strong negative correlation between phospho‐tau/LMTK2 signals within each group. According to our results, LMTK2 expression is inversely proportionate to the extent of NFT pathology, and decreased LMTK2 level is not a general feature in AD brain, rather it is characteristic of the NFT‐affected regions.
Keywords: Alzheimer’s disease; LMTK2; neurodegeneration; tau; digital image analysis
1. Introduction
Alzheimer’s disease (AD) is the most common cause of dementia, affecting more than 47 million people worldwide [1]. It was first described by Alois Alzheimer in 1906 [2]. A century later AD is one of the most important public health issues of aging societies. According to our current knowledge, the disease is incurable. Therefore, researchers spare no effort to identify potential therapeutic targets.
However, this is not possible without mapping the pathological processes leading to AD. The major neuropathological changes are the deposition of extracellular β‐amyloid plaques and intracellular neurofibrillary tangles (NFTs). The main constituent of NFTs is the microtubule‐associated protein tau. It is involved in myriad of physiological cellular functions such as stabilization of microtubules, axonal transport, synaptic transmission or activation of unfolded protein response [3–6]. Under pathological circumstances, the phosphorylation level of tau is 3‐ to 4‐fold higher than in normal brains [7]. Hyperphosphorylated tau is prone to self‐aggregation as well as to gain toxic ability through sequestering normal tau and other microtubule‐associated proteins, resulting in microtubule disassembly [8]. Braak and Braak first described the hierarchy of NFT spreading in the central nervous system [9]. They established six stages based on the affected brain regions: transentorhinal stages (I‐II); limbic stages (III‐IV); and isocortical stages (V‐VI). In general, NFT burden inversely correlates with the number of surviving neurons, proposing that neurofibrillary lesions have a key role in degenerative changes and apoptotic cell loss in AD [10]. The latest studies suggest that there is a link between the expression/activity of recently described lemur tyrosine kinase 2 (LMTK2) protein and tau hyperphosphorylation [11–13]. Despite its name, LMTK2 is a member of a membrane‐anchored serine/threonine‐specific protein kinase family [14–16]. The enzyme is involved in the orchestration of vital physiological processes such as axonal transport, apoptosis or neurogenesis [11,12,14,17,18]. Alterations of LMTK2 level may contribute to neurodegeneration by disrupted axonal transport, enhanced apoptosis and tau hyperphosphorylation [11]. We previously described decreased LMTK2 level in human postmortem AD brains compared to age‐matched controls [13]. Our immunohistochemical (IHC) results were in accordance with other human and animal model studies [12,19]. However, the expression pattern of LMTK2 in different brain regions and neuropathological stages of AD has not been investigated yet. Moreover, the question as to whether LMTK2 reduction is a general feature in AD brains or linked to the distribution of NFT pathology remains to be answered. In this study we evaluate the immunolabelling intensity score of the protein, as well as the percentage distribution of phospho‐tau/LMTK2 signals in different brain regions and neuropathological (Braak and Braak) stages of AD.
2. Materials and Methods
2.1. Patients and Samples
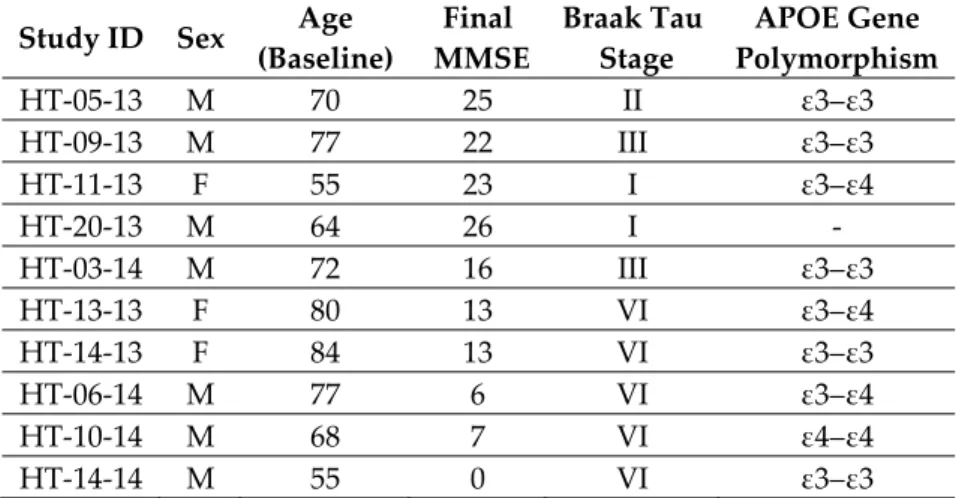
The archived tissue samples were drawn from a clinic‐pathologic cohort study, the Dementia Study in Western Norway (DemVest) from the Centre for Age‐Related Medicine, Stavanger University Hospital, Stavanger, Norway. Selection of cases was based on the neuropathological Braak tau staging. We obtained formalin‐fixed paraffin‐embedded samples of patients (n = 10 in total) with early (Braak stage III or less, n = 5) and late stage (Braak stage VI, n = 5) pathological changes (Table 1). The majority of the patients in the early neuropathological stage group had mild dementia. In the late neuropathological stage group, every patient suffered from severe dementia. Participants were included at time of diagnosis of dementia and followed annually until death. Dementia was diagnosed according to DSM IV criteria, and AD was diagnosed according to the National Institute of Neurological and Communicative Disorders and Association. Mild dementia was defined as mini‐
mental state examination (MMSE) score ≥ 20 and/or Clinical Dementia Rating score = 1. The clinical evaluation included standardized scales, and cognition was measured using MMSE and a neuropsychological test battery. In addition, blood tests and MRI scans were performed to rule out other causes for cognitive decline. More details of the study design are provided in our previous work [20]. Block taking for histological and immunohistochemical studies and neuropathological
assessment for neurodegenerative diseases was carried out in accordance with standard criteria as described in detail in earlier studies [21].
Table 1. Human postmortem samples: case identifier (study ID), age (baseline), sex, final MMSE score, neuropathological Braak tau stage and APOE gene polymorphism. (M: male; F: female; MMSE: mini‐
mental state examination; APOE: apolipoprotein E).
Study ID Sex Age (Baseline)
Final MMSE
Braak Tau Stage
APOE Gene Polymorphism
HT‐05‐13 M 70 25 II ε3–ε3
HT‐09‐13 M 77 22 III ε3–ε3
HT‐11‐13 F 55 23 I ε3–ε4
HT‐20‐13 M 64 26 I ‐
HT‐03‐14 M 72 16 III ε3–ε3
HT‐13‐13 F 80 13 VI ε3–ε4
HT‐14‐13 F 84 13 VI ε3–ε3
HT‐06‐14 M 77 6 VI ε3–ε4
HT‐10‐14 M 68 7 VI ε4–ε4
HT‐14‐14 M 55 0 VI ε3–ε3
We selected two brain regions based on the characteristic distribution of NFTs in these stages: (a) anterior hippocampus (aHPC) affected in early neuropathological stages, and (b) middle frontal gyrus (MFG) showing significant pathological changes in the late neuropathological Braak tau stages of AD.
Thus, we established four experimental groups. In this setting, MFG in early neuropathological stage served as an endogenous control region because it is spared from NFTs, whereas the other regions (MFG in late stage and aHPC in both stages) are severely affected by NFT pathology.
All participants signed informed consent to participate in the study and to autopsy. The study was approved by the regional committee for medical and health research ethics in Western Norway (REK 2010/633); the Hungarian Medical Research Council, Scientific and Research Ethics Board (19312/2016/EKU); Institutional Ethics Committee of the MRC London Neurodegenerative Diseases Brain Bank (18/WA/0206) at the Institute of Psychiatry Psychology and Neuroscience, Kingʹs College London.
2.2. CHR‐IHC
The applied immunohistochemical procedure was optimized in our previous work [13]. After routine dewaxing, sections were treated in 3% (v/v) H2O2:methanol solution for 30 minutes to block endogenous peroxidase enzymes. Heat‐induced epitope retrievals were carried out in a microwave oven (5 min at 800 W, 2 × 5 min at 250 W). Non‐specific sites were blocked with 10% (v/v) normal goat serum for an hour at room temperature. Sections were incubated with anti‐KPI‐2 (LMTK2) primary antibodies (clone H9, SantaCruz Biotechnology) in 1:100 concentration overnight at 4 °C.
Goat anti‐mouse biotinylated secondary antibody (Agilent/Dako) were applied in 1:200 concentration for an hour at room temperature. For visualization, VECTASTAIN Elite ABC HRP Kit (Vector laboratories) and 3,3’‐diaminobenzidine tetrahydrochloride (DAB) reagent (Sigma‐Aldrich 10 mg tablets) were used. Nuclear counterstain, antigen retrieval solution and working solution (rinsing and dilution) were Harris hematoxylin, Tris(hydroxymethyl)aminomethane‐
Ethylenediaminetetraacetic acid (TRIS‐EDTA; 10 mM TRIS Base, 1 mM EDTA, pH 9.0) and 20 mmol TRIS‐buffered saline (Sigma‐Aldrich, TRIS‐Buffered Saline 20× solution, 20 mmol Tris, pH 7.4), respectively.
2.3. FDL‐IHC
Dewaxing, antigen retrieval, nonspecific site blocking and preparation of primary anti‐LMTK2 antibody were the same as with the CHR‐IHC method described above. However, in FDL‐IHC endogenous peroxidase blocking, biotinylated secondary antibody, chromogenic reagents and hematoxylin counterstain are not applicable. Besides anti‐LMTK2, anti‐phospho‐tau (Ser202, Thr205) monoclonal primary antibody (clone AT8, Thermo Fisher Scientific) was also used. Concentrations were 1:100 and 1:500 for anti‐LMTK2 and anti‐phospho‐tau antibodies, respectively. Considering that both primary antibodies are produced in mice, we applied fluorophore‐conjugated fragment antigen‐binding (Fab) anti‐fragment crystallizable (Fc)‐region secondary antibodies (FabuLight, Jackson ImmunoResearch Europe Ltd.). Two different fluorophore‐conjugated antibodies (Alexa Fluor 488 and Alexa Fluor 594—
AffiniPure Fab Fragment Goat Anti‐Mouse IgG) were used. These secondary antibodies bind directly to the Fc‐region of primary antibodies and spare the antigen‐specific Fab region, therefore were incubated separately in vitro with the anti‐LMTK2 and anti‐phospho‐tau primary antibodies. Next, we applied these
‘sandwiches’ to the sections and incubated them overnight at 4 °C. To avoid autofluorescence, samples were treated with Vector TrueVIEW Autofluorescence Quenching Kit (Vector laboratories). Vectashield Antifade Mounting Medium (Vector laboratories) was used for coverslipping. Working solution was 10× pH 7.3 phosphate‐buffered saline (Biocare Medical, PBS Plus).
2.4. Semiquantitative Analysis for CHR‐IHC
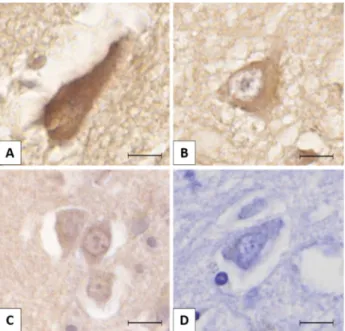
Slides were scanned with Panoramic MIDI II (3DHISTECH Ltd.). Using Panoramic Viewer software (3DHISTECH Ltd.), we took 10‐10 high magnification (400×) random consecutive images per sample. The region of interest (ROI) regarding the localization of LMTK2 and NFTs was the transentorhinal region and the neocortex in aHPC and MFG, respectively. Semiquantitative intensity scoring was performed with ImageJ software. Using Cell Counter module, we marked and counted the differentially labelled neurons (0, +1, +2, +3) on every image (Figure 1). In the two key neuroanatomical regions (MFG and aHPC) 1215 neurons were assessed in different neuropathological Braak tau stages of AD. There were 538 (1+) and 418 (2+) cells in the four experimental groups. The strongest (3+) immunolabelling was observed exclusively in the early neuropathological stage MFG group (177 cells).
We determined the average labelling intensity scores for each case. Then mean values for aHPC and MFG groups in both neuropathological stages were also calculated.
Figure 1. The figure presents different lemur tyrosine kinase 2 (LMTK2) immunolabelling intensities in neurons: (A) strong positivity (3+); (B) moderate positivity (2+); (C) mild positivity (1+); (D) negative (0). The protein was visualized by 3,3′‐diaminobenzidine (DAB) chromogen. Nuclear counterstain with hematoxylin. Scale bar: 10 μm.
2.5. FDL‐IHC Image Analysis
Immunofluorescence microscopy was performed with an Axio Imager Z2 microscope equipped with 20×/0.5 420350‐9900 EC Plan‐Neofluar objective, Coolcube 1m S/N: 003274. 60N‐C 1ʺ 1.0× 426114 camera and appropriate filter sets (Carl Zeiss AG). For digital image acquisition we used Isis fluorescence imaging platform (MetaSystems Hard & Software GmbH). Five photos/cases were taken randomly at medium magnification (200×) with the same illumination intensities, exposure times and camera settings.
For digital image analysis of phospho‐tau (green) and LMTK2 (red) fluorescent signals ImageJ software was used applying the following subtle methods: (a) Merged (red and green channels superimposed) images belonging to the same case were gathered into a stack. RGB stack images were downgraded to 8‐bit grey intensity scale, but the original red and green channel data were kept for redirected measurements, in order to be able to perform quantitative analysis on the two proteins.
(b) Thresholding was executed with values manually adjusted if needed. (c) For neuronal phospho‐
tau/LMTK2 signal quantification, objects greater than 400 pixel size were processed with the aforementioned red and green channel redirection type measurements, resulting in red and green channel raw integrated density data columns corresponding to the same area value of the given ROI on the image.
Based on the relation of phospho‐tau and LMTK2, our assumption was that the sum of their signals can be considered invariable on the fluorescent images (Figure 3). Direct comparison of their relative intensity on the images was performed by evaluating the proportion of the green (phospho‐
tau) and red (LMTK2) signals, respectively, against their sum in every case (Figure 4) We analyzed more than fourteen thousand ROIs altogether. After the case‐based evaluation, group level analysis was performed by transforming the red and green channel data (Figure 5).
Transformation was based on the following equation:
R − G/R + G = X (1) where R is the percentage of measured red (LMTK2) signal, G is the percentage of measured green (phospho‐tau) signal and X can take a value between +1 and ‐1. If X = +1, this means that 100% red signal was measured, and if X = −1, then 100% green signal was observed, corresponding to the measured neurons of groups.
It is important to emphasize that while CHR‐IHC analysis was carried out to compare the mean LMTK2 intensity scores between the groups, FDL‐IHC was performed in order to evaluate the percentage distribution of phospho‐tau/LMTK2 signals within an experimental group.
2.6. Statistical Analysis
In the case of CHR‐IHC both normality test (Shapiro‐Wilk) and equal variance test passed, allowing us to apply t‐test to compare pairwise the mean intensity scores of the groups: early stage MFG vs. early stage aHPC, early stage MFG vs. late stage MFG, early stage MFG vs. late stage aHPC, late stage MFG vs. early stage aHPC, late stage MFG vs. late stage aHPC, early stage aHPC vs. late stage aHPC (Figure 2). In addition, analysis of covariance (ANCOVA) was also run to test to influence of age, final MMSE score and APOE gene polymorphism on the LMTK2 results. We used SPSS 25 (IBM Corp.) software for statistical analysis; the dependent variable was LMTK2 CHR‐IHC data, fixed factors were Braak tau stages and the brain regions, while covariates were age, final MMSE score and APOE gene polymorphism. FDL‐IHC data did not follow normal distribution (Shapiro‐
Wilk test failed), therefore Spearman’s correlation test was applied to define the association between phospho‐tau and LMTK2 fluorescent signals within the experimental groups (Table 2.).
3. Results
3.1. Chromogenic Immunohistochemistry (CHR‐IHC)
We assessed 1215 neurons across different neuropathological Braak tau stages of AD in the two key brain regions (MFG and aHPC). The average labelling intensity of cases varied between 2.13–
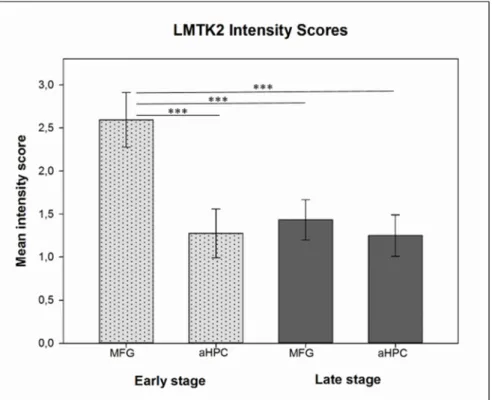
2.92, 1.07–1.7, 1.22–1.81 and 1.00–1.55 in the early neuropathological stage MFG, early neuropathological stage aHPC, late neuropathological stage MFG and late neuropathological stage aHPC, respectively. However, their standard deviations were almost identical and results followed normal distribution rendering them suitable for statistical analysis. The calculated mean intensity scores were 2.59, 1.28, 1.43 and 1.24 for early neuropathological stage MFG, aHPC and late neuropathological stage MFG, aHPC, respectively.
In the three NFT‐affected brain regions (aHPC in early neuropathological stage and aHPC and MFG in late neuropathological stage) we detected statistically significant alteration (p < 0.001) in the mean LMTK2 immunolabelling intensity scores compared to the relatively spared middle frontal gyrus in early neuropathological stage (Figure 2). Among the LMTK2 intensity scores of the three NFT‐affected regions there were no statistically significant differences. According to ANCOVA, neither age (p = 0.137) nor final MMSE score (p = 0.132) nor APOE gene polymorphism (p = 0.253) significantly influenced the LMTK2 CHR‐IHC results.
Figure 2. Histogram depicts the mean chromogenic lemur tyrosine kinase 2 (LMTK2) intensity scores in the middle frontal gyrus (MFG) and anterior hippocampus (aHPC) brain regions in early (dotted light gray columns) and late (dark gray columns) neuropathological Braak tau stage cases. Here, t‐
test showed statistically significant (p < 0.001 (***)) differences between pairwise comparison of the mean intensity scores of early neuropathological stage MFG group (endogenous control—spared from neurofibrillary tangles (NFTs)) vs. NFT‐affected groups (aHPC in early neuropathological stage and both regions in late neuropathological stage).
3.2. Fluorescent Double‐Labelling Immunohistochemistry (FDL‐IHC)
Phospho‐tau/LMTK2 FDL‐IHC showed LMTK2 predominance in the endogenous control group (MFG in early neuropathological stage), while phospho‐tau overburden and decreased LMTK2 immunolabelling were detected in NFT‐affected groups (aHPC in early and both regions in late neuropathological stage) (Figure 3). The measured percentage distribution of phospho‐tau/LMTK2 values of the individual cases are visualized in Figure 4. Group level comparison of LMTK2 (red) and phospho‐
tau (green) fluorescent signals, derived from the case‐based evaluation, are shown in Figure 5.
Figure 3. Lemur tyrosine kinase 2 (LMTK2) and phospho‐tau fluorescent double‐labelling immunohistochemistry in the middle frontal gyrus (MFG) in early (A–C) and late (D–F) neuropathological Braak tau stages. LMTK2 immunolabelling (red) dominates the early neuropathological stage (A,C), which is spared by neurofibrillary tangles (NFT), while there is an obvious phospho‐tau burden (E,F) with decreased LMTK2 positivity (D) in the late neuropathological stage. LMTK2 and phospho‐tau were visualized by Alexa Fluor 594 and Alexa Fluor 488 fluorescent dyes, respectively. Scale bar: 50 μm.
Figure 4. Bars depict the mean level (in %) of fluorescence for red (lemur tyrosine kinase‐2 (LMTK2)) and green (phospho‐tau) channels of images from the middle frontal gyrus (MFG) and anterior hippocampus (aHPC) in early and late neuropathological Braak tau stages.
Figure 5. Phospho‐tau and lemur tyrosine kinase 2 (LMTK2) double‐labelling fluorescent immunohistochemistry signals of the middle frontal gyrus (MFG) and anterior hippocampus (aHPC) in early (dotted light gray boxes) and late (dotted dark gray boxes) neuropathological Braak tau stages are quantified. Boxes represent the interquartile range of the fluorescence signal of phospho‐tau (green) and LMTK2 (red) on a unified scale (−1 to +1) with mean levels indicated by black lines. (−1 corresponds to 100% phospho‐tau signal compared to 0% LMTK2; +1 means 100% LMTK2 signal and 0% phospho‐tau.).
Statistical analysis (Spearman’s correlation) was performed on the red (LMTK2) and green (phospho‐tau) channel data of more than fourteen thousand ROIs to assess correlation. Perfect negative correlation (Spearman rank order correlation coefficient = −1) was observed in each experimental group. Statistical information for early and late neuropathological stage groups is shown in Table 2.
Table 2. Statistical analysis of lemur tyrosine kinase 2 (LMTK2) (red)/phospho‐tau (green) fluorescent signal correlation in the middle frontal gyrus (MFG) and anterior hippocampus (aHPC) in early and late neuropathological Braak tau stages
Early stage Late stage
MFG aHPC MFG aHPC
Spearman Rank Order Correlation Coefficient −1 −1 −1 −1 p‐Value 0.0000002 0.0000002 0.0000002 0.0000002 Mean (Red; Green) 0.946 0.054 0.349 0.651 0.273 0.727 0.215 0.785
Standard deviation 0.087 0.233 0.237 0.159
Standard error 0.00175 0.00468 0.00349 0.00238
Number of pairs examined 2464 2478 4609 4457
4. Discussion
The CHR‐IHC immunolabelling of LMKT2 is significantly decreased in the NFT‐affected regions compared to the relatively spared endogenous control region. Visualization of NFTs with phospho‐
tau/LMTK2 FDL‐IHC further supported the CHR‐IHC findings. In the endogenous control group LMTK2 immunolabelling dominated over the sparse phospho‐tau positivity, while the NFT‐affected regions displayed decreased LMTK2 immunopositivity (Figure 3). Pearson’s statistical test showed
perfect negative correlation with phospho‐tau/LMTK2 FDL signals within each group. This means that the expression of LMTK2 is inversely proportionate to the extent of phospho‐tau/NFT pathology.
ANCOVA further strongly supported these findings, because neither age nor final MMSE nor APOE gene polymorphism significantly influenced the LMTK2 CHR‐IHC results. Consequently, LMTK2 reduction is not a general feature of AD brains, rather it is characteristic of the NFT‐affected regions.
In accordance with our findings, recent studies have shown decreased LMTK2 level in AD [12,13,19]. A genome‐wide gene expression analysis detected reduced LMTK2 expression in the cortex of transgenic Tau P301L mice [19]. Mórotz et al. recently reported a western blot analysis on postmortem human brain tissues [12]. They established three experimental groups based on the Braak tau stages (control—Braak I–II; mild dementia—Braak III–IV; severe dementia—Braak V–VI).
The expression of LMTK2 decreased in the cortex with the progression of NFT pathology. However, the investigated region(s) of the frontal cortex were not specified, thus direct comparison with our results is not possible. In our previous paper we reported significantly decreased immunolabelling in the middle frontal gyrus of patients with Braak stage VI pathology compared to age‐matched controls and neocortical Lewy body disease (LBD) cases [13]. Because LBD‐specific Lewy body‐
bearing neurons showed strong LMTK2 immunoreaction and Lewy bodies themselves were negative, we hypothesized that the decreased average immunopositivity (compared to controls) was due to coexisting AD‐type pathology. The association between LMTK2 expression and the regional distribution of NFT pathology has been confirmed experimentally in the current study. However, the question as to whether LMTK2 reduction or tau hyperphosphorylation is the primary event remains to be answered.
In a recent review on LMTK2 we proposed that decreased protein activity or expression may contribute to tau hyperphosphorylation [11]. While analysis of LMTK2 signaling is beyond the scope of our current work, recent cell biological studies have shed light on the interaction between phospho‐
tau and LMTK2. Under physiological circumstances, LMTK2 is activated by cyclin‐dependent kinase 5 (CDK5)/p35‐mediated phosphorylation [22], hence LMTK2 phosphorylates the catalytic subunit of protein phosphatase 1 (PP1) leading to the inhibition of the enzyme [17,22,23]. PP1 cannot effectively remove inhibitory phosphoryl groups from glycogen synthase kinase‐3β (GSK3β), resulting in decreased GSK3β activity [17,23,24]. CDK5 and GSK3β are well‐known major tau kinases [25–28].
Physiologically, CKD5 can inhibit GSK3β indirectly via the LMTK2‐mediated signaling pathway [29–
31], whereas in AD, caspase overactivation leads to cleavage of cofactor p35 into p25 and p10 [32–37].
The generated CDK5/p25 complex has prolonged half‐life and activity contributing to tau hyperphosphorylation [33,36–38]. Interestingly, p25 exhibited weaker binding affinity to LMTK2 than p35 in yeast two‐hybrid screen [22] suggesting that prolonged CDK5/p25 activity induces less LMTK2 activation than CDK5/p35. The decreased LMTK2 activity results in the disinhibition of PP1 as well as the indirect overactivation of GSK3β, which is a critical event in AD pathogenesis [25,26,28].
In AD the functional impairment of LMTK2 is associated with its decreased expression.
However, there are no available experimental data on the mechanism(s) leading to reduced LMTK2 level. Nonetheless, a recent theory suggesting that neurodegeneration is the cancer of neurons may serve as a potential explanation [39–41]. Because neurons are terminally differentiated cells it is possible that certain noxious stimuli which cause uncontrolled proliferation in other organs result in aberrant cell cycle re‐entry with degenerative changes and apoptosis in nerve cells [42–47]. The role of LMTK2 has been investigated in several malignancies, particularly in prostate cancer [48–51].
Harries et al. reported reduced LMTK2 expression in prostate adenocarcinoma, compared to benign prostate hyperplasia [50]. They proposed that a previously described [52] rs6465657 single nucleotide polymorphism (SNP) in the intron 9 of LMTK2 in prostate cancer is a loss‐of function variant contributing to tumorigenesis; thereby, LMTK2 acts as a tumor suppressor/proapoptotic protein.
Aberrant cell cycle reactivation increases cyclin D and cyclin E expression as well as enhances the G1 and G2 phase cyclin dependent kinases’ (CDKs) activity resulting in retinoblastoma protein phosphorylation and accompanying E2F release in neurons [53–58]. E2F suppresses the expression of proapoptotic genes and transactivates downstream cell cycle genes, leading to the progression of this ultimately lethal cycle [59]. Theoretically, considering LMTK2 as a proapoptotic protein, it is
possible that E2F reduces its level by transcriptional silencing. However, the interaction between E2F and the LMTK2 gene remains to be proven.
5. Conclusions
In summary, there is a negative correlation between the regional expression of LMTK2 and the severity of NFT pathology, validated by both CHR‐IHC and FDL‐IHC methods. While CHR‐IHC analysis compared the mean LMTK2 intensity scores based on Braak tau staging, FDL‐IHC evaluated the phospho‐tau/LMTK2 percentage distribution within each experimental group. Age, final MMSE and APOE gene polymorphism did not influence the LMTK2 CHR‐IHC results. It has been demonstrated that LMTK2 reduction is strongly associated with NFT pathology and it is not a tau‐
independent feature. Further studies are needed to explore the pharmacological manipulation of LMTK2‐related pathways [60] as a therapeutic option in AD.
Author Contributions: Conception and design of the study by J.B., T.H. and M.Sz. Original draft preparation by J.B.; aided by T.H., V.B., R.N.S. and L.V.M. Immunohistochemistry was performed by J.B., V.B., R.N.S. and L.V.M. Methodology and data analysis by J.B., M.Sz. and T.H. Revision and editing by J.B., M.Sz., T.H. and D.A.
Supervision and project administration by T.H. and D.A. All authors have read and agreed to the published version of the manuscript.
Funding: Supported by the ÚNKP‐19‐3 New National Excellence Program of the Ministry of Innovation and Technology (J.B.); EFOP‐3.6.3‐VEKOP‐16‐2017‐00009 (J.B., M.Sz. and V.B.); ÚNKP‐19‐2 New National Excellence Program of the Ministry of Innovation and Technology (V.B.); GINOP‐2.3.2‐15‐2016‐00043, Hungarian Brain Research Program (2017‐1.2.1‐NKP‐2017‐00002), NKFIH SNN 132999; SZTE ÁOK‐KKA No. 5S 567 (A202) and DE ÁOK Research Fund (T.H.). This paper represents independent research partly funded by the National Institute for Health Research (NIHR) Biomedical Research Centre at South London and Maudsley NHS Foundation Trust and King’s College London. The views expressed are those of the authors and not necessarily those of the NHS, the NIHR or the Department of Health and Social Care.
Acknowledgments: We would like to express our gratitude to CCJ Miller and Gábor Mórotz (IOPPN, King’s College London) for discussions; the software engineers and staff of Vitrolink Ltd., in particular Máté Smajda, Balázs Kóti, Gergely Kövér, Tamás Kószó, Zsolt Kovács and István Szarka, for making the platform available for the study. Special thanks to Orsolya Matolay for her assistance with fluorescent microscopy.
Conflicts of Interest: The authors declare no conflict of interest.
Abbreviations ANCOVA AD APOE
Analysis of covariance Alzheimer’s disease Apolipoprotein E aHPC Anterior hippocampus CDK5 Cyclin‐dependent kinase 5 CHR Chromogenic
DAB 3,3’‐diaminobenzidine tetrahydrochloride EDTA Ethylenediaminetetraacetic acid
Fab Fragment antigen‐binding Fc Fragment crystallizable FDL Fluorescent double‐labelling GSK3β Glycogen synthase kinase‐3β IHC Immunohistochemistry LBD Lewy body disease LMTK2 Lemur tyrosine kinase 2 MFG
MMSE
Middle frontal gyrus
Mini‐mental state examination NFT Neurofibrillary tangles PP1 Protein phosphatase 1 ROI Region of interest
SNP Single nucleotide polymorphism
References
1. Alzheimer’s Association. 2017 Alzheimer’s disease facts and figures. Alzheimer’s Dement. 2017, 13, 325–373.
2. Hippius, H.; Neundörfer, G. The discovery of Alzheimer’s disease. Dialogues Clin. Neurosci. 2003, 5, 101–
108.
3. Bereczki, E.; Francis, P.T.; Howlett, D.; Pereira, J.B.; Höglund, K.; Bogstedt, A.; Cedazo‐Minguez, A.; Baek, J.H.; Hortobágyi, T.; Attems, J.; et al. Synaptic proteins predict cognitive decline in Alzheimer’s disease and Lewy body dementia. Alzheimer’s Dement. 2016, 12, 1149–1158.
4. Tiwari, S.S.; D’Orange, M.; Troakes, C.; Shurovi, B.N.; Engmann, O.; Noble, W.; Hortobágyi, T.; Giese, K.P.
Evidence that the presynaptic vesicle protein CSPalpha is a key player in synaptic degeneration and protection in Alzheimer’s disease. Mol. Brain 2015, 8, 6.
5. Guo, T.; Noble, W.; Hanger, D.P. Roles of tau protein in health and disease. Acta Neuropathol. 2017, 133, 665–704.
6. Bereczki, E.; Branca, R.M.; Francis, P.T.; Pereira, J.B.; Baek, J.‐H.; Hortobágyi, T.; Winblad, B.; Ballard, C.;
Lehtiö, J.; Aarsland, D. Synaptic markers of cognitive decline in neurodegenerative diseases: A proteomic approach. Brain 2018, 141, 582–595.
7. Kopke, E.; Tung, Y.C.; Shaikh, S.; Del Alonso, C.A.; Iqbal, K.; Grundke‐Iqbal, I. Microtubule‐associated protein tau. Abnormal phosphorylation of a non‐ paired helical filament pool in Alzheimer disease. J. Biol.
Chem. 1993, 268, 24374–24384.
8. Alonso, A.D.C.; Grundke‐Iqbal, I.; Barra, H.S.; Iqbal, K. Abnormal phosphorylation of tau and the mechanism of Alzheimer neurofibrillary degeneration: Sequestration of microtubule‐associated proteins 1 and 2 and the disassembly of microtubules by the abnormal tau. Proc. Natl. Acad. Sci. 1997, 94, 298–303.
9. Braak, H.; Braak, E. Neuropathological stageing of Alzheimer‐related changes. Acta Neuropathol. 1991, 82, 239–259.
10. Avila, J.; Lucas, J.J.; Pérez, M.; Hernández, F. Role of Tau Protein in Both Physiological and Pathological Conditions. Physiol. Rev. 2004, 84, 361–384.
11. Bencze, J.; Mórotz, G.M.; Seo, W.; Bencs, V.; Kálmán, J.; Miller, C.C.J.; Hortobagyi, T. Biological function of Lemur tyrosine kinase 2 (LMTK2): implications in neurodegeneration. Mol. Brain 2018, 11, 20.
12. Mórotz, G.M.; Glennon, E.B.; Gomez‐Suaga, P.; Lau, D.H.W.; Robinson, E.D.; Sedlák, Éva; Vagnoni, A.; Noble, W.; Miller, C.C.J. LMTK2 binds to kinesin light chains to mediate anterograde axonal transport of cdk5/p35 and LMTK2 levels are reduced in Alzheimer’s disease brains. Acta Neuropathol. Commun. 2019, 7, 73.
13. Bencze, J.; Szarka, M.; Bencs, V.; Szabó, R.N.; Smajda, M.; Aarsland, D.; Hortobágyi, T. Neuropathological characterization of Lemur tyrosine kinase 2 (LMTK2) in Alzheimer’s disease and neocortical Lewy body disease. Sci. Rep. 2019, 9, 1–9.
14. Kawa, S.; Fujimoto, J.; Tezuka, T.; Nakazawa, T.; Yamamoto, T. Involvement of BREK, a serine/threonine kinase enriched in brain, in NGF signalling. Genes Cells 2004, 9, 219–232.
15. Wang, H.; Brautigan, D.L. Peptide Microarray Analysis of Substrate Specificity of the Transmembrane Ser/Thr Kinase KPI‐2 Reveals Reactivity with Cystic Fibrosis Transmembrane Conductance Regulator and Phosphorylase. Mol. Cell. Proteom. 2006, 5, 2124–2130.
16. Wang, H.; Brautigan, D.L. A Novel Transmembrane Ser/Thr Kinase Complexes with Protein Phosphatase‐
1 and Inhibitor‐2. J. Boil. Chem. 2002, 277, 49605–49612.
17. Manser, C.; Guillot, F.; Vagnoni, A.; Davies, J.; Lau, K.F.; McLoughlin, D.M.; De Vos, K.J.; Miller, C.C.J.
Lemur tyrosine kinase‐2 signalling regulates kinesin‐1 light chain‐2 phosphorylation and binding of Smad2 cargo. Oncogene 2012, 31, 2773–2782.
18. Conti, A.; Majorini, M.T.; Fontanella, E.; Bardelli, A.; Giacca, M.; Delia, D.; Mano, M.; Lecis, D. Lemur tyrosine kinase 2 (LMTK2) is a determinant of cell sensitivity to apoptosis by regulating the levels of the BCL2 family members. Cancer Lett. 2017, 389, 59–69.
19. Matarin, M.; Salih, D.A.; Yasvoina, M.; Cummings, D.M.; Guelfi, S.; Liu, W.; Solim, M.A.N.; Moens, T.G.;
Paublete, R.M.; Ali, S.S.; et al. A Genome‐wide Gene‐Expression Analysis and Database in Transgenic Mice during Development of Amyloid or Tau Pathology. Cell Rep. 2015, 10, 633–644.
20. Rongve, A.; Sønnesyn, H.; Skogseth, R.; Aarsland, D. A 5‐year longitudinal study of patients with dementia with lewy bodies and Alzheimer’s disease. Alzheimer’s Dement. 2014, 10, P261.
21. Skogseth, R.E.; Hortobágyi, T.; Soennesyn, H.; Chwiszczuk, L.; Ffytche, D.; Rongve, A.; Ballard, C.;
Aarsland, D. Accuracy of Clinical Diagnosis of Dementia with Lewy Bodies versus Neuropathology. J.
Alzheimer’s Dis. 2017, 59, 1139–1152.
22. Kesavapany, S.; Lau, K.‐F.; Ackerley, S.; Banner, S.J.; Shemilt, S.J.A.; Cooper, J.D.; Leigh, P.N.; Shaw, C.E.;
McLoughlin, D.M.; Miller, C.C.J. Identification of a Novel, Membrane‐Associated Neuronal Kinase, Cyclin‐
Dependent Kinase 5/p35‐Regulated Kinase. J. Neurosci. 2003, 23, 4975–4983.
23. Manser, C.; Vagnoni, A.; Guillot, F.; Davies, J.; Miller, C.C.J. Cdk5/p35 phosphorylates lemur tyrosine kinase‐2 to regulate protein phosphatase‐1C phosphorylation and activity. J. Neurochem. 2012, 121, 343–348.
24. Morfini, G.; Szebenyi, G.; Brown, H.; Pant, H.C.; Pigino, G.; DeBoer, S.; Beffert, U.; Brady, S.T. A novel CDK5‐dependent pathway for regulating GSK3 activity and kinesin‐driven motility in neurons. EMBO J.
2004, 23, 2235–2245.
25. Pei, J.‐J.; Braak, E.; Braak, H.; Grundke‐Iqbal, I.; Iqbal, K.; Winblad, B.; Cowburn, R.F. Distribution of Active Glycogen Synthase Kinase 3β (GSK‐3β) in Brains Staged for Alzheimer Disease Neurofibrillary Changes. J.
Neuropathol. Exp. Neurol. 1999, 58, 1010–1019.
26. Pei, J.J.; Grundke‐Iqbal, I.; Iqbal, K.; Bogdanovic, N.; Winblad, B.; Cowburn, R.F. Accumulation of cyclin‐
dependent kinase 5 (cdk5) in neurons with early stages of Alzheimer’s disease neurofibrillary degeneration. Brain Res. 1998, 797, 267–277.
27. Noble, W.; Olm, V.; Takata, K.; Casey, E.; Mary, O.; Meyerson, J.; Gaynor, K.; Lafrancois, J.; Wang, L.;
Kondo, T.; et al. Cdk5 Is a Key Factor in Tau Aggregation and Tangle Formation In Vivo. Neuron 2003, 38, 555–565.
28. Flaherty, D.B.; Soria, J.P.; Tomasiewicz, H.G.; Wood, J.G. Phosphorylation of human tau protein by microtubule‐associated kinases: GSK3β and cdk5 are key participants. J. Neurosci. Res. 2000, 62, 463–472.
29. Morfini, G.; Szebenyi, G.; Elluru, R.; Ratner, N.; Brady, S.T. Glycogen synthase kinase 3 phosphorylates kinesin light chains and negatively regulates kinesin‐based motility. EMBO J. 2002, 21, 281–293.
30. Plattner, F.; Angelo, M.; Giese, K.P. The Roles of Cyclin‐dependent Kinase 5 and Glycogen Synthase Kinase 3 in Tau Hyperphosphorylation. J. Boil. Chem. 2006, 281, 25457–25465.
31. Feng, D.D.; Cai, W.; Chen, X.; Bajaj, A.; Driver, J.; Schernhammer, E.; Catalá‐López, F.; Suárez‐Pinilla, M.;
Suárez‐Pinilla, P.; Valderas, J.; et al. The associations between Parkinson’s disease and cancer: The plot thickens. Transl. Neurodegener. 2015, 4, 20.
32. Kusakawa, G.‐I. Calpain‐dependent Proteolytic Cleavage of the p35 Cyclin‐dependent Kinase 5 Activator to p25. J. Boil. Chem. 2000, 275, 17166–17172.
33. Patrick, G.N.; Zukerberg, L.; Nikolic, M.; De La Monte, S.; Dikkes, P.; Tsai, L.‐H. Conversion of p35 to p25 deregulates Cdk5 activity and promotes neurodegeneration. Nat. 1999, 402, 615–622.
34. Lee, M.‐S.; Kwon, Y.T.; Li, M.; Peng, J.; Friedlander, R.M.; Tsai, L.‐H. Neurotoxicity induces cleavage of p35 to p25 by calpain. Nature 2000, 405, 360–364.
35. Nath, R.; Davis, M.; Probert, A.W.; Kupina, N.C.; Ren, X.; Schielke, G.P.; Wang, K.K.W. Processing of cdk5 activator p35 to its truncated form (p25) by calpain in acutely injured neuronal cells. Biochem. Biophys. Res.
Commun. 2000, 274, 16–21.
36. Peterson, D.W.; Ando, D.M.; Taketa, D.A.; Zhou, H.; Dahlquist, F.W.; Lew, J. No difference in kinetics of tau or histone phosphorylation by CDK5/p25 versus CDK5/p35 in vitro. Proc. Natl. Acad. Sci. 2010, 107, 2884–2889.
37. Patrick, G.N.; Zhou, P.; Kwon, Y.T.; Howley, P.M.; Tsai, L.‐H. p35, the neuronal‐specific activator of cyclin‐
dependent kinase 5 (Cdk5) is degraded by the ubiquitin‐proteasome pathway. J. Boil. Chem. 1998, 273, 24057–24064.
38. Engmann, O.; Hortobágyi, T.; Thompson, A.J.; Guadagno, J.; Troakes, C.; Soriano, S.; Al‐Sarraj, S.; Kim, Y.;
Giese, K.P. Cyclin‐dependent kinase 5 activator p25 Is generated during memory formation and is reduced at an early stage in Alzheimer’s disease. Biol. Psychiatry 2011, 70, 159–168.
39. Houck, A.L.; Seddighi, S.; Driver, J.A. At the Crossroads Between Neurodegeneration and Cancer: A Review of Overlapping Biology and Its Implications. Curr. Aging Sci. 2018, 11, 77–89.
40. Plun‐Favreau, H.; Lewis, P.A.; Hardy, J.; Martins, L.M.; Wood, N.W. Cancer and Neurodegeneration:
Between the Devil and the Deep Blue Sea. PLoS Genet. 2010, 6, e1001257.
41. Du, L.; Pertsemlidis, A. Cancer and neurodegenerative disorders: pathogenic convergence through microRNA regulation. J. Mol. Cell Boil. 2011, 3, 176–80.
42. Monaco, E.; Vallano, M. Lou Role of protein kinases in neurodegenerative disease: Cyclin‐dependent kinases in Alzheimer’s disease. Front. Biosci. 2005, 10, 143–159.
43. Ahn, K.W.; Joo, Y.; Choi, Y.; Kim, M.; Lee, S.H.; Cha, S.H.; Suh, Y.H.; Kim, H.S. Swedish amyloid precursor protein mutation increases cell cycle‐related proteins in vitro and in vivo. J. Neurosci. Res. 2008, 86, 2476–2487.
44. Giovanni, A.; Wirtz‐Brugger, F.; Keramaris, E.; Slack, R.; Park, D.S. Involvement of cell cycle elements, cyclin‐dependent kinases, pRb, and E2F x DP, in B‐amyloid‐induced neuronal death. J. Boil. Chem. 1999, 274, 19011–6.
45. Becker, E.B.; Bonni, A. Cell cycle regulation of neuronal apoptosis in development and disease. Prog.
Neurobiol. 2004, 72, 1–25.
46. Currais, A.; Hortobágyi, T.; Soriano, S. The neuronal cell cycle as a mechanism of pathogenesis in Alzheimer’s disease. Aging (Albany. NY) 2009, 1, 363–371.
47. Malik, B.; Currais, A.; Andres, A.; Towlson, C.; Pitsi, D.; Nunes, A.; Niblock, M.; Cooper, J.; Hortobágyi, T.;
Soriano, S. Loss of neuronal cell cycle control as a mechanism of neurodegeneration in the Presenilin‐1 Alzheimer’s disease brain. Cell Cycle 2008, 7, 637–646.
48. Shah, K.; Bradbury, N.A. Lemur Tyrosine Kinase 2, a novel target in prostate cancer therapy. Oncotarget 2015, 6, 14233–14246.
49. Shah, K.; Bradbury, N.A. Kinase modulation of androgen receptor signaling: implications for prostate cancer. Cancer Cell Microenviron. 2015, 2, 2.
50. Harries, L.W.; Perry, J.R.; Mccullagh, P.; Crundwell, M. Alterations in LMTK2, MSMB and HNF1B gene expression are associated with the development of prostate cancer. BMC Cancer 2010, 10, 315.
51. Seo, J.‐S.; Ju, Y.S.; Lee, W.‐C.; Shin, J.‐Y.; Lee, J.‐K.; Bleazard, T.; Lee, J.; Jung, Y.J.; Kim, J.‐O.; Shin, J.‐Y.; et al.
The transcriptional landscape and mutational profile of lung adenocarcinoma. Genome Res. 2012, 22, 2109–19.
52. A Eeles, R.; The UK Genetic Prostate Cancer Study Collaborators; Kote‐Jarai, Z.; Giles, G.G.; Al Olama, A.A.; Guy, M.; Jugurnauth, S.K.; Mulholland, S.; A Leongamornlert, D.; Edwards, S.M.; et al. Multiple newly identified loci associated with prostate cancer susceptibility. Nat. Genet. 2008, 40, 316–321.
53. Konishi, Y.; Lehtinen, M.; Donovan, N.; Bonni, A. Cdc2 Phosphorylation of BAD Links the Cell Cycle to the Cell Death Machinery. Mol. Cell 2002, 9, 1005–1016.
54. Copani, A.; Condorelli, F.; Caruso, A.; Vancheri, C.; Sala, À.; Stella, A.M.G.; Canonico, P.L.; Nicoletti, F.;
Sortino, M.A. Mitotic signaling by β‐amyloid causes neuronal death. FASEB J. 1999, 13, 2225–2234.
55. Park, D.S.; Farinelli, S.E.; Greene, L.A. Inhibitors of Cyclin‐dependent Kinases Promote Survival of Post‐
mitotic Neuronally Differentiated PC12 Cells and Sympathetic Neurons. J. Boil. Chem. 1996, 271, 8161–8169.
56. Park, D.S.; Levine, B.; Ferrari, G.; Greene, L.A. Cyclin Dependent Kinase Inhibitors and Dominant Negative Cyclin Dependent Kinase 4 and 6 Promote Survival of NGF‐Deprived Sympathetic Neurons. J. Neurosci.
1997, 17, 8975–8983.
57. Freeman, R.S.; Estus, S.; Johnson, E.M. Analysis of cell cycle‐related gene expression in postmitotic neurons:
Selective induction of cyclin D1 during programmed cell death. Neuron 1994, 12, 343–355.
58. Padmanabhan, J.; Park, D.S.; Greene, L.A.; Shelanski, M.L. Role of Cell Cycle Regulatory Proteins in Cerebellar Granule Neuron Apoptosis. J. Neurosci. 1999, 19, 8747–8756.
59. Liu, D.X.; A Greene, L. Regulation of neuronal survival and death by E2F‐dependent gene repression and derepression. Neuron 2001, 32, 425–438.
60. Dey, I.; Bradbury, N.A. Activation of TPA‐response element present in human Lemur Tyrosine Kinase 2 (lmtk2) gene increases its expression. Biochem. Biophys. Rep. 2017, 12, 140–150.
© 2020 by the authors; licensee MDPI, Basel, Switzerland. This article is an open access article distributed under the terms and conditions of the Creative Commons Attribution (CC BY) license (http://creativecommons.org/licenses/by/4.0/).