the Science of Orientation
Pallas Athene Geopolitical Institute
Authors of the volume:
Péter Bajmócy, Dániel Balizs, Francesca Comunello, Zoltán Cséfalvay, Judit Dobák, Andrea Dúll, Éva Izsák, László Letenyei, Antal Lovas Kiss, Sorin Adam Matei, András Morauszki, Kamil Nieścioruk, Slobodan Ocokoljić, Viktória Pap, Lorenza Parisi,
Gyöngyi Pásztor, Zsolt Szijártó, Barbara Tversky, Kelly Vibber.
IMMAP International Mental Map Association Platform
© Authors 2020
© Schenk Verlag 2020
Responsible editor: the director/manager of Schenk Verlag Cover: Éva Szalay
Schenk Verlag GmbH, Passau www.schenkverlag.com
ISBN: 78-3-944850-78-8
Judit Dobák eds.:
Mental Mapping
the Science of Orientation
new approaches to location – Spatial patterns of the global economy Conference
Budapest, 5–7 November 2019
Supported by: pallas athene geopolitical institute
Schenk Verlag 2020
Preface ... 7
Barbara Tversky: Cognitive maps, cognitive collages, and spatial mental models ... 11
Zoltán Cséfalvay: The “Legible” City ... 23
Andrea Dúll: Things and Places: The Meaning of the Physical Environment from an Environmental Psychology and Environmental Communication Perspective ... 35
Cross-border and transnational studies ... 49
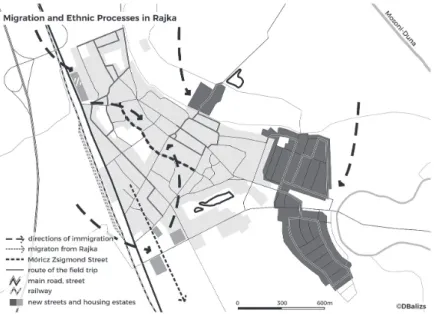
Péter Bajmócy - Dániel Balizs: Rajka – Rapid changes of social, architectural and ethnic character of a cross-border suburban village of Bratislava in Hungary ... 49
László Letenyei, András Morauszki: Who Reaps The Benefits Of Permeable Borders? Mental Maps, Networks And Language Skills In The Hungarian-Slovakian Border-Region ... 71
Sorin Adam Matei (Purdue University, USA) Lorenza Parisi (Link Campus University, Italy), Francesca Comunello (Lumsa University, Italy), Kelly Vibber (University of Dayton, USA): Alterpodes: Communication biases in plausible reasoning about geographic perception of place and space ... 93
Slobodan Ocokoljić: Perception of the Borderlands in Serbia ... 113
Urban spaces ... 137
Antal Lovas Kiss: How dog owners perceive public space when walking their dogs? .... 137
Judit Dobák: Space and social hierarchy. Results of a longitudinal study with mental maps ... 151
Gyöngyi Pásztor: Mănăștur Image(s), Mănăștur Awareness(es) The Mental Map of a Communist District of the City of Cluj, Romania ... 173
Kamil Nieścioruk: Learning the space. The change of spatial cognition of a city centre by high-school students in the light of mental maps and sketches ... 187
Urban spaces in a new perspective ... 201
Zsolt Szijártó: Urban ethnic Community research. Cultural mapping ... 201
Éva Izsák: Urban „Space-Twists” – New Challenges of Urban Geography ... 217
Viktória Pap: Researching the spirit of place at a festival. Mental mapping on Sziget Festival ... 223
Although it may seem to look like a book at first sight (prima faciae), the Reader is holding a business card in his/her hands: the visiting card of Hungarian and Central- Eastern European researchers dealing with mental mapping. The Reader may now ask back: ‘researchers dealing with what?’
The notion is not new, yet it had never become widespread enough to make an explanation useless.
Mental mapping is the science of orientation.
Orientation is an important part of our lives, we use it in several fields, and mental mapping is accordingly and interdisciplinary area, primarily falling into the realms of interest of environmental psychology, cultural anthropology, geography and urbanism.
Questions in these different areas are similar to one another: How do we get some- where? How do we use space? What makes something in space visible for the audience? These questions are not irrelevant from a practical point of view either, in marketing, urban development, or the development of tourist destinations or systems of navigation. The digital support of orientation, the evolution of self-driving systems make the science of orientation face serious challenges.
The expression of “mental” or “cognitive map” is a notion used for different things in different disciplines. The number of misinterpretations is increased by the oc- currence of many similar notions with a different meaning, like value map, concept map, semantic map etc. The definition used as the most frequent synonym is cog- nitive map. According to some opinions, cognitive or mental mapping means two different things in the word usage of psychology and social geography. It looks like as if the subject of research was inverted: geography collects knowledge about space, while cognitive map in the interpretation of psychology maps knowledge, i.e. it is engaged in creating a “map” of the meaning structures of consciousness. Other researchers on the other hand (e.g. Barbara Tversky, also appearing in our volume) consider that there is no difference between the two types of notion usage, as in both cases we are dealing with the discovery, the mapping of consciousness contents;
and when consciousness is examined, it would be impossible to narrow down the inquiry to the things related to space, because cognitive processes can only be understood in their complexity.
The STrUcTUre of The VolUme
The present volume is not a typical conference volume. Although it was compiled following a conference organised in 2019, our aim was not to present the newest writings or the currently undergoing research projects of the participants, but rather to summarise their most inspiring studies. The aim of the collection is to enhance dialogue in the quickly developing fields of orientation science, between the areas of application and the academic sphere. The conference volume brings out a few works that had had a significant influence of the definition of this field of science, alongside a few case studies that demonstrate well the areas of application of the field.The volume begins with three theoretical papers, signed by three renowned authors: Barbara Tversky, Zoltán Cséfalvay and Andrea Dúll.
The paper of American professor of cognitive psychology, Barbara Tversky focuses on the processes of spatial recognition. Her study about cognitive collages was a revelation for Central European specialists.
Economist and geographer Zoltán Cséfalvay laid the foundations connected to mental mapping in several areas of science in Hungary. The second generation of scholars is growing up on the foundations he had laid, and while he primarily starts from the angle of urban geography, his theoretical works constitute the basics of many contemporary researches.
The dynamically developing slant of environmental psychology is represented by the theoretical work of Andrea Dúll, also written in the early nineties.
The rest of the volume contains case studies. These case studies are independent of each other and do not directly reflect to one another. This is how the inquiries about dog walking, the connections between island and space experiences, the studies about housing estates in Cluj-Napoca and Miskolc, as well as the examining the theoretical and physical space delimitations of ethnically groupable communi- ties can all find their places in one book.
Our authors came from several countries and bring news about several countries.
They characteristically cross borders and ethnic boundaries. It seems like our authors were trying to dissolve the usual conceptions of cartography, and the legally existing social group frameworks. Several corners of Central Europe appear as examples, one could mention the Berlin research field of the Hungarian researcher, or the mental mapping examination of the Slovakian and Serbian border regions.
Like every volume, the present one is also missing notable authors. We accept that our volume is not complete. Many important authors should have been necessarily included. Yet, as in the case of the great majority of volumes, we also had to set quantitative and theoretical limits. In spite of these inevitable shortcomings, we consider the volume an acceptable publication, a worthy visiting card of the Central and Eastern European researchers of mental mapping, and of the international asso- ciation of mental mappers (the International Mental Map Analysis Platform, iMMAP).
conference and VolUme
Since its establishment, the International Mental Map Association Platform has been striving to become a research workshop of international mental mapping in the Carpathian Basin, presenting and popularising the methodologies of mental mapping and its theoretical and practical applications. The conference fits into a long series: the professional events of the International Mental Map Association Platform have been organised in 2007 in Budapest, in 2011 in Timișoara and Sze- ged, in 2015, and from 2017 annually in Budapest. These events have a strong community building character: in the past years a strong community and network, a true professional workshop has formed not only of the specialists working in the Carpathian Basin, but also including researchers active on the international scene.
dedicaTion
We dedicate the present volume first of all to the fellow-professionals working in the area of practical orientation. It is a teaser volume. I encourage the reader, no matter his/her everyday occupation, to mix in it a little bit of mental map approach, from now on. Stare in wonder on his/her everyday route, the places walked in at work, ask why a place is liked or not liked in his/her own flat or in a public space.
Or as a driver, think over the route followed with the mind of a pedestrian, or that of a traveller of public transportation!
Traffic and transportation are going to face tremendous changes in the immediate future. Yet behind the glaring lights of new technologies, we always find human beings, and although technology can indeed widen the limits of perception, its theoretical frame will always remain human beings. That is why it is important to walk consciously in the spaces we are covering. Our volume wishes to provide a basis for just that.
Budapest/Passau, the 25th of September 2019
László Letenyei and Judit Dobák
Cognitive Maps, Cognitive Collages, and spatial Mental Models
abSTracT1
Although cognitive map is a popular metaphor for people’s mental representations of environments, as it is typically conceived, it is often too restrictive. Two other metaphors for mental representations are proposed and supported. Cognitive collages are consistent with research demonstrating systematic errors in memory and judgment of environmental knowledge. Yet, for some simple or well-known environments, people seem to have coherent representations of the coarse spatial relations among elements. These spatial mental models allow inference and per- spective-taking but may not allow accurate metric judgments.2
1 inTrodUcTion 1.1 Cognitive Maps
There is a popular view that people’s mental representations of environments are embodied in „cognitive maps.” Like many useful concepts, the term cognitive map has many senses, leading to inevitable misunderstandings. One prevalent sense is that cognitive maps are maplike mental constructs that can be mentally inspected.
They are presumed to be learned by gradually acquiring elements of the world, first landmarks, pointlike elements, then routes, linelike ele ments, and finally unifying the landmarks and routes with metric survey information. The appeal of this view is manifold. As cognitive, they are presumed to differ from „true” maps of the environment. Social scientists from many disciplines would be quick to bring forth evidence for that. As maps, they are presumed to be coherent wholes that reflect spatial relations among elements. As mental constructs available to mental inspection, cognitive maps are presumed to be like real maps available to real inspection, as well as like images, which, according to the classical view of mental imagery, are like internalized perceptions.
1.2 Constructionist View
In this paper, I will present evidence not compatible with the view of mental represen- tations of environments as cognitive maps. I will discuss two alternative constructionist
views of the mental representations underlying people’s knowledge of environments.
According to the constructionist view, people acquire disparate pieces of know- ledge about environments, knowledge that they use when asked to remember an environment, describe a route, sketch a map, or make a judgment about location, direction, or distance. The separate pieces include recollections of journeys, memories of maps, recall of verbal (aural or written) directions and facts, and more. As for any human memory task, it is possible that not all the relevant stored information will be retrieved when needed.
1.3 Cognitive Collages
In many instances, especially for environments not known in detail, the information relevant to memory or judgment may be in different forms, some of them not maplike at all. Some of the information may be systematically distorted as well. It is unlikely that the pieces of information can or will be organized into a single, coherent map- like cognitive structure. In these cases, rather than resembling maps, people’s internal representations seem to be more like collages. Collages are thematic overlays of multimedia from different points of view. They lack the coherence of maps, but do contain figures, partial information, and differing perspectives. In the second section, I will review some of the evidence for the notion that cognitive collage is often a more appropriate metaphor for environmental knowledge than cognitive map. That evidence shows that memory and judgment are systematically distorted and potentially contradictory, thus not easily reconcilable in a maplike structure.
1.4 Spatial Mental Models
In other situations, especially where environments are simple or well-learned, people seem to have quite accurate mental representations of spatial layouts. On close examination, these representations capture the categorical spatial relations among elements coherently, allowing perspective-taking, reorientation, and spatial inferences. In contrast to cognitive maps and cognitive collages, these have been termed spatial mental models. Unlike cognitive maps, they may not preserve metric information. Unlike cognitive collages, they do preserve coarse spatial relations coherently. These are relations that are easily comprehended from language as well as from direct experience. In the third section I will review some evidence for the success of language in inducing coherent mental representations of the categorical spatial relations in environments.
2 SySTemaTic errorS in memory for enVironmenTS 2.1 Hierarchical Representations of Space
When students at U.C. San Diego were asked to draw the direction between San Diego and Reno, they incorrectly indicated that San Diego was west of Reno [36]. Indeed, it is surprising to learn that Reno is in fact west of San Diego. After all, California is on the western coast of the United States, and Reno is far inland, in Nevada. A glance at a map reveals that the coast of California, far from running north-south, in fact cuts eastward as it cuts southward. Stevens and Coupe attribu- ted their findings to hierarchical representations of space. People do not remember the absolute locations of cities. Instead, they remember the states cities are part of, and the relative locations of the states. Then they infer the relative locations of cities from the locations of their superset states. Since this (shall I call it „landmark?”) study, other evidence for hierarchical representations of geographic knowledge has accumulated. Hierarchical organization has been found to distort distance judg- ments as well as direction judgments [11]. Hirtle and Jonides asked one group of students at the University of Michigan in Ann Arbor to form subjective groups of buildings in town. They grouped the buildings according to function, commercial or educational. Another group of students was asked to judge distances betwe- en pairs of buildings. Distances between functional groupings were overestimated relative to distances within functional groupings. Chase found that a detailed hierarchical organization distinguished experienced taxi drivers from novices [4].
Other studies have demonstrated that people impose a hierarchy on what is in reality a flat two-dimensional display, and that that affects judgment and memory for environments [for example, 12, 23, 24, 25, 44; for a brief review, see 42 and 43].
Of course there are no hierarchies in maps, so this widespread cognitive pheno- menon already introduces a distorting factor difficult to reconcile with maps.
2.2 Cognitive Perspective
Experienced hikers know that distances between nearby landmarks appear relatively larger than distances between faraway landmarks, though it is difficult to make adequate compensation for that. A similar phenomenon occurs in making distance judgments from memory. Holyoak and Mah [14] asked one group of students to imagine themselves on the East Coast of the United States, and another group to imagine themselves on the West Coast of the United States. Both groups were then asked to estimate the distances between pairs of U.S. cities along an east-west axis, for example, San Francisco and Salt Lake City, New York City and Pittsburgh.
The students given a West Coast perspective overestimated the distances between the westerly pairs relative to the easterly pairs, and the students given an East Coast perspective did the opposite. Thus, the vantage point assigned for making the judgments systematically distorted the judgments.
2.3 Cognitive Reference Points
When I am out of state and asked where I live, I usually answer, „Near San Francisco.”
If I am closer to home, I will answer, „On Stanford campus,” or „Off Stanford Avenue,”
or „Next door to the ----s.” In other words, rather than giving an exact location, I convey where I live relative to a reference point [see 8] that I believe my questioner will know. Not only do we describe less-known locations relative to better-known landmarks, we also seem to remember them that way. As is often the case in memory, we describe situations to ourselves just as we would describe them to others.
Remembering less prominent locations relative to landmarks induces a distortion that is particularly intractable for metric maps, namely asymmetric distance. Sadalla, Burroughs, and Staplin [32] have found that people judge the distance from an ordinary building to a landmark to be smaller than the distance from a landmark to an ordinary building.
2.4 Alignment
Remembering one spatial location with respect to another leads to direction distor- tions as well. Two nearly-aligned locations tend to be grouped, in a Gestalt sense, in memory, and then remembered as more closely aligned than they actually were [41]. Students were given two maps of the Americas, one a correct map, and the other, a map in which South America was moved westward with respect to North America, so that the two Americas were more closely aligned. A significant majo- rity of the students thought the altered map was the correct one. Another group of students selected a world map in which the Americas were moved northward relative to Europe and Africa in preference to a correct map of the world. In the preferred incorrect map, the United States was more closely aligned with Europe and South America with Africa. Alignment errors in memory were also obtained for judgments of directions between cities, for example, students incorrectly thought that Boston was west of Rio de Janeiro and that Rome was south of Philadelphia.
Alignment was also observed in memory for local environments most likely learned from navigation rather than maps, in memory for artificial countries and cities, and in memory for blobs not interpreted as maps.
2.5 Rotation
Remembering a spatial location relative to a frame of reference can also lead to direction distortions [41]. Think of a situation where the orientation of a land mass is not quite the same as the orientation of its frame of reference. A good example is South America, which appears to be tilted in a north-south east-west frame. In fact, when students were given cutouts of South America and asked to place them
correctly with respect to the canonical directions, most students uprighted South America. Similar errors appeared for the San Francisco Bay Area, the environment immediately surrounding the students, and for artificial maps and blobs as well, in our work as well as that of others [4, 21, 22].
2.6 Other Systematic Errors
This is by no means a complete catalog of systematic errors in memory and judgment of environments. Irregular geographic features may be regularized. For example, Parisians straighten out the Seine [27], and Americans seem to straighten out the Canadian border [36 as interpreted by 43]. Turns and angles are regularized to right angles [3, 13, 29, 34]. Distance judgments are arguably more complex than direction judgments. They are rarely known directly, so they seem to entail use of a number of surrogates that may yield distortions. Distances have been judged longer when a route has barriers or detours [7, 18, 30], when a route has more turns or nodes [33, 35], and when a route has more clutter [40].
2.7 Cognitive Collages
Thus, a number of different factors, hierarchical representations, cognitive perspec- tives, cognitive reference points, alignment to other locations, rotation to a frame of reference, regularization of geographic features, and more, can systematically distort memory and judgment of environments. On the whole, each empirical study has isolated the effects of a single factor, but in real cases, many factors may be operative. There is no guarantee that the distorting factors are consistent; in fact, it seems easy to construct cases where one factor would distort in one direction and another factor in another direction. The distortions alone are incompatible with a metric mental map, and inconsistent distortions make mental maps an even less satisfactory explanation. Of course, not all our spatial knowledge is distorted. Some of it may be quite accurate. But even so, it is unlikely to be complete, so that prob- lems arise when trying to put it all together, especially if some of the information is erroneous and if the information from different sources is not compatible. The inconsistencies, however, seem to provide a mechanism to reduce error. When subjects are asked for more information from an environment, it turns out that their judgments become more accurate [1, 2, 26]. This could happen because when confronted with their own inconsistencies, people retrieve additional information that allows them to reconcile the inconsistencies in the correct direction. It could also happen if there were a large number of unreliable judgments, with the majority going toward the correct. Figures can emerge from collages. In many real world situations, however, people are asked for partial information and may not use other information as a corrective.
2.8 Two Basic Relations
The situation is not always as chaotic as I’ve implied. Most of us manage to find our ways most of the time, either because an environment is familiar, or because we use maps or instructions or environmental cues or all of the above or more. For some well-learned environments, large-scale or small, people’s knowledge can be well- organized and systematic. In those cases, the knowledge often has the form of locating elements relative to one another from a point of view or of locating an element relative to a higher order environmental feature or reference frame. Interestingly, the systematic errors described depend on these basic relations. The errors attributable to cognitive perspective, cognitive reference points, and alignment rest on representing landmarks relative to one another from a vantage point. The errors attributable to hierarchical organization and to rotation are based in representing a landmark relative to a higher order feature, a region or a frame of reference. Although much of human knowledge about space, including systematic errors, can be reduced to these two-relations, some cannot. These two simple relations can form a foundation for spatial knowledge from which memory and judgment are constructed. Although the relations can be quite coarse, they can also be refined by adding constraints imposed by other spatial relations. Significantly, these relations also form the basis for spatial language used in descriptions of environments. Because the spatial relations between elements or between an element and a reference frame can be expressed by the many disparate formats that convey environmental knowledge, the relations provide a means to integrate spatial information from different formats.
3 SPaTial deScriPTionS
One of the major functions of language is to convey experience vicariously. Anyone who has laughed out loud reading a novel or felt their heart beat rapidly reading a mystery knows that. Describing space effectively must have been an early use of language, in order to tell others where to find food and where to avoid danger.
Although modern-day spatial language can convey locations of landmarks with great accuracy using formal systems designed for that purpose, everyday spatial language is not very precise. Typical spatial expressions like „next to,” „between,”
„to the left of,” „in front of,” „east of,” and „on top of” describe spatial relations at coarse levels of precision, but their frequency in the language suggests that they are easily produced and readily understood. These expressions convey the relations between elements. Expressions like „within,” „contains,” „divides,” „borders,” and
„curves” convey the relations between elements and reference frames. [For more discussion of spatial language, see for example, 6, 9, 15, 19, 28, 31.]
3.1 Comprehending Route and Survey Descriptions
Taylor and I have been interested in the nature of the spatial information that lan- guage alone can impart [37, 38]. Thus far, we have only investigated those spatial
expressions that seem to be readily produced and understood. Spatial descriptions normally assume a perspective, explicit or implicit. An informal survey of guide- books indicated that descriptions of environments take one of two perspectives.
A route perspective takes readers on a mental tour of the environment, describing landmarks with respect to the (mentally) changing position of the reader in terms of the reader’s front, back, left, and right. A survey perspective gives readers a bird’s eye view, and describes landmarks relative to one another in terms of north, south, east, and west These two perspectives have parallels with two major means of learning about environments, the first through exploration, and the second through maps. They also have parallels to a distinction made in knowledge representation that is both popular and controversial, namely, procedural and declarative.
Design. In our first set of experiments [38], students studied either a route or a survey description of each of four environments. Two of the environments were large-scale, one county-sized and the other a small town, and two were smaller, a zoo and a convention center. The environments contained about a dozen land- marks. After studying the descriptions, students responded true or false to a series of statements: verbatim statements taken from both the perspective read and the other perspective and inference statements from both perspectives. The inference statements contained information that was not explicitly stated in either text, but could be inferred from information in either text. If perspective was encoded in the mental representations, then inference statements from the read perspective should be verified more quickly than inference statements from the other perspec- tive. After responding to the statements, students drew maps of the environments.
Results. From only studying the descriptions, students were able to produce maps that were nearly error-free, indicating that language alone was sufficient to accurately convey coarse spatial relations. The speed and accuracy to answer the true/false questions suggested that readers formed at least two mental representations of the text, one of the language of the text, and another of the situation described by the text, that is the spatial relations among the landmarks. We termed the latter a spatial mental model [cf. 16] to distinguish it from an image. Responses to verbatim statements were faster and more accurate than responses to inference statements.
Presumably, verbatim statements were verified against a representation of the language of the descriptions, but inference statements had to be verified against a representation of the situation, a spatial mental model. Even though responses were faster and more accurate to verbatim statements, the overall level of respond- ing to inference statements was high. Subjects were able to verify spatial relations not specifically stated in the text, further support for the creation of spatial mental models. Responses to inference statements from the read perspective were neither faster nor more accurate than responses to inference statements from the other perspective, for both perspectives. This result was obtained in four separate experi-
ments, including one where the students read only a single description and did not know they would be asked to draw maps.
Spatial Mental Models vs. Images. In this situation, where subjects studied coherent spatial descriptions of relatively simple environments, perspective did not seem to be encoded in the spatial mental models. Rather, the spatial mental models const- ructed seemed to be more abstract than either perspective. These spatial mental models appeared to capture the spatial relations among landmarks in a perspective- free manner, allowing the taking of either perspective with equal ease. As such, these spatial mental models are akin to an architect’s model or a structural description of an object. They have no prescribed perspective, but permit many perspectives to be taken on them. Thus, spatial mental models are more abstract than images, which are restricted to a specific point of view [see 10, 17].
3.2 Producing Spatial Descriptions
Descriptions composed of the simple spatial relations between landmarks and between landmarks and reference frames were successful in inducing coherent spatial mental representations. It is then natural to ask what is the nature of the spatial descrip- tions that ordinary people spontaneously produce. In two experiments, Taylor and I [39] gave students maps to study, and asked them to write descriptions of the environments from memory. A compass rose appeared in each of the maps, allowing orientation with respect to the canonical axes, north-south and east-west. In a third study, we asked subjects to write descriptions of familiar environments they had learned from experience.
Survey, Route, and Mixed Descriptions. The descriptions subjects produced indicated that subjects regarded the maps as environments, and not as marks on pieces of paper. Perspective was scored using the definitions of route and survey described previously. As our intuitions suggested, descriptions used either route or survey perspectives, or a combination of both. No other style of description emerged. In the mixed perspective descriptions, either one perspective was used for parts of an environment and the other perspective for other parts, or both perspectives were used simultaneously for at least part of the descriptions. Across a wide variety of environments, survey, route, and mixed descriptions were obtained, their relative frequency depending in part on features of the environments. This was despite widespread claims that most spatial descriptions take a consistent perspective, specifically, a route perspective [for review, see 20]. The descriptions that subjects wrote from memory were quite accurate. They allowed a naive group of subjects to place nearly all the landmarks correctly [37].
Basic Relations and Coherence. A detailed analysis of the words, phrases, and clauses used in the descriptions revealed that the essence of a route description was describing the locations of landmarks relative to a single referent with a known perspective, in this case, the moving position of the reader. The essence of a survey description was describing the location of a landmark relative to the location of another landmark from a fixed perspective. These parallel the two basic relations described earlier. The situation is slightly more complex, however. In route descrip- tions, although the referent was constant, the orientation and location of the referent kept changing. Readers had to keep track of that orientation and location relative to the canonical frame of reference. Both our own and our subjects’ route descriptions oriented readers with respect to north-south east-west. In survey descriptions, the referent kept changing, but the orientation was constant. Route descriptions, then, establish coherence by relating all landmarks to a single referent.
They are complicated by the task of keeping track of the orientation of the referent.
Survey descriptions establish coherence by using a single orientation, but they are complicated by changing the referent element. When either type of information is consistent and complete, as it was in the descriptions we wrote and in many of the descriptions subjects wrote, the individual pieces of information can be integrated into a coherent representation of the spatial relations among the landmarks inde- pendent of any specific perspective.
3.3 Spatial Mental Models
The integration of the relative locations of landmarks i ndependent of perspective or orientation that occurs when people read spatial descriptions also seems to occur as people navigate the world. It would be inefficient to remember successive snapshots of the world because they would not allow recognition or navigation from other points of view. It makes more sense to isolate landmarks, and to remember their locations relative to one another and relative to a frame of reference so that recognition and way-finding are successful from different starting points. For simple, familiar environments, whether learned from direct experience, or learned vicariously through language, people can form coherent mental representations of the spatial relations among landmarks.
4 conclUSionS
Despite its considerable appeal, as traditionally used, the „cognitive map” metaphor does not reflect the complexity and richness of environmental knowledge. That knowledge comes in a variety of forms, memory snippets of maps we’ve seen, routes we’ve taken, areas we’ve heard or read about, facts about distances or directions.
It can also include knowledge of time zones and flying or driving times and climate.
Even knowledge of historical conquests and linguistic families can be used to make
inferences about spatial proximity. Some of that information may contain errors, systematic or random. When we need to remember or to make a judgment, we call on whatever information seems relevant. Because the snippets of information may be incomparable, we may have no way of integrating them. For those situa- tions, cognitive collage is a more fiing metaphor for environmental knowledge.
Yet, there are areas that we seem to know quite well, either because they are familiar or simple or both. Even in those cases, metric knowledge can be schematic or distorted. What our knowledge seems to consist of in those cases is the coarse spatial relations among landmarks, what we have termed spatial mental models.
Although spatial mental models may not allow accurate metric judgments, they do allow spatial perspectivetaking and inferences about spatial locations. They are constructed from basic spatial relations, relations between elements with respect to a perspective or between an element and a frame of reference. Those situations that are simple and that we know well are also easy to describe. Languages abound in expressions for categorical spatial relations. These expressions are readily pro- duced and easily understood. Although many languages have adopted technical systems to convey metric information about location, orientation, and distance, this terminology is not widely used in everyday speech. When it is used in everyday situations, it is often used schematically. Apparently, descriptions using, categorical spatial relations are sufficient for everyday uses. Viewed as mental models or cognitive collages, environmental knowledge is not very different from other forms of know- ledge. Just as for environments, there are areas of other knowledge where our infor- mation is consistent and integrated, but there are also areas where, because of incomp- leteness or incomparability or error information cannot be consistent and integrated.
referenceS
1. J. Baird (1979): Studies of the cognitive representation of spatial relations: I. Overview.
Journal of Experimental Psychology: General 108, 90-91
2. J. Baird, A. Merril, J. Tannenbaum (1979): Studies of the cognitive representations of spatial relations: II. A familiar environment. Journal of Experimental Psychology: General 108, 92-98 3. R. W. Byrne (1979): Memory for urban geography. Quarterly Journal of Experimental Psy- chology 31, 147-154
4. W. G. Chase (1983): Spatial representations of taxi drivers. In: Dr. R. Rogers, J. A. Sloboda (eds.): Acquisition of symbolic skills. New York: Plenum
5. W. G. Chase, M. T. H. Chi (1981): Cognitive skill: Implications for spatial skill in large-scale environments. In: J. H. Harvey (ed.): Cognition, social behavior, and the environment. Hills- dale, NJ: Erlbaum
6. H. H. Clark (1973): Space, time, semantics, and the child. In: T. E. Moore (ed.): Cognitive development and the acquisition of language. New York: Academic Press, pp. 27-63 7. R. Cohen, L. M. Baldwin, R. C. Sherman (1978): Cognitive maps of a naturalistic seing.
Child Development 49, 1216-1218
8. H. Couclelis, R. G. Golledge, N. Gale, W. Tobler (1987): Exploring the anchor-point hypot- hesis of spatial cognition. Journal of Environmental Psychology 7, 99-122
9. C. J. Fillmore (1975): Santa Cruz lectures on deixis. Bloomington: Indiana University Linguistics Club
10. R. A. Finke, R. N. Shepard (1986): Visual functions of mental imagery. In: K. R. Boff, L. Kauf- man, J. P. Thomas (eds.): Handbook of perception and human performance. New York: Wiley 11. S. C. Hirtle, J. Jonides (1985): Evidence of hierarchies in cognitive maps. Memory and Cognition 13, 208-217
12. S. C. Hirtle, M. F. Mascolo (1986): The effect of semantic clustering on the memory of spatial locations. Journal of Experimental Psychology: Learning, Memory and Cognition 12, 181-189
13. S. C. Hirtle, M. F. Mascolo (1992): The heuristics of spatial cognition. Proceedings of the 13th annual conference of the cognitive science society. Hillsdale, N: Erlbaum, pp. 629-634 14. K. J. Holyoak, W. A. Mah (1982): Cognitive reference points in judgments of symbolic magnitude. Cognitive Psychology 14, 328-352
15. R. Jackendoff, B. Landau (1991): Spatial language and spatial cognition. In: D. J. Napoli, J. A. Kegl (eds.), Bridges between psychology and linguistics: A Swarthmore Festschrift for Lila Gleitman. Hillsdale, NJ: Erlbaum, pp. 145-169
16. P. N. Johnson-Laird 1983): Mental models. Cambridge, MA: Harvard University Press 17. S. M. Kosslyn (1980): Image and mind. Cambridge, MA: Harvard University Press 18. S. M. Kosslyn, H. L. Pick, G. R. Fariello (1974): Cognitive maps in children and men. Child Develop- ment 45, 707-716
19. G. Lakoff (1987): Women, fire, and dangerous things: What categories reveal about the mind. Chicago: University of Chicago Press
20. W. J. M. Levelt (1989): Speaking. Cambridge, MA: MIT Press
21. R. Lloyd: Cognitive maps (1989): Encoding and decoding information. Annals of the Associ- ation of American Geographers 79, 101-124
22. R. Lloyd, C. Heivly (1987): Systematic distortions in urban cognitive maps. Annals of the Association of American Geographers 77, 191-207
23. R. H. Maki (1981): Categorization and distance effects with spatial linear orders. Journal of Experimental Psychology: Human Learning and Memory 7, 15-32
24. T. P. McNamara (1986): Mental representations of spatial relations. Cognitive Psycho- logy 18, 87-121
25. T. P. McNamara, J. K. Hardy, S. C. Hirtle (1989): Subjective hierarchies in spatial memory.
Journal of Experimental Psychology: Learning, Memory, and Cognition 15, 211-227 26. A. Merril, J. Baird (1979): Studies of the cognitive representations of spatial relations: III.
A hypothetical environment. Journal of Experimental Psychology: General 108, 99-106 27. S. Milgram, D. Jodelet (1976): Psychological maps of Paris. In: H. M. Proshansky, W. H.
Ittelson, L. G. Rivlin (eds.): Environmental psychology. Second Edition. New York: Holt, Rinehart and Winston, pp. 104-124
28. G. A. Miller, P. N. Johnson-Laird (1976): Language and perception. Cambridge, MA:
Harvard University Press
29. I. Moar, G. H. Bower (1983): Inconsistency in spatial knowledge. Memory and Cognition 11, 107-113
30. N. Newcombe, L. S. Liben (1982): Barrier effects in the cognitive maps of children and adults. Journal of Experimental Child Psychology 34, 46-58
31. G. Retz-Schmidt (Summer 1988): Various view on spatial prepositions. AI Magazine 9, 95-105
32. E. K. Sadalla, W. J. Burroughs, L. I. Staplin (1980): Reference points in spatial cognition.
Journal of Experimental Psychology: Human Learning and Memory 5, 516-528
33. E. K. Sadalla, S. G. Magel (1980): The perception of traversed distance. Environment and Behavior 12, 65-79
34. E. K. Sadalla, D. R. Montello (1989): Remembering changes in direction. Environment and Behavior 21, 346-363
35. E. K. Sadalla, L. J. Staplin (1980): The perception of traversed distance: Intersections.
Environment and Behavior 12, 167-182
36. A. Stevens, P. Coupe (1978): Distortions in judged spatial relations. Cognitive Psycho- logy 13, 422-437
37. H. A. Taylor, B. Tversky (1992): Descriptions and depictions of environments. Memory and Cognition 20, 483-496
38. H. A. Taylor, B. Tversky (1992): Spatial mental models derived from survey and route descriptions. Journal of Memory and Language 31, 261-282
39. H. A. Taylor, B. Tversky (in preparation): Perspective in spatial descriptions
40. P. W. Thorndyke (1981): Distance estimation from cognitive maps. Cognitive Psycho- logy 13, 526-550
41. B. Tversky (1981): Distortions in memory for maps. Cognitive Psychology 13,407-433 42. B. Tversky (1991): Distortions in memory for visual displays. In: S. R. Ellis (ed.), M. K.
Kaiser, A. Grunwald (assoc. eds.): Pictorial communication in virtual and real environments.
London: Taylor and Francis, pp. 61-75
43. B. Tversky (1992): Distortions in cognitive maps. Geoforum 23, 131-138
44. R. N. Wilton (1979): Knowledge of spatial relations: The specification of information used in making inferences. Quarterly Journal of Experimental Psychology, 31, 133-146
noTeS
1. The article was published: Tversky, B. (1993) Cognitive Maps, Cognitive Collages, and Spatial Mental Models. In Frank, A.U. and Campari, I. (Eds.) Spatial Information Theory:
A Theoretical Basis for GIS, Proceedings COSIT ’93. Lecture Notes in Computer Science, 716, pp.14-24, Springer: Berlin. Article · September 1993 DOI: 10.1007/3-540-57207-4_2 2. Preparation of this paper and the research described were supported by the Air Force Office of Scientific Research, Air Force Systems Command, USAF, under grant or cooperative agreement number, AFOSR 89-0076.
the “legible” City
“Just as this printed page, if it is legible, can be visually grasped as a related pattern of recognisable symbols, so a legible city would be one whose districts or landmarks or pathways are easily identifiable and are easily grouped into an overall pattern…”
(K. Lynch)
abSTracT1
A city like this – where stepping on the Széchenyi Chain Bridge one immediately arrives at the abutment leading to New York City of the Brooklyn Bridge, and what is more, in evening floodlight – obviously does not exist in reality. Yet the message of the advertisement is easy to understand. Even without one word of a hint, a few emblematic buildings immediately take us to the large cities of the world. Seeing the advertisement – without even noticing it – our consciousness immediately
“calls forth” the images in our minds about the countries, metropoles of the world, or in other words, our cognitive map.
The inSPecTion of cogniTiVe maPS
As everyday the practice of rebuilding spatial reality in our consciousness – or making cognitive maps, as we have called the process earlier – may be, the phenomenon is as problematic to analyse. The problem arises from the fact that while we use cognitive maps on an everyday basis, yet these can only be researched in an artificial, experi- mental seing. Thus, we continue to lack a commonly accepted method by which cognitive maps could be “elicited”. This state of affairs obviously does not mean that there would not be resourceful and highly effective methods to investigate the issue.
An American researcher, J.S. Adams for instance asked his experimental subjects to perform the laborious task of writing down as many street names from their neighbour- hood as they could remember in a given amount of time. P. Gould on the other hand started with the traditional survey question of “Where would you like to stay the most if you could choose freely?” K. Cox required the participants in his experiment to fulfil the not very entertaining task of ordering all the states of the United States of America according to a scoring system. D. Ley had them draw some kind of a criminological map of Philadelphia, on which participants were asked to mark the less safe, “ill reputed” locations of the city.
According to American architect K. Lynch – a student of the famous painter of Hungarian origin György Kepes – emblematic constructions that became the symbols of the towns where they are located play an important role in shaping our image of the towns, our cognitive maps. Lynch considers that five elements can be distinguished within the structure of cities, merely from the perspective of visibility.
Looking at a city, the first thing that comes to our sight is the network of its paths.
These paths, along which we move every day, bind the different spots of the city into an organic system. Thus, the visual structure of Budapest, for example, is sig- nificantly defined by its ring roads, the embankments alongside the Danube and the boulevards leading out of the city centre. The second important visual ele- ments, the edges are also accompanied by paths. A characteristically outlined edge for instance in the case of Budapest is the line of the Danube or the border of the rising Castle hill. Striking nodes appear at the intersection of paths, like Moszkva tér (Moscow Square) or Móricz Zsigmond körtér (Zsigmond Móricz Circus) in Buda.
Further important elements are the well circumscribable areas, the districts, like for example the Rózsadomb or the Gazdagrét district. Finally, the fifth visual element in the view of Lynch consists of the landmarks, the symbolic objects closely con- nected to the given city, which are immediately associated with the city in people’s minds (e.g. Matthias Church or the Parliament). According to K. Lynch, we can thus construct the city on our cognitive maps using five visual elements: the paths, the edges, the nodes, the districts and the landmarks.
Figure 1: Visual elements in the Városliget (City Park of Budapest) (Cséfalvay Z., 1990) Translation of the words on the image:
Törésvonal = Fault Line/Edge; Iránypont = Reference Point/Landmark; Út = Road/Path, Csomópont = Point of Junction/Node; Terület = Area/District]
VISUAl ElEMEnTS In THE VáROSlIgET (CITy PARk Of BUDAPEST)
Using the systematisation of Lynch in the Városliget (City Park), a well-known area of the Hungarian capital, well-defined visual elements can be distinguished. The City Park obviously means different things to everyone, therefore its visual ele- ments are also perceived and appreciated differently by each and every individual.
(See Figure 1.)
Based on his system of visual elements, Lynch asked the residents of three major cities – Boston, Los Angeles and New Jersey – to draw their respective cities from memory the way they see them. The drawing was supposed to show the degree to which the visual elements appeared on their cognitive maps. Yet he did not only base his research on these map drawings, called “mental maps” by P. Gould, but also completed it with interviews. Thus, eventually three possibilities for compari- son were available for Lynch. Firstly, he could match the actual structures of the cities with the drawings, the “mental maps” created about these, secondly, he could compare the “mental maps” of the three cities to one another, and finally, he could explore the differences between the map drawings and oral communication.
Lynch’s results are extremely instructive from the perspective of city architecture and planning. The “mental maps” almost regularly included the spatial elements that everyone, without exception, remembered, while the unknown parts of the city, its “white spots”, were also the same for almost everybody. Thus, the different parts of the city were very dissimilar in how they could be visually grasped, or using Lynch’s terminology, differed very much in their degree of “legibility”.
The “menTal maPS” of boSTon and bUdaPeST
According to Lynch’s research, the most clearly arranged, “legible” one of the three examined cities was Boston, which had followed the European traditions of city architecture. In spite of that, it was remarkable that even in the case of the in-depth interviews, which provided more grounded and in-depth information, there were quite a few “white spots”, unknown areas – consistent with the drawings made from memory – even in this “legible” American city.
Yet Lynch was not only interested in the cognitive maps, but also in the methods leading to them, the process of cognitive mapping. Therefore he took the effort to observe how the participants in his experiment set about to draw the sketch maps, and what were the steps that led to their respective cognitive maps. The result of his investigation was a typology of five types, from which everyone can easily identify their own styles of cognitive mapping.
The most frequent style trend is the route method. The cognitive map of the city and the map drawing serving as a “mental map” is constructed in this case with the help of a known route – most frequently the route between home and workplace –
and its forks that are important for us. The other frequent procedure is the frame filling method, when a shape defined by a characteristic boundary is filled with the most important elements of the city. The third method is built on the road network, i.e. the objects of the built environment attached to the channels of communication of the city. The fourth strategy, the mosaic, or tile method is relatively rare. In this case only but a few details of the city are placed on the cognitive map, with an ext- remely accurate elaboration, but, at the same time, mostly with white spots stret- ching among the tiles. Finally, according to the fifth solution, the cognitive map is organised around a centre – usually the dwelling place or the downtown part of the city –, thus the rest of the objects of the city only make sense in this connection.
Figure 2: The “mental maps” of Boston, based on in-depth interviews (A) and drawn from memory (B) (Lynch, K., 1960)
The spatial objects (i = paths; ii = edges; iii = nodes; iV = districts; V = landmarks) are mentioned by the given % of the subjects
[Translation of the words on the image: 0 … 1000 láb = 0 … 1000 feet; É = N(orth)]
Figure 3: The “mental map” of Budapest, based on the sketch maps of the students (Cséfalvay Z. - Fischer, W, 1990)
The spatial objects (I-V) are mentioned by the given percentage of the respondents.
I. Paths: 1 = Széchenyi Chain Bridge; 2 = Árpád Bridge; 3 = Margaret Bridge; 4 = Elisabeth Bridge;
5 = Liberty Bridge; 6 = Petőfi Bridge; 7 = Grand Boulevard (Ring Road); 8 = Northern Rail Bridge;
9 = Rákóczi Street; 10 = Small Boulevard (Ring Road); 11 = Southern Rail Bridge; 12 = Margaret Ring Road; 13 = Alkotás-Bocskay-Irinyi Avenue; 14 = Andrássy Avenue; 15 = Váci Street;
16 = Danube Promenade.
II. Edges: 17 = Danube bank; 18 = the edge of the Buda hills; 19 = the edge of the Buda Castle hill;
20 = City confines.
III. nodes: 21 = Deák Square, 22 = Blaha Lujza Square, 23 = Oktogon; 24 = Vörösmarty Square.
IV. Districts: 25 = Buda Castle; 26 = Margaret Island; 27 = Gellért Hill; 28 = Csepel Island;
29 = Downtown; 30 = János Hill; 31 = Svábhegy; 32 = Városliget (City Park); 33 = Óbuda centre.
V. landmarks: 34 = Millennium Monument; 35 = Parliament; 36 = National Museum;
37 = St. Stephen’s Basilica; 38 = Opera; 39 = People’s Stadium; 40 = Keleti Railway Station;
41 = Nyugati Railway Station; 42 = Vigadó; 43 = The Building of the Faculty of Science of the Eötvös Loránd University
[Translation of the words on the image: Duna = Danube]
Based on the method of K. Lynch, a similar survey was conducted in the 1980s among the students of the Eötvös Loránd University of Budapest. According to the results of the survey, the “mental map” of the Hungarian Capital is characterised by downtown centricity. For the subjects of the experiment Budapest meant the area delimited by the Grand Boulevard of Pest, the Margaret Ring Road and the Alkotás Avenue in Buda. Anything falling outside this boundary “was not even the Capital”.
It is also striking that most of the urban landscape elements on the “mental map”
were somehow related to the channels of traffic communication. In the view of K.
Lynch the city landscape can best be grasped with the help of well-delimited areas and zones. Yet it seems that this statement is mostly only true for the American cities, where the territorial segregation of the different social groups is extremely sharp, while in the case of European cities the roles of areas and zones is less important on cognitive maps. In Budapest, for instance, the defining elements of the “mental map” are the major channels of communication and the bridges across the Danube River. The so characteristic downtown centeredness of the Capital’s
“mental map”, which hardly takes note of middle class building estates, the privileged green area of the Buda side, or the industrial districts of the outskirts, can be traced back to a variety of far-reaching reasons. Firstly, Downton Pest, primarily built during the period after the Austro-Hungarian Compromise, is an extremely charac- teristic architectural ensemble, making it even today the most uniform and best arranged part of the city. Secondly, most of the functions that make the life of a capital city go round (different services, management etc.), are predominantly concentrated here. Thirdly, all the establishments that are important in the every- day lives of students are located in the Downtown area of Pest.
The other important conclusion arose from the comparison of the “mental maps”
of the cities – particularly Boston and Los Angeles. The survey participants could generally draw very detailed, well-proportioned maps of more than 200 years old Boston, a city that partially followed European architectonic traditions. On the other hand, only very general, obscure “mental maps” were produced about Los Angeles, a rather monotonously built city that could be qualified with a little exaggeration as an agglomeration of about forty villages. The question arises therefore, of how urban designers could come up with clear-cut, “legible” cities. Where is the point when regular city structure changes over into monotony, and vice versa, when does irregular crowdedness become visually incomprehensible? What can civic design do in this respect at all? Although since Lynch’s research city designers have tried out countless experiments meant to turn large cities “legible” – e.g. by rediscovering old street furniture or by painting the blocks of flats in vivid colours instead of concrete grey or using pitched roofs instead of flat roofs –, but failed to come up with a true answer so far.
The purpose of the architect Lynch with these “mental maps” was to create a comprehensible, receptible, “legible” city. Yet, it lies within the nature of cognitive mapping that the same city – no matter whether it is easily comprehensible or not – is “read” differently by everyone. For that very reason, only a decade after
Lynch’s survey, geographer P. Orleans asked people again to draw “mental maps”
in Los Angeles. According to Lynch Los Angeles, primarily because of its peculiar city structure, was a hardly “legible” city, one difficult to read. However, P. Orleans made a twist in the optics: the nature of the “reading”, i.e. of the “mental map”
depended, he said, on the place from where the city of Los Angeles was observed, more precisely on the angle of the observing social group.
Figure 4: The “mental map” of Los Angeles seen from Avalon (A) and Westwood (B) (Orleans, P., 1973)
The spatial objects (i = path; ii = edge; iii = node; iV = district; V = landmark) are mentioned by the given percentage of the respondents.
[Translation of the words on the image: 0 … 5 mérföld = 0 … 5 miles; É = N(orth)]
differenT PerSPecTiVeS on The “menTal maP”
P. Orleans had “mental maps” drawn on four areas of Los Angeles, differing sharply from one another in terms of social character. In Boyle Heights, the immigrant Mexicans living there hardly knew their town at all. Los Angeles is nothing but a tiny spot on “mental map” drawn by them, the metropolis from their perspective is not more than a few streets of the slum. Watching from the predominantly black inhabited district of Avalon, Los Angeles seems to be a much more complex city.
Yet, apart from the elaborate downtown and their own dwelling location, the other parts of the city are unknown to them. The middle class inhabitants of Northridge drew a completely different map of Los Angeles, which also included the areas bet- ween their dwelling places and the downtown area. Finally, the most detailed, best structured image of the city was drawn by the participants in the experiment from Westwood, mostly belonging to the upper class. (See Figure 4)
The reasons of the differences between the “mental maps” this time are literally to be found in the differing viewpoints. The subjects participating in the experiment, belonging to different social groups, have in fact drawn the parts of Los Angeles that were indeed known to them. This knowledge naturally came from their direct, everyday experience. The immigrant Mexicans living in the poor district of Boyle Heights understandably did not draw the shoreline of the Pacific Ocean, because they did not go to surf there, and similarly omitted the downtown of the city, as they never reached their during their shopping routes, not even by accident. In other words: these segments lack the financial means and the social ability needed to enter the mentioned areas. It was exactly this social difference that the “mental map” reflected. Thus, everyone draws only the parts that truly belong to them on the “mental map”. People only mark the areas that they use in reality, those sym- bols of the town that they can indeed identify with. “Mental maps” visually grasp what of the city falls to the share of each individual. A city, in principle, obviously belongs to everyone, but the whole city – as it became clear from the assessment of P. Orleans – only belongs to a very few. When Lynch had such “mental maps”
drawn, he in fact demanded the participants of his experiment an account of the entire city. However, the city is much more a mosaic of social worlds at a distance of a light-year from each other – as R. E. Park had already discovered as early as the 1920s –, rather than a kaleidoscope of visual elements. Similarly, “mental maps”
only indirectly and clumsily relate to our relationship to the city. To what degree are we attached to our place of living, do we love our city or not, and if so, why?
With the research of “mental maps”, by overemphasising the visual character of spatial environment, the most important feature of cognitive mapping, the subjec- tive, evaluative relationship to space, remains in obscurity. This kind of relationship is hard to investigate by city drawings, sketches tossed from memory. Cognitive maps can not only exist as mere maps, but also in the form of opinions, misbeliefs and stereotypes.
The maP of england STanding on iTS head
The scientific investigation of the subjective relationship to spatial environment obviously began with the simplest possible solution. If we are curious to learn about how people value their environment, we have to ask them. Let’s say, we should ask them the question “Where would you like to stay the most if you could choose freely?” And if we have enough time and enough helpful subjects ready to answer, then we can ask them to list all the possible places that can be taken into consideration, according to their value. P. Gould and R. White asked English uni- versity students to ponder from that perspective each administrative unit of Great Britain, and give them a value from 1 to 100. The result gave a subjective image of the insular kingdom, which was by all means differing from reality, therefore – in order to showcase that – the map summing up the results of the research was drawn upside down.
Figure 5: The “mental map” of England based on the preference assessment of the dwelling place (scores based on the percentage of the inquired subjects)
(Gould, P. - White, R., 1968)
As it is shown by this strange map, such assessments – which had already been carried out since in almost every important country in the world – do not bring too many novelties on the level of direct results. On the upside down map of England, the regions with the highest score are along the Southern shores of the island, the traditional holiday areas with the most agreeable climate. Second on the list of pre- ference is London, the pulsing metropolis. The third place is occupied by the lake region of Middle England, which by its beauty – as if the earlier mentioned typology of B. MacKaye was followed – create the successful harmony of rural life and life close to nature. Dwelling place preference lists resulting from the inquiries done in the United States also repeated the long known spatial value judgments: California is the realm of “high tech” and of eternal sunshine, Texas still represents the Wild West, New York continues to be the home of Wall Street and Manhattan. Positive value judgments were connected almost always to the current dwelling place and the areas with a traditionally high dwelling prestige in the given country. At the same time, the regions qualified as less attractive usually also corresponded to the areas publicly perceived as “Godforsaken places”.
In addition, between these well-known extremes – as a result of the nature of the scoring method – a wide, homogeneous zone was stretching, as it was simply impossible to create a well-differentiated ranking list of all the nearly one hundred administrative units in Great Britain based on the question “Where would you like to stay the most?”.
A fashionable tool of the research on the opinions, value judgments regarding our geographic environment, dwelling place or city is linked to the name of Ch. Osgood.
His method is based on two thoughts. On the one hand, it is relying on the recog- nition that the surrounding world can be more or less well mapped with language, the world of words, by which we in fact reproduce the image of the outer world formed inside us. Another starting point is the empirical fact that written words are more than just their letters in a specific order, because they perpetually elicit new thoughts, associations, and emotions from the readers.
Osgood, accepting Goethe’s wisdom – “Every word that we utter rouses its cont- rary” –, turned the previous thoughts into tests using the following method. Let us place in front of the participants in the experiment a list with opposite notions, qualifying the dwelling environment (e.g. cosy – bleak, clean – dirty, quiet – noisy), and ask them to choose which of the pair of opposing notions describes best¸ in their opinion, the given spatial environment. Let us also attach a scale to the list – for instance a seven degree scale –, because the world is not black or white, and our value judgments can have a great variety of shades, too. And when we have done this, the new measurement method, the so-called semantic differential scale – to use a term borrowed from linguistics – is ready to be used. (For truly accurate investigations the arbitrary selection of opposing pairs of notions is obviously not enough. Osgood himself worked with 130 pairs of notions in his first approach, a number that he narrowed down later to a standard list of 41 pairs of notions, based on his assessments.)
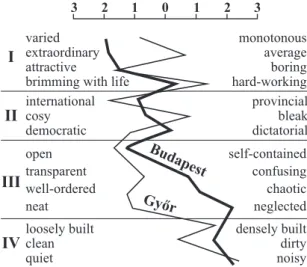
BUDAPEST AnD győR AlOng THE SEMAnTIC DIffEREnTIAl SCAlE
In what the opinions of an inhabitant of a metropolis and that of a town in the countryside are different about their dwelling places? What is the difference between being a resident of the “Capital” or living in “the countryside”, when we conduct a more in-depth examination of the meanings of these two notions? The question was attempted to be answered by two different researches – carried out on different occasions –, based on the tests of Osgood and others. In 1989 a young, mobile, future-oriented and relatively homogeneous group, the students of the Geography Department of the Eötvös Loránd University answered the questions about the atmosphere, social milieu, conditions of the environment of Budapest.
Two years later, the citizens of Győr answered similar questions. (Although far-reaching conclusions cannot be drawn today from the results of the two assessments – especially because such surveys are a very young branch of domestic geography research, therefore the mentioned surveys were also built on relatively small, less representative samples – yet, in spite of that some of their findings were signifi- cant.) According to the semantic differential scale, the atmosphere, mood, the dist- inctive, pulsing world of the Capital was unambiguously seen as positive, and the rating is no accident, as the leisure time offer, the opportunities for entertainment and socialising in the capital city with millions of inhabitants is quite adequate for student lifestyle. However, the social milieu was almost unanimously qualified as inert. It may be true, that one cannot really expect more exciting opinions about a social medium that had seemed motionless for decades – like Hungary had been in the middle of the 1980s. The greatest part of the negative opinions, – not surprisingly at all – were connected to the environmental conditions.
Figure 6: The images of Budapest and Győr along semantic profiles (Z. Cséfalvay, W. Fischer W, 1990 and Gy. Szakál, 1993) i = atmosphere; ii = social milieu; iii = town structure; iV = environment
Interesting parallels and differences can be found when this image is compared to the view of the citizens of Győr about their own town. The inhabitants of the town in the countryside – naturally enough, one might say – consider their locality a little more average, monotonous than the students of Budapest, the two-million metro- polis. It may also seem natural that Győr, with its less than 130 thousand inhabitants looks more organised and better maintained than the Capital. At the same time it is surprising that, because of the proximity of the Western border, the citizens of Győr see their town more international that the inhabitants of Budapest see their city visited by millions of tourists.
In spite of the diversity of research solutions, the world of cognitive maps and the value judgments connected to our dwelling places are still a relatively unknown area. Yet there is no shortage of methods full of imagination, or which are tireso- me for the participants in the experiments. Just like the statement that “everyone constructs their cognitive maps using their own, specific, unique procedures” holds true, it is similarly true for the assessment of cognitive maps, that everyone inves- tigates them in their own way.
referenceS
Adams, J. S. (1969): Directional bias intra-urban migration. In. Economic Geography.302-323, 305.
Cséfalvay Zoltán (1990): Térképek a fejünkben. Akadémiai, Budapest
Cséfalvay, Z.—Fischer, W. (1990): Cigányzene és lakáshiány — sztereotípiák és a valóság el- lentéte a Budapest képben. — Földrajzi Értesítő. 1-4.207-220.
Gould, P. - White, R., (1968) The mental maps of British school leavers. Regional Studies 2. 161-82.
Lynch, K. (1960): The Image of the City. Massachusetts institute of Technology Cambridge, London
Lynch, K. (1979): A város szemléletének struktúrája. In Vidor F. (szerk.) Urbanisztika. Gondo- lat, Budapest
Szakál, Gy. (1993): Ember és környezet viszonya a győri polgárok tudatában. Műhely, 1.43-49. o.
noTeS
1. The article was published in Hungarian: Cséfalvay Zoltán 1994: A modern társadalomföld- rajz kézikönyve. Budapest IKVA 287-298.


![Table 1. Property prices in Bratislava, Bratislava region and Rajka between 2008 and 2017 (Rajka=100; source: [1][3][5] [21] [22] [23]](https://thumb-eu.123doks.com/thumbv2/9dokorg/907578.50691/56.667.88.592.399.563/table-property-prices-bratislava-bratislava-region-rajka-rajka.webp)
![Table 2. Examination of the number of properties and inhabitants by timeline in Rajka (source: [1][5][8][18][19][20][25])](https://thumb-eu.123doks.com/thumbv2/9dokorg/907578.50691/58.667.87.598.678.889/table-examination-number-properties-inhabitants-timeline-rajka-source.webp)