1
DOES LOST TIME COST YOU MONEY AND CREATE HIGH RISK?
Dr. István Fekete
Corvinus University of Budapest H-1093 Budapest Fővám tér 8.
Tel: +3630-456-3424 e-mail: istvan.fekete@uni-corvinus.hu
Keywords: risk assessment, outage, maintenance, project implementation plan, scenario analysis, Monte-Carlo Simulation
Abstract
The aim of the case study is to express the delayed repair time impact on the revenues and profit in numbers with the example of the outage of power plant units.
Main steps of risk assessment:
creating project plan
suitable for risk assessment
identification of the risk factors for each project activities scenario-analysis based evaluation of risk factors
selection of the critical risk factors based on the results of quantitative risk analysis
formulating risk response actions for the critical risks
running Monte-Carlo simulation [1] using the results of scenario-analysis
building up a macro which creates the connection among the results of the risk assessment, the production plan and the business plan.
Results
The result clearly demonstrates that if the outage of certain units is delayed by 3-4 days as compared to the scheduled date due to the inadequately managed risks, the profit before tax might decrease by approximately HUF 1.4 Bn (€ 5M).
With the execution of the risk management actions there are real chances to meet the planned deadline of outage works, and avoid the € 5M loss. Of course, risk management activity costs certain amount of money as well, but the execution costs of the risk management actions are only a fragment of the loss we can avoid.
2
PreliminariesRisk management is a practice of systematically identifying, evaluating, treating and monitoring risks that might have a negative or positive effect on the ability of a company to achieve its strategic goals. Risk can be a future event, activity or failure of activity that has a positive or negative effect on the strategic goals. It can come from many sources, e.g. uncertainty in financial markets, credit risks, regulations and legal liabilities, authorization, accidents, natural disasters as well as unintended human mistakes, deliberate attack from an adversary or employee, cooperation between partners etc.
Risk management can be used in many different business areas. One of the issues is calculating the impact of risks on the productivity and profit plan of a manufacturing company. This case study shows an example of a nuclear power plant.
The Paks Nuclear Power Plant is located in South-Hungary. The license holder is the Paks NPP Joint Stock Company (Paks NPP Ltd). The majority owner of the company is the state owned Hungarian Power Companies Ltd. with a total equity of more than 99.99%.
The four reactor units of the power plant were first connected to grid between 1982 and 1987.
Each of the four units is a VVER-440/V-213 power reactor type, cooled and moderated with light water, and each has a thermal output power of 1,485 MW. After power upgrading program the individual electrical capacity of each reactor unit is 500 MW, giving a total electrical capacity of Paks NPP site approximately 2,000 MW. The daily production value per reactor unit is 0,5M €. The yearly electricity production of the power plant is 15 000 GWh and the revenue is 700 M €.
The electrical energy produced by a nuclear power plant is sold to power providers. The sales contract records the volume of electric power to be sold expressed in GWh. If a nuclear power plant does not meet the production volumes of electric power commitment as scheduled in the contract, and the difference exceeds the pre-defined percentage values, the contract requires the nuclear power plant to purchase the missing amount from the electric power exchange. Since the price of electric power is much higher at the electric power exchange than the production costs of the nuclear power plant, its profit will significantly reduce. Therefore, it is the vital interest of the nuclear power plant to identify any potential risks causing production outages, and model their impact on revenues and profit via the production plan.
The aim of the case study
The reactor units need regular maintenance and refueling. During these works the reactors have to be shut down. There are two basic types of planned outages for Paks nuclear power plants:
the longer service outage and the shorter refueling outage. The service outage includes refueling, major plant modifications, periodical inspections and tests required by the Technical Specifications. Typical duration of the service outage project is 57 days. The refueling outage mainly consists of partial refueling, corrective and preventive maintenance. Typical duration is 26 days. The typical work plan of refueling outage has about 6500 different activities. The maintenance program always has an uncertainty, which can be confronted when the reactor unit is disassembled. Based on experience the average delay of the refueling outage is 3 days. This implies 1,5 M € direct financial loss.
Every tool that eliminates this potential loss is essential for the company, and risk management can help reveal the reasons of loss and reduce probability and/or impact of critical risks.
3
There are two aspects of risk analysis issues related to this topic. First is a strategic view: How can we achieve the strategic goal of load factor?1 In other words, how to ensure the highest level of production? The second targeted area is: Identifying potential delay of outage activities at the operational level and eliminate the additional cost.
This case study is making an attempt to assess the effect of the unplanned outages derived from the delayed maintenance works in a nuclear power station and express the delayed repair time impact on the revenues and profit.
Precondition: During risk analysis we accepted the accuracy of the project plan for the maintenance works as a starting proposition. This means, we did not examine if the outage works of the certain units could be shortened e.g. with better work organization.
Main steps of risk assessment project [2] [3]
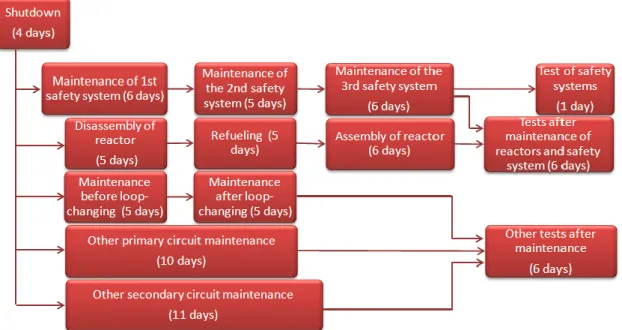
The first step is to simplify the project plan for risk assessment. The project managers of the company have already prepared a project plan, but that contains thousands of activities. It is obvious that the number of activities is too big to be suitable for an efficient risk management because of the time needed for analyzing each activity. Therefore the main task is to reduce the number of activities to a manageable number but of course the content of the outage plan must be preserved. This number should be between 10 and 30.
We also have to define the logical relationships among the activities to get the critical path. [4]
In this example the length of the critical path is 26 days for refueling and 57 days for service outage.
1 Load factor = Actual gross energy output in year i / Maximum gross energy output in year i
Figure 1: Simplified project plan
4
The next step is to identifiy the potential risk factors for each project activities. We suggest the company organize workshops for risk assessment, involving the experts of the project (engineers and project managers). We used our own risk management software named Szigma Integrisk® and a premade standard risk database that is based on our several years of experience.
In this database the risk factors are assigned to risk groups, e.g. legal risks, technological risks, human resources, IT-technology, cooperation, management risks etc. In our example the experts have assigned cc. 10-12 risk factors to every project activity.
The scenario analysis helps calculate the probable impact of a risk. We have to estimate all of the potential outcomes, included the worst and the best case. Maximum four different scenarios can be defined and evaluated. In the course of the evaluation the experts estimate the probability of occurrence of the given scenario and the impact in terms of days.
Then we can calculate the mean value and standard deviation for each risk.
The selection of the critical risk factors is based on the previously defined mean value threshold and relative deviation threshold. If the calculated mean value or the deviation overruns the threshold because of a risk, that risk is labeled as critical risk.
It could easily happen that the same risk factor would be critical at different project activities. In these cases the risk manager or project manager should filter these duplicities and consolidate the risk responses. Through this simplifying step we can reduce the total cost of risk mitigating activities, so the risk management process becomes more effective.
The next task is to create risk mitigating actions for all critical risks. The main aim of the risk response is to help finish the given activity within predefined time that was set in the original project plan. Risk mitigation consists of the following steps: denomination of risk action, denomination of risk owner (responsible for the execution of the risk management plan), deadline of execution and the detailed description of the content of actions. In the example, the main aim of the risk response is to finish the given activity within predefined time that was set before the risk analysis.
We show an example how to evaluate project risks with scenario analysis.
Table 1: Example of risk assessment Activity: Reassembling of reactor
Risk factor: Capacity is not sufficient for completing the task.
Detailed description: Not being ready on time caused by lack of capacity. Engineers and technical supervisors cannot handle the huge amount of simultaneous tasks.
SCENARIOS
Scenario 1 Involving of additional capacity is belated, so a delay of 5 days is possible
Explanation of estimation
Lack of capacity is realized in time, so a maximum delay of 5 days is possible.
Probability 0.3
Impact (days) 5.00
5
Scenario 2 Involving of additional capacity is belated, so a delay of 10 days is possible
Explanation of estimation
Surveying lack of capacity is belated;
therefore a delay of 10 days is possible.
Probability 0.5
Impact (days) 10.00
Scenario 3 Involving of additional capacity is belated, so a delay of 15 days is possible.
Explanation of estimation
Project manager fails to realize the lack of capacity or reacts very late, so a delay of 15 days is possible.
Probability 0.2
Impact (days) 15.00
Mean value of deviation compared to original value (days)
9.5000 Standard deviation 3.5000
Critical? YES
Describe action Strict control of planning activity and continuous communication with project owners and project management department
Risk owner Project manager of refueling project
Deadline 31.01.2012
Estimated cost of
execution 160 000 HUF
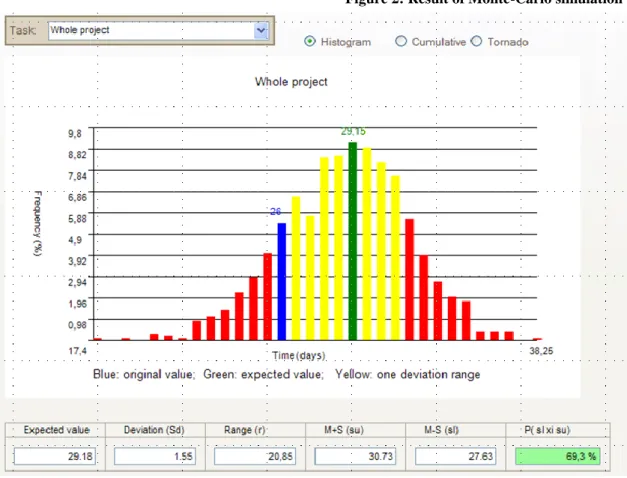
Monte-Carlo simulation uses the results coming from scenario-analysis and a correlation random number generator in order to get the probability distribution
[5]
[6] of the total duration time of the refueling project. This is the last step related to risk assessment.In the course of the scenario analysis a maximum number of four scenarios could be defined.
These scenarios are the most important variations that the experts can set out but in real life much more outcomes are possible. In the course of Monte-Carlo simulation the number of samples could be multiplied so we can simulate a more realistic project environment. As a result we get the mean value, standard deviation, range and other parameters of the distribution of the execution time of each activity and the whole project.
If there had been enough historical data regarding the duration and delays of former refueling and maintenance projects, Monte-Carlo simulation would have been started immediately, instead of risk assessment. In this case the company had not collected such data before the analysis.
6
As a result we can see that the expected outage duration will be in a three-day delay. But because of the huge deviation, there is a high potential for finishing the outage before the original deadline. This means the project has not only negative risks but there are positive risks as well. Positive risks can be called opportunities the company should take advantage of by immediate realization of the risk response and implementation of risk controlling and monitoring actions.
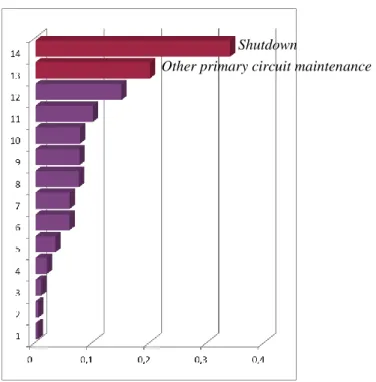
The Tornado-diagram was generated by the run of Monte-Carlo simulation. The essence of this diagram is to show the activities that are mostly responsible for the project delay. These are the activities that can divert actual duration of maintenance to the greatest extent, due to their great risk exposure. That is why it is advised to execute firstly the risk response actions of these critical activities. By managing these most important risks way the original duration (26 / 57 days) can be kept.
In the example of Paks Nuclear Power Plant Shutdown and Other primary circuit maintenance are the tasks that are most responsible for the project delay.
Figure 2: Result of Monte-Carlo simulation
7
Figure 3: Tornado diagram
Using the results of risk assessment, we can answer the most important question: What is the impact of the delayed maintenance and refueling project on the electricity production and on the business result? To answer this question we need the nuclear power plant’s electricity production data and business plan. We use a macro which creates the connection among the result of the risk assessment, the production plan and the business plan.
With the help of this macro we could immediately model the impact of risks on the changes in produced electricity (GWh), changes in other costs (MHUF) and changes in pre-tax profit (MHUF). If we run the macro, we can answer for example the following question: ‘In what range the electric energy is going to fluctuate with relatively high probability (60 %) in case the previously revealed and evaluated risks happen?’
Other primary circuit maintenance Shutdown
8
Results and possible further stepsThe result clearly demonstrates that if the outage of certain units is delayed by 3-4 days as compared to the scheduled date due to the inadequately managed risks, the profit before tax might decrease by approximately HUF 1.4 Bn (€ 5M).
With the execution of the risk management actions there are real chances to meet the planned deadline of outage works, and avoid the € 5M loss. Of course, risk management activity costs certain amount of money as well, but the execution costs of the risk management actions are only a fragment of the loss we can avoid.
The level of details, the methodology applied and the technology are fully in line with the user environment and demand. It is able to produce rapid and exact results based on the available empirical information.
Relying on the analysis we could identify opportunities that could improve the developed model:
• An additional customization of the presented model is required for modeling the risks related to the risk response actions of this project.
Project plan before risk assessment Duration and costs after risk assessment Figure 4: Impact of risks on project duration and costs
Project duration (scheduled)
26 days
Electric energy output (GWh)
14,328
Nuclear fuel (M HUF) 13,025
Water reserve use charges (M HUF)
5,223
Replacement energy purchase (M HUF)
0 Electric energy
production revenue (M HUF) 161,692
Profit before tax (M HUF)
24,981
Project duration (mean value of risk analysis) 30.6 days
Electric energy output (GWh)
14,190
Nuclear fuel (M HUF) 12,898
Water reserve use charges (M HUF)
5,172
Replacement energy purchase
(M HUF) 0 Electric energy
production revenue (M HUF) 160,140
Profit before tax (M HUF)
23,606
9
• At the end of the analyzing period it is advisable to examine how many of the previously identified risks occurred, what their actual impacts were and whether there were any realized risks that were not identified by the analysis.
• It is also expedient to make a cost-benefit analysis that points out what the relationship is between the cost saving due to risk management and the costs related to the risk management.
• The efficiency and accuracy of the risk management can be increased and the time of the data recording can be decreased by developing an interface among the different data storing systems.
• Not every risk factor was taken into consideration, since this is just an analysis made for modeling, but later other risk factors can be added to the model increasing its reliability and accuracy.
Conclusion
We summarize shortly the advantages of risk management from the point of view of Paks Nuclear Power Plant Ltd.
The management of Paks NPP Ltd. treats the realization of the strategic goals with high priority. Therefore they welcome every initiation that aims to help reach the strategic goals. And one of the most important from these goals is to ensure the delivery of the predefined amount of energy to the business partner. The chance for completing this strategic goal can be increased with the reduction in the outage durations.
The turbulent economic environment forces the management to make decisions in critical situations. The application of Szigma Integrisk® system can help answer many strategic dilemmas that the power plant faces.
The applied risk management method ensures the execution of the efficient risk response actions. The ex-post evaluations confirm that the risk exposure related to the outage activity has decreased in the previous year.
An important characteristic of risks is that they have an impact even if they are not identified in time. In this case their occurrence surprises everyone and the response of them cannot be efficient enough. By systematic risk assessment the management and project managers can identify potential risks in time and thus their efficient risk response is also possible.
The additional value of risk assessment can be actions and programs that can improve the operational environment.
Last but not least we can see in the case study that with the help of risk assessment the potential for successful completion of the project has increased to a great extent.
The most important conclusions are as follows:
The main tasks of risk management are to identify and analyze the long-term and huge- budget projects’ critical risks that might have an impact on duration and return. And also an important task is to formulate and execute an effective risk response plan.
In the course of risk assessment not only the impacts on single projects should be analyzed, but also the impact on corporate level.
It is very important to understand how the effective risk management contributes to avoid risks or mitigate their impacts and reach the strategic goals.
10
References[1] David B. Hertz: Risk Analysis in Capital Investment. Harward Business Review, Vol. 42.
(January – February 1964)
[2] Eurescom Project Extended Investment Analysis of Telecommunication Operator Strategies, Deliverable 2 , Annex C. Heidelberg, 2000
[3] Rozalia Konkoly – István Fekete – Attila Gyürke: Evaluation of Uncertainties in Investment Projects. Third Europeen Workshop on Techno-economics for Multimedia Networks and Services. Aveiro, Portugal 1999
[4] Stephen Grey: Pratical Risk Assessment for Project Management. John Wiley&Sons Inc.
1995
[5] Eilon, S.C. – Fowkes, T.R.: Sampling Procedure for Risk Simulation Operational Research Quarterly Vol. 24. pp. 241-252. 1973
[6] Merran Evans – Nicholas Hastings – Brian Peacock: Statistical Distributions John Wiley&Sons Inc. 1993