Investigation of the Urbanistical Complexity in Global Scale
Ákos Varga, Antal Ürmös, Ákos Nemcsics
Research Group for Materials and Environmental Science, Óbuda University, Tavaszmező utca 17., H-1084 Budapest, Hungary, e-mails: tavikecske@gmail.com, urmos.antal@phd.uni-obuda.hu, nemcsics.akos@kvk.uni-obuda.hu,
Abstract— In our present work, we investigate, that the urbanistical relations in global scale how can be regarded as a complex system. We study, that our global urbanistics how can be regarded as a result of self-assembled process. First, we examine the relation in each continent, after that the all data together. We will show, that in the interpretation of the results, the comparation of the scaling exponents are not enough, but it is necessary to examine the decay and the smoothness of the curves.
I. INTRODUCTION
It is well-known, that in the nature, the components of certain disordered systems are organized to ordered structure or a pattern on a spontaneous way. This phe- nomenon is caused by one or more local specific interac- tion, without any external effects. The name of this phenomenon is the self-assembly. We can observe the self-assembly in the biology, in the chemistry [1] [2], in the architecture, and in the material science as well.
One of the directions in our research is to investigate and compare, what are the laws of the self-assembly, in the macroscopic [3] and in the microscopic world as well. In the macroscopic world, in the investigations of the loca- tions, the shapes, the distribution, and the scopes of the settlements, numerous laws can be observed. The further goal of our research is to study, that these laws how (and in which form) can be observed in the microscopic level, in the self-assembly of various nanostructures (such as quantum dot, nano hole etc.).
In the nature, we can observe power function behavior extensively. The similar behavior can be observed in the case of various phase transitions, where the distribution function of some quantities is a power function. The critical exponent is the exponent of these power functions. Similar behavior can be observed in other interacting composite systems. For example, there is a similar behavior in the frequency of the words in the different languages. In a text, the words do not follow each other randomly, but also show means of certain interaction between the words. But similar behavior can be experienced in some social systems. For instance, in a society, the fortune distribution also shows power function. Of course, it can be visible, that the numbers of the rich and poor people are not independent from each other. These systems are called complex systems. The system consists of many different elements and they interact with each other [4].
If we represent the above mentioned systems in a log-log diagram, then we get a straight line on the section, which is interesting for us. In ideal case, we obtain a straight line in the whole range. We get similar behavior, during the study of self-similar structures [5] [6] [7] [8] [9] as well.
If we study a fractal pattern in the nature, similarly in log-log diagram, then we get a straight line in a certain part of curve. If this linearity exists across some order, then we call it fractal like. We use similar condition in the study of our complex system.
The topic of our present paper is a global urbanistical investigation, in order to study the phenomenon of self- assembly in the macroscopic world. We study the capitals of different continents, both separated and together. We will show that such a system in a certain degree constructs a complex system.
II. PRELIMINARIESANDTHEDATACOLLECTION As we mentioned above, we can notice very much sys- tems with the behavior, which is referring to complex systems. In the size distributions of the german towns, the similar behavior can be explored, where the exponent is -0.8 [4]. In case of USA, a similar investigation gave a -2.1 exponent. Similar investigations happened in case of other countries as well. The power function behavior is true on the certain section of the size distribution. This is qualitatively admitable in case of one country, that it is a reasonable presumption. Generally, the economical and other centers are the largest, and the different smaller towns group around them. Inside one country, the number and the distribution of large centers is determined by the interaction. Because too much large centers disturb each other. In the present work, we would like to present, that these interactions work both in continent size and in global size as well. We collected the data from the following databases and search engines: from the databases of the national statistical offices, from Wikipedia, Google Search, Google Maps, Gmap Pedometer and Google Maps Area Calculator. We collected the data to a Microsoft Excel™ spreadsheet, where beside the size we stored more data (its coordinates, population, population density, GDP/PPP (USD/person)) for further investigations [10]. The diagrams are plotted by the Mathworks Matlab™
software.
– 181 –
ICCC 2013 • IEEE 9th International Conference on Computational Cybernetics • July 8-10, 2013 • Tihany, Hungary
978-1-4799-0063-3/13/$31.00 ©2013 IEEE
III. DISCUSSION The log-log diagrams, produced on collected data and the fittable power straight sections are shown in Fig summarized diagram is displayed in Fig parts in the diagrams: in part (A) are t the towns and in the part (B) are the are the figures, the different towns of the each other in the following order: Afric and Oceania, North America, South Am As we see on the diagrams, we can di linearly approximated section. We exponents by the fitting of the straig sections. After giving the calculated deduct conclusions from these data.
In case of Africa, there was no determination of linear section, neither diagram nor in the area diagram (Fig. 1 related to the diagrams of the populatio the towns of Africa are the following: -0
In case of Asia, the population diagram and the area diagram was less-fittable ( pairs in the similar order, related to Asia -0.9672.
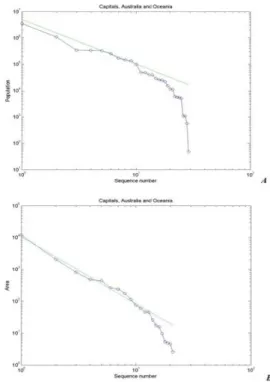
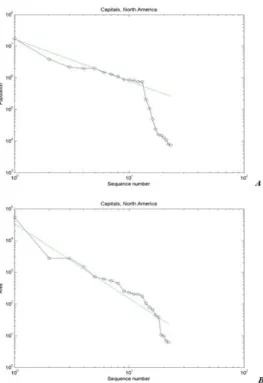
In the case of Australia and Oceania t opposite (Fig. 3). For Australia an Oce following value pairs: -1.691 and -2.099 In case of North America, the populatio a breakpoint (Fig. 4). In the first secti the searching of the straight section wa areal diagram part contains more straigh
Figure 1. This figure shows the size-distributio Africa. The diagrams (A) and (B) correspond the cities and their urbanistical areas,
the basis of the r function for its gs. 1-6 and the g. 7. There are two
the populations of ea of the towns. In continents, follow ca, Asia, Australia merica and Europe.
iscover a linear or determined the ght line for these
results, we try to
problem in the r in the population 1). The exponents, on and the area of 0.5785 and -1.295.
m was well-fittable (Fig. 2). The value
a: -1.072 and
the situation is the eania related to the
9.
on distribution had ion of diagram, in
s no problem. The ht sections, which
are parallel to each other. The of North America are the follow
In case of South America, the data was questionable (Fig.
America in similar order: -0.71 on diagrams related to
d to the population of respectively.
Figure 2. This figure shows the size to Asia. The diagrams (A) and (B) of the cities and their urbanist
Figure 3. This figure shows the size-di Australia and Oceania. The diagrams ( population of the cities and their urb
corresponding value pairs wing: -1.33 and -2.352.
determination of these two 5). The data of South 72 and -1.178.
-distribution diagrams related correspond to the population tical areas, respectively.
istribution diagrams related to (A) and (B) correspond to the anistical areas, respectively.
Á. Varga et al. • Investigation of the Urbanistical Complexity in Global Scale
– 182 –
In case of Europe we receive very nice the first sections of which are well straight lines (Fig. 6). The data of Europ -0.9743. It is visible, that the expone population are changing between -0.5 exponents related to the area are rang and -2.4. The calculated exponents pr Figure 4. This figure shows the size-distribut to North America. The diagrams (A) and (B population of the cities and their urbanistical
Figure 5. This figure shows the size-distributi to South America. The diagrams (A) and (B) population of the cities and their urbanistical
e decay flat curves, approximated by pe: -0.7138 and ents related to the
58 and -1.7. The ged between -0.97 retty differ. In the
evaluation of the curves, w exponents, but the decay of the this, because at the beginning certain cases was hard to app therefore there is some uncertai
As we mentioned above, the reference, because these curves decay. The determination of problem (-0.7138 and -0.9743) figure that Europe regarded as evolution, i.e. formed on self- both for the population density In case of Asia it is also easy system with small fluctuations and areal curves contain more parts.
This small fluctuation is due to this is in context of this diff areas. In case of Australia we although it is well-approximat this can be written for the acc amount of data. In case of No also observable. The fit of a st the obtained curve is not smo also stated here, but the slow, as in Europe, are not located, w curve.
Perhaps in case of South Amer the least nice. Here, due to mountains the urbanistical are tion diagrams related
B) correspond to the l areas, respectively.
on diagrams related ) correspond to the
areas, respectively.
Figure 6. This figure shows the siz to Europe. The diagrams (A) and (B
of the cities and their urbanis
we studied not only the e curve as well. We needed
of the depicted curves, in proximate by straight line,
inty in the exponent.
case of Europe can be a s have a pretty and smooth the exponents was not a . It is well-visible from the s one system, with natural -assembled way. It is true
and the areal density.
y to determine, that it is a s. The produced population e slightly different gradient
o the large area of Asia and ferent climate and cultural
do not get smooth curve, ed by straight line. Maybe count of the relative small orth America, fractures are traight line is possible, but ooth. The self-assembly is spanning historical periods which results pretty smooth
rica the population curve is the jungles and the high ea formed separately. The ze-distribution diagrams related B) correspond to the population
stical areas, respectively.
– 183 –
ICCC 2013 • IEEE 9th International Conference on Computational Cybernetics • July 8-10, 2013 • Tihany, Hungary
size of the exponent is characterized in how fast changes the settlement size. I tical areas of Europe and Asia, there is behavior. There are differences in the ents due to the metropolis of Asia. In A are higher, than the average. This prov dense and concentrated large towns. In and Oceania, the exponents are simila vestigation considers only the large se necessary to consider not only the grad but the absolute values of the values, f plete evaluation. In the last, seventh plotted the all data (Fig. 7).
In the evaluation of the curves we get and for the area the -0.9946 and -1.420 of the curves is well-smooth. The straig identifiable, so we can declare that th self-assembly is observable in global siz
CONCLUSION We showed, that both in continental an section of the curve shows power fun the case of larger towns. In our pr showed, that this complex behavior wo only in the size, but in the areas and i well [3]. We would like to continue the examine the area, and the distance int scales, in order to study the laws of self-
ACKNOWLEDGMENT
The present work based of large-scal The data collection beside authors hap ticipation of the following students: Bal Figure 7. This figure shows the size-distributi to All Continent. The diagrams (A) and (B) population of the cities and their urbanistical
that direction, that In case of urbanis- s a roughly similar
population gradi- America both value
ves the presence of n case of Australia ar. The present in- ettlements, so it is dient of the curves, for the more com-
diagram pair, we
for the population values. The decay ght section is well he attribute of the ze as well.
nd in global size, a nction, typically in revious study we orks regarding not in the distances as e present work and teraction in global f-assembly.
le data collection.
ppened by the par- lázs Bence Dobrai,
Péter Kertész, Gábor Balázs S authors are indebted for their ried out in the frame of TU1104
REFERE
[1] Mila Boncheva George M. Whit assembly of mesoscopic and ma Natl. Acad. Sci. USA. 2002 April 4774.
[2] Jonathan P Hill, Michael V Lee Somobrata Acharya Katsuhik breakthroughs in recent research Adv. Mater, vol. 9, pp. 1-96, 2008 [3] A. Ürmös, Á. Nemcsics, "Ur Hungarian regions in the v influence," , Proc. of Conference o published), 2013.
[4] F. Dittes, Komplexität. Heidelberg [5] L. Dobos, B. Kovács, I. Mojz
character of in-situ heat treated contact," J. Mater. Sci.: Mater Ele [6] M. Schuszter, L. Dobos, Gy. Bal
investigation of the electrochemic Mat. Sci. Eng. B 90 (2002) 67, vo [7] Sz. Nagy, I. Mojzes, R. Schwedh Kipp Á. Nemcsics, "Investigatio epitaxially grown fullerene struct 154, 2009.
[8] B. Varga, A. Ürmös, Sz. Nagy, a of gold, palladium and gold-palla (Elsevier), vol. 84, pp. 247-250, 2 [9] Kovacs B., Schuszter M., Kun I. M
Mate L., "Fractal behaviour of th metal-InP contacts," Thin Solid 71(3), April 1998.
[10] Á. Varga, Városfejlődés környe 2013, BSc szakdolgozat, Óbudai E [11] J. A. Tenreiro Machado, Gonçal
Duarte, "Dynamics of the Dow indexes," Nonlinear Dynamics, September 2010.
[12] António C. Costa, Miguel F. M
"Dynamical analysis of composit 65, no. 4, pp. 399-412, April 2012 ion diagrams related
correspond to the areas, respectively.
Seprűs, Péter Ormos. The work. This work was car- 4 project.
ENCES
esides, "Beyond molecules: Self- acroscopic components," in Proc
l 16, vol. 99(8), 2002, pp. 4769–
, Ajayan Vinu, Richard Charvet, ko Ariga, "Challenges and
on self-assembly," Sci. Technol.
8.
rbanistical comparation of two viewpoint of geomorphological
of ELCAS, Nisyros-Greece (to be g: Springer Vieweg, 2012.
zes, B. Pécz L. Dávid, "Fractal metal-compound semiconductor ectron, vol. 17, p. 321, 2006.
llai Á. Nemcsics, "Morphological cally etched GaAs (001) surface,"
l. 90, pp. 67-71, 2002.
helm, S. Woedtke, R. Adelung, L.
on of the surface morphology on tures," Vacuum, vol. 84, pp. 152- and I. Mojzes, "Fractal properties adium thin films on InP," Vacuum 2010.
Mojzes I. and Dobos L., David L.
he surface of in situ heat treated Films, vol. 317, no. 1, pp. 69- ezeti és gazdasági vonatkozásai,
Egyetem.
lo Monteiro Duarte Fernando B.
Jones and the NASDAQ stock vol. 61, no. 10, pp. 691-705, . Lima J. A. Tenreiro Machado, tions," Nonlinear Dynamics, vol.
2.
Á. Varga et al. • Investigation of the Urbanistical Complexity in Global Scale
– 184 –