Microfluidic Particle Separation Techniques for Biomedical Use
Andr´ as J´ ozsef Laki
Faculty of Information Technology and Bionics P´azm´any P´eter Catholic University
Supervisors:
Krist´of Iv´an, Ph.D.
Pierluigi Civera, Ph.D. † Danilo Demarchi, Ph.D.
A thesis submitted for the degree of Doctor of Philosophy
June 2015
Acknowledgements
I would like to thank my supervisors: Tam´as Roska†, Pierluigi Civera†, Krist´of Iv´an, and Danilo Demarchi for having kept me on track. You were always a source of new, and different perspectives to every problem. I greatly appreciate all of the help from the members of the Department of Genetics, Cell- and Immunobiology, the Department of Biophysics and Radiation Biology at Semmelweis University, and the Faculty of Veteri- nary Science at Szent Istv´an University especially from Edit I. Buz´as, Viola Tam´asi, Tam´as Szab´o, Mikl´os Kellermayer, Istv´an Husz´ar, ´Eva Fok, and Olga Jacs´o.
I am grateful to P´eter F¨urjes, Zolt´an Fekete, Magdolna Er¨os, K´arolyn´e Payer, Gabriella Bir´o and other members of MEMS Laboratory at Research Centre for Natural Sciences of Hungarian Academy of Sciences for helping me in the fabrication of the microfluidic devices. I would like to thank my colleagues at the Polytechnic University of Turin especially to Paolo Motto†, Alessandro Sanginario, Dario Trimarchi, Andrea Carola, Ismael Rattalino, Alice Diemonte and the other member of the MINES lab. Finally, I would like to thank my colleagues and my students at the P´azm´any P´eter Catholic University, especially to Eszter Leel¨ossyn´e T´oth, Zs´ofia Szty´ehlikn´e B´erces, and M´arton Hartd´egen.
I have been blessed with a wonderful family that has been an unending source of support and encouragement. I especially want to thank my parents for giving me strength to continue. Finally, I give my deepest thanks to Agnes for her amazing love and support.´
Abstract
Sorting and separation of micron-sized particles have an increasing impor- tance in biomedical diagnostics, biochemical analyses, food and chemical processing, and environmental assessment. By employing the unique char- acteristics of microscale flow phenomena, various techniques have been es- tablished for fast and accurate separation, and sorting of cells or parti- cles in a continuous manner. As in classical separation procedures, the size-fractionation of particles or cells could be realized in passive or active methods. Passive procedures, which do not require any external force-field, utilize the interaction between particles, flow, and the channel structure and particles to separate different-sized particles. Meanwhile, active separation techniques make use of external force-fields in different ways.
This doctoral thesis provides a novel pathogen detection device (Flow Through Nematode Filter, FTNF), and a novel application of an asym- metric column structure, which is called deterministic lateral displacement (DLD) device. These can be integrated into biochips that can provide fur- ther downstream analysis of the separation products. The working princi- ples are explained in detail, and performances of the devices are discussed through measurement results.
The main application target of the present work is medicine and biomedical research but we are also open for other application areas. The use of these simple microfluidic devices will make it possible to extend the use of cell- sorting in point of care settings, closer to the patient at the clinic or in the field.
Keywords: Microfluidic fractionation procedures · Pathogen en- richment from blood · Blood fractionation · Microvesicle separa- tion from serological samples
Contents
1 Introduction 1
1.1 Traditional Fractionation Techniques of Biological Samples . . . 2
1.2 Review of Separation Technologies Integrated into Microfluidic devices . 3 1.3 Structure of the Thesis . . . 6
2 Hematology, Hemorheology, and Hemodynamics 7 2.1 Hematology . . . 7
2.2 Hemorheology and Hemodynamics . . . 10
2.2.1 Velocity and Pressure Profile . . . 10
2.2.2 Energy Conservation . . . 12
2.2.3 Volumetric Flow Rate and Hydrodynamic Resistivity . . . 12
2.2.4 Kinematic Properties . . . 13
2.2.5 Effects of Viscoelasticity . . . 16
3 Flow Through Nematodes Filter 19 3.1 Filtration of Nematodes Using an Integrated Microcapillary System . . 19
3.1.1 Motivation, description of the problem to be solved . . . 19
3.2 Device Principles . . . 27
3.3 Computational Fluid Dynamic Simulations . . . 29
3.4 Device Design and Fabrication . . . 32
3.5 Experimental Setup . . . 33
3.6 Experimental Results . . . 34
3.7 Results with the Flow Through Nematode Filter . . . 38
3.8 Related thesis groups . . . 39
4 Deterministic Lateral Displacement Based Fractionation 41
4.1 Separation of Microvesicles from Serological Samples . . . 41
4.2 Design Parameters of the Developed Microfluidic Device . . . 44
4.3 Flow and Pressure Profiles of the DLD Structure . . . 46
4.4 Device Fabrication . . . 49
4.5 Sample Preparation . . . 49
4.6 Experimental Setup . . . 50
4.7 The Developed Cell Counting Algorithm . . . 50
4.8 Experimental Results . . . 54
4.9 Device Principles . . . 56
4.10 Inertia-based Particle Separation Theory . . . 58
4.11 Uncovered Research Fields of the DLD effect . . . 66
4.11.1 Post-Particle Interactions . . . 66
4.11.2 Particle-Particle Interactions . . . 67
4.11.3 Sidewall Effect . . . 67
4.11.4 Shape of the Obstacles . . . 67
4.11.5 Separation or Concentration Modes . . . 70
4.11.6 Dynamic Range of the Separation . . . 71
4.11.7 Shape, Deformation, and Rotation of the Particles . . . 71
4.12 Conclusion and outlook . . . 71
4.13 Related thesis groups . . . 74
5 Conclusions and outlook 76
6 List of the Publications 79
Chapter 1
Introduction
Microfluidics concerns design, fabrication, and experiments of miniaturized fluidic systems, which has undergone rapid developments during the last two decades [1].
As an interdisciplinary area, this rapidly growing field of technology has numerous applications in biomedical diagnostics, chemical analysis, automotive, and electronic industries [2]. One of the pivotal applications of microfluidics is the development of lab- on-a-chip (LOC) devices as point-of-care (POC) diagnostic tools. A typical LOC device includes various functional modules: sample transport, sample preparation, separation, detection, and analysis module [3, 4]. The label-free size separation of particles or cells is vital to many of the analytical and preparative techniques used in the fields of chemical, biochemical, and clinical analysis, which led to ground breaking advances in terms of speed of analyses, resolution of separations, and automation of procedures [5].
Additionally, microfluidic separator devices can form a part of portable systems for point-of-care or on-the-spot detection [6].
Several variations of microfluidic cell sorters, which implement different sorting mechanisms, have been designed and fabricated [7, 8]. The chosen method of particle handling is generally based on the nature of application, which strongly depends on the composition of the sample and the final goal of the analysis should also be considered.
Several strategies exist for this purpose based on specific cell/particle characteristics including manipulation of particles in fluids or removal of particulate matter from fluids [9]. The particles may act or interact with the analyte, in which case they need to be removed from the sample [10].
1.1 Traditional Fractionation Techniques of Biological Samples
In traditional cell isolation processes, size separation is commonly used to separate mixtures of cells or particles before subsequent analysis or culturing [10]. Cells ex- hibit variations in their hydrodynamic radii stemming from changes in volume, shape or mechanical properties, dependent on their state of health [11]. The existing cell separation methodologies can be classified into two main groups to enrich selected sub- populations [8]. The first group is based on physical descriptors like size, shape, and density differences and includes filtration and centrifugation techniques, which are com- monly used for debulking heterogeneous samples [12, 13]. The second group comprises affinity methods such as capture on affinity solid matrix (beads, plates, fibers) [14–16], fluorescence-activated cell sorting (FACS) [17, 18] and magnetic cell sorting [19, 20], which are based upon biochemical cell surface characteristics and biophysical crite- ria [8].
Traditional fractionation instruments ranging in size from desktop to room sized models are standard pieces of equipment at most clinical laboratories and are used to analyze and separate cells and other biological particles [21]. The drawbacks of the existing, traditional flow cytometers are that these devices are expensive, require an ex- tensive complementary infrastructure; such as facilities, personnel and reagents. They are not suited to integration with other analysis steps, and time is required to process the signal data limits the rate at which cells can be detected. Much work is therefore being done to develop methods that will not only be cheaper, and therefore more easily available, but also more effective and possibly able to probe particle properties not currently accessible [21].
In clinical diagnostic sense, cell sorting and counting devices are examples of tech- nological solutions that have been designed and optimized for use in centralized lab- oratories, much like the very first computers. Also nowadays the biological samples (blood, urine, other biological liquids) are collected from patients at the hospitals, at home or in special environments and sent to these centralized diagnostic laboratories where analysis takes place. However, the transportation of samples requires money and time, and the quality of samples may decay due to natural biological processes.
1.2 Review of Separation Technologies Integrated into Microfluidic devices
The trend in life science research to miniaturize analytical processes using microflu- idic devices, was first seen in the late eighties, and it is still ongoing [1]. The benefits of miniaturization and integration are including increased automation, parallelization, speed, resolution and portability as described in reviews by Mosadegh [22], Craig- head [23], Mark [24], Erickson [25], Franke [26] and Dittrich [27]. The idea of integrat- ing sampling, sample handling, reactions, separations and detection into one automated device containing interconnected microchannel networks led to the introduction of the term micro-total-analysis-system (µTAS) in the literature in 1990 by Manz et al. who performed first on-chip separation implementing capillary electrophoresis fractionation of fluorescent molecules [28, 29]. Since that time, applications of µTAS has developed over the past two decades exponentially, meanwhile scientific journals, conferences, and companies specializing in LOC technologies are vivid examples of how theinterest in this field has grown.
In sense of cell isolation, the efficiency of fractionation takes into consideration the available sample volume for analysis, the characteristic/feature that distinguishes the cell types, the required purity of the separated population with desired characteristics, the total number of cells lost during the process of separation, the viability of cells after separation and the physical stress endured by the cells. Finally, choosing an efficient sample handling procedure, the time required for the complete cell separation process and the cost-effectiveness of the technique are also not negligible.
The integration of particle separation techniques into lab-on-a-chip devices is advan- tageous, as described by Pamme [30], that these label-free processes are continuous, the separation can be monitored continuously and the sample components are displaced lat- erally thus each fraction could be collected independently. Based on the applied forces the fractionation could be tangential or perpendicular to the flow direction and can be realised as batch or continuous loading procedures (Fig. 1.1). In batch separation techniques, the particles follow the same paths but at different rates which appears as fractionation over time only; thus, these procedures require precise injection of a very small amount of sample into the separation channel. At the other case, the ap- plied forces have perpendicular components to the flow direction thus the particles are
Figure 1.1: Batch separation procedure entails the injection of finite volumes parallel to the flow direction into a separation column. The separated sample fractions pass through a detector at different times, often followed by repeats to optimize separation parameters.
Collection of the separated fractions can only be achieved with a flow switching mechanism that redirects different components to different outlets. Continuous procedure separate perpendicularly to the flow direction. The sample is injected continuously together with a carrier liquid, meanwhile the separation efficiency can be monitored in real-time. (adapted from Ref. [30])
displaced laterally and become separated in space.
A range of field flow fractionation (FFF) techniques have been reported for sepa- ration of particles in lab-on-a-chip based microfluidic systems [30] since FFF method was pioneered by Giddings in 1960s [31]. The continuous-loaded single-phase field flow fractionation requires external forces or uses only inertial shear forces.
Large variety of methods have been developed to date that operate by external forces but in each case, the special cell properties and attributes have to be taken into consideration. Table 1.1 gives an overview of the different continuous particle separation methods which are based on external perpendicular forces to the direction of flow and focuses on the utilized external forces and the basis of separation. These separation methods can be classified by the applied external forces into acoustophoresis, dielectrophoresis, magnetophoresis, appication of mechanical forces and optophoresis.
The requirement of external forces increases the complexity of the device and may limit the application for some specific reagents such as biological samples. Conse-
Method Separation induced by Separation based on References Acoustophoresis Acoustic pressure Size, density,
compressibility
[32–37]
Dielectrophoresis Inhomogeneous electric field
Size, polarisability [38–45]
Magnetophoresis Inhomogeneous mag- netic field
Size, magnetization [46–51]
Mechanical forces Gravity, centrifugation Size, density [52–55]
Optophoresis Optical force Size, refractive index [56–58]
Table 1.1: Listing of continuous flow separation methods using external forces with details of the forces utilized and the basis of separation were taken from the selected references.
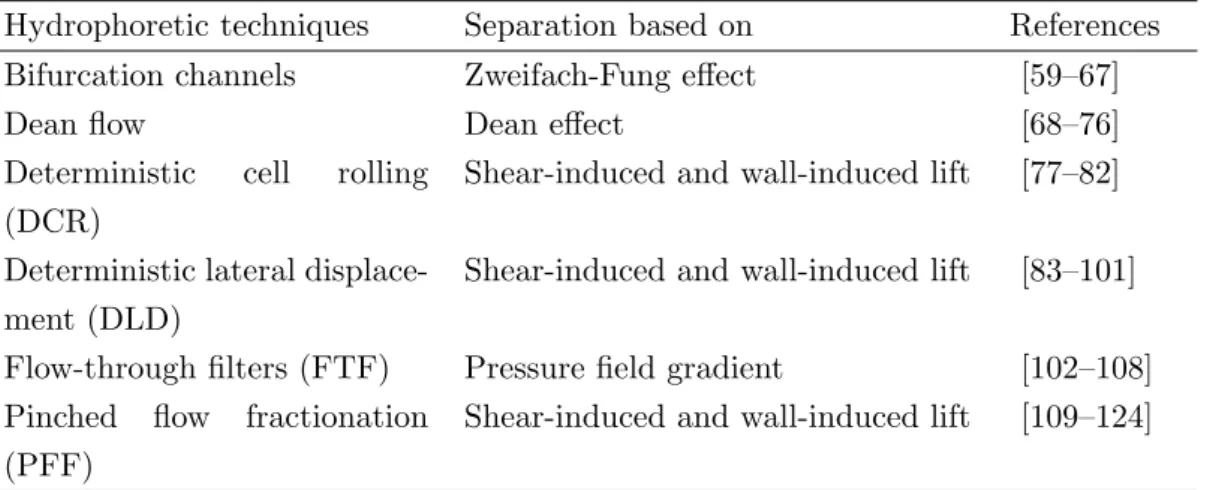
quently, researchers have been paying attention to the development of novel physical methods (Table 1.2), which are based on varying only the geometry of microchan- nels, modifying the flow profile and influencing local flow properties such as bifurcation channels, deterministic cell rolling (DCR), deterministic lateral displacement (DLD), pinched-flow fractionation (PFF) devices, applying Dean effect, or using flow-through filters/membranes.
Hydrophoretic techniques Separation based on References
Bifurcation channels Zweifach-Fung effect [59–67]
Dean flow Dean effect [68–76]
Deterministic cell rolling (DCR)
Shear-induced and wall-induced lift [77–82]
Deterministic lateral displace- ment (DLD)
Shear-induced and wall-induced lift [83–101]
Flow-through filters (FTF) Pressure field gradient [102–108]
Pinched flow fractionation (PFF)
Shear-induced and wall-induced lift [109–124]
Table 1.2: List of continuous flow separation methods using inertial forces detailing the basis of separation based on the selected references.
Comparison of performance of integrable sample fractionation methods is not always straightforward. Plenty of approaches provide high throughput, meanwhile others offer high resolution. Several of the microfluidic devices are simple in terms of operation,
whilst other techniques might require a specialist. A number of separation principles require labelling the sample components, whereas some processes are based on intrinsic sample properties. As always, the optimum method will depend on the sample and the analytical task at hand.
1.3 Structure of the Thesis
Chapter 2 discusses the main physical properties of serological samples, which gives a short discussion of hemodynamic principles is beyond the scope of this thesis but in this chapter, an overview of basic principles is presented that are helpful in understanding the physical background.
Chapter 3 discusses a novel microfluidic device to observe uncovered parasitosis from serological samples. This chapter is based on work published in Springer - Bio- NanoScience [125] and presented at international conferences, which starts with a short introduction, represents the physical principles, and shows the results of computational fluid dynamic simulations, and the experimental tests.
Chapter 4 discusses a novel application of the deterministic lateral displacement device. This chapter starts with the description of physical principles, continues with computational fluid dynamics results and concludes with the evaluation of the ex- perimental results using the DLD structure to separate microvesicles from serological samples. The results presented in Chapter 4 excluding the discussion on the description of principles was also published in Springer - BioNanoScience [126].
Chapter 2
Hematology, Hemorheology, and Hemodynamics
2.1 Hematology
Blood (sanguis), wihtout doubt the most important biological fluid, performs many fundamental functions to maintain homeostasis; from transporting nutrients and oxygen to tissues and organs to regulating pH and temperature. It also provides an efficient transit system through the vascular network for transporting of immune cells as a defense against foreign microbes and wound healing. As blood contains a myriad of information about the functioning of the human body, complete blood analysis has been a primary diagnostic test in our healthcare system.
The total volume of body fluid is distributed mainly between two compartments:
the extracellular fluid and the intracellular fluid. The extracellular fluid is divided into the interstitial fluid and the blood plasma. In an average 70-kilogram adult human, the total body water content is about 60 % of the body weight, or about 42 liters [127].
This percentage can change, depending on age, gender, and degree of obesity. About 28 of the 42 liters of fluid in the body are inside the 75 trillion cells and are collectively called the intracellular fluid, which is almost the 40 % of the total body weight [127].
All the fluids outside the cells are collectively called the extracellular fluid. Together these fluids account for about 20 % of the body weight, which is about 14 liters [127].
The two largest compartments of the extracellular fluid are the interstitial fluid, which makes up more than three fourths of the extracellular fluid, and the plasma, which
makes up almost one fourth of the extracellular fluid, or about 3 liters.
Blood contains both extracellular fluid (the fluid in plasma) and intracellular fluid (the fluid in different blood cells). The average blood volume of adults is about 7 % of body weight, or about 5 liters [127]. The composition of the blood are cells and plasma (Table 2.1), which comprises mostly water and contains glucose, proteins, hormones, mineral ions, gases. The cells of blood (Table 2.2) present are red blood cells (called RBCs or erythrocytes) white blood cells (called WBCs or leukocytes) and platelets (PLT,thrombocytes).
Name Mass concentration Name Mass concentration
[mg/dl] [mg/dl]
Sodium 340 Calcium 10.6
Cloride 340 Lactic acid 10
Phospholipids 280 Phosphate 4.5
Cholesterol 150 Magnesium 2.3
Bicarbonate 140 Uric acid 3
Neutral fat 125 Creatinine 1.5
Glucose 100 Bilirubin 0.5
Potassium 20 Bile salts 0.5
Urea 15 Else 4.9
Table 2.1: Average mass concentration of human blood plasma constituents [127]
Name Average cell Approximate Percentage of concentration normal range volume
[cells/ml] [cells/ml] [%]
Erythrocytes 4.8·106 4.5−6.2·106 91 Leukocytes 9.0·103 4.1−10·103 5 Neutrophils 5.4·103 3.0−6.0·103
Eosinophils 2.7·102 1.5−3.0·102 Basophils 6.0·101 0−1.0·101 Lymphocytes 2.7·103 1.5−4.0·103 Monocytes 5.4·102 3.0−6.0·103
Thrombocytes 3.0·105 1.5−4.0·105 4
Table 2.2: The size, percentage and the concentration of the main blood cells [128]
The red blood cells are without nucleus, biconcave, disc-shaped bodies. From upper view, their shape is circular, with an average diameter of 7.5µm. The number of RBCs is around 4.5−6.2·109 particles/dl [129]. The red blood cells are perfectly elastic structures, flexibly deformable, thus they can pass thought much smaller capillaries than their diameter. The shape of RBCs is sensitive to osmotic variance. In hypotonic milieu (where the concentration of the salt is lower than 0.9 %) the shape of the cells change to spherical shape and after that the cells bursts and the hemoglobin flows out.
In this case we get a hemolyzed solution with the hemoglobin and the membranes of the red blood cells.
The average cell concentration of leukocytes is around 4.1−10·106particles/dl[129].
White blood cells are divided into several subclasses, for example basophils, eosinophils, lymphocytes, monocytes and neutrophils. These cells have a great wealth of form and functional character.
The platelets are ovoid, round, flat disc-shaped structures. These cell fragments lack a nucleus. The diameter of the platelets is 2-4 micrometers and their number is around 1.4−4.2·108 particles/dl[129]. The platelets are responsible for blood clotting (coagulation), by converting fibrinogen to fibrin. This creates a mesh onto which red blood cells adhere and clot, which then stops more blood from leaving the body and also helps to prevent bacteria from entering the body.
Blood performs many important functions. First of all it transports oxygen to tis- sues. Blood supplies the cells with nutrients such as glucose, amino acids, and fatty acids, removes waste (carbon dioxide, urea, and lactic acid). It has a messenger trans- port function with hormones and the signaling of tissue damage as well. The blood is supporting the body’s self-repair mechanism with the coagulation functionality. White blood cells make immunological detection functions of foreign material by antibodies.
The blood makes the regulation of body pH (the normal pH of blood is in the range of 7.35 - 7.45). Also, it helps in the regulation of core body temperature.
2.2 Hemorheology and Hemodynamics
Hemodynamics is concerned with the mechanical and physiologic properties describ- ing motion and equilibrium of blood flow under the action of external forces. Further, hemorheology describes the rheological properties of blood and its elements, such as morphology of blood cells and blood viscoelasticity. A full discussion of hemodynamic and hemorheology principles is beyond the scope of this thesis but in this chapter, an overview of basic principles is presented that are helpful in understanding the physical background. Blood is a non-Newtonian fluid, but in narrow microfluidic channels the flow properties of the human blood could be approximated as Newtonian [130]. Based on this assumption, the following equations describe Newtonian fluid properties and are solved with the physical parameters of human blood.
2.2.1 Velocity and Pressure Profile
The sample flow in microchannels has often been associated with negligible inertia that is, fluid flow in microfluidic channels is assumed to occur at low Reynolds number, where Reynolds number is a dimensionless parameter describing the ratio between inertial and viscous forces in a flow. The liquid flow is in stream that is considered to consist of a series of thin laminae slipping over one another, meanwhile in turbulent case the blood moves in irregular varying paths continuously mixing within channels.
The description factor for stream types laminar and turbulent, which was introduced by Stokes, but measured by Reynolds, is described as:
Re= ρDHv
µ , (2.1)
which is also called Reynolds number, whereρ is the density of mass, DH is the char- acteristic hydraulic diameter,v is the mean velocity of the fluid, andµis the dynamic viscosity. In a Stokes flow regime, where Re → 0, the inertia of the fluid is ignored in most microfluidic platforms and contributions of fluid momentum are omitted from the NavierStokes equations resulting in linear, and thus time-reversible, equations of motion for Newtonian fluids. Practically achievable and useful flows in microfluidic systems could operate also in intermediate range flow (∼1<Re<∼100) in which non- linear and irreversible motions are observed for fluid and particles. The intermediate range flow regime, in which both the inertia and the viscosity of the fluid are finite,
still lies within the realm of laminar flow which provides a deterministic nature and thus controllability of fluid and particles within. In the consideration of our application for blood with density of 1060kg/m3, shear viscosity of 3.53·10−3 P as, the range of Reynolds number is shown in Fig. 2.1.
Figure 2.1: The Reynolds number of blood flow (ρ= 1060kg/m3andµ= 3.53·10−3P as) is calculated at different velocities (1mm/s, 5mm/s, and 10mm/s)
assuming Newtonian flow behavior at different characteristic hydraulic diameters (log scale).
For cases of low Reynolds number, neglecting inertia by using a Stokes flow ap- proximation can lead to incorrect results. To determine exactly the velocity and the pressure profile in a microfluidic channel, incompressible Navier-Stokes equation is ap- plied assuming constant viscosity (µ). The Navier-Stokes equation is derived from the basic laws of conservation of mass, momentum and energy in the following way:
δ−→v
δt +−→v · ∇−→v =−∇P+ν∇2−→v +F, (2.2) where −→v is the velocity vector, P is the pressure and F is the sum of external body forces (e.g. gravity, electrophoretic forces, magnetophoretic forces, mechanical forces (i.e. ultrasound) and optophoretic forces).
2.2.2 Energy Conservation
Assuming no friction inside the flow, Bernoulli’s equation can be derived from the Navier-Stokes equation (Eq. 2.2). Bernoulli’s principle (conservation of energy) states that for an inviscid flow, an increase in the speed of the fluid occurs proportionally with an increase in both its dynamic pressure and kinetic energy, and a decrease in its static pressure and potential energy, which can be described in the following way:
∆P ρ +v2
2 +agravh= 0, (2.3)
where ∆P is the pressure drop, agrav is the gravitational acceleration and h is height of fluid. This states that, in a steady flow, the sum of all forms of mechanical energy in a fluid along a stream is the same at all points on that stream, thus this requires that the sum of kinetic energy and potential energy remains constant.
2.2.3 Volumetric Flow Rate and Hydrodynamic Resistivity
One of the properties of a fluid is that it will flow from a region of higher pressure toward a region of lower pressure. The primary parameter used in lab-on-a-chip devices to describe blood flow is the flow rate, which is the total volume of liquid pumped through the channel in a given time interval. The relationship between blood flow, resistance, and pressure in cylindric channels can be determined using the Hagen- Poiseuille law:
Q= ∆P πr4
8µL , (2.4)
whereQis the flow rate, ∆P is the pressure gradient,ris the radius of channel,µis the viscosity of fluid (in our case: blood), L is the length of channel. The flow resistance can be considered in the following representation:
R= µL
8πDH4, (2.5)
where DH is the hydraulic diameter. Generally, the length of microfluidic channels is in millimeter scale while the hydraulic diameter, which is a commonly used term when handling flow is well bellow the millimeter scale in noncircular tubes or channels, and is defined by:
DH = 4A
B , (2.6)
where A is the cross sectional area and B is the wetted perimeter. The microfluidic channels that are generally used in microfarication have a rectangular cross-section, in which case the hydraulic diameter (DH) can be considered in the following way:
DH = 2wh
w+h, (2.7)
wherewis the width (w≈100µm) andhis the height (h≈20µm) of our designs thus the typical value of the hydraulic diameter is around 33µm. According to Eq. 2.4 the flow rateQ, which is determined by the pressure gradient, radius of channel, viscosity of fluid and length of the channel, is inversely proportional to the fluid resistance (Eq. 2.5) and it can be described as:
Q= ∆P
R . (2.8)
In this case Eq. 2.4 can be considered analogous to Ohm’s law, hence the flow rate is inversely proportional to the resistance. The walls of the microfluidic channels are considered as rigid thus the Hagen-Poiseuille law is applicable. If we consider a 1 mm long straight microchannel with 20µmdepth and the width from 10µmup to 300µm the order of magnitude of flow resistance of blood flow is between 1010−1012P as/m3, meanwhile the total pressure drop is in the range from a fewkP a up to 100kP a.
2.2.4 Kinematic Properties
In microfluidic channels, the flow is usually smooth and orderly because the fluid separates into an infinite number of concentric layers with different velocities. When a fluid (in our case: blood) flows past a solid surface, a thin layer develops adjacent to the surface where frictional forces retard the motion of the fluid. There is a gradient of frictional resistance between fluid in contact with the solid surface and fluid in the center of the stream. If the fluid particles travel along well-ordered nonintersecting layers, this is termed laminar flow. In a small Reynolds number case, the floating particles are moved by the fluid through a viscous Stokes drag and their trajectories areXp(t) [131]:
dXp
dt =Vp, (2.9)
dVp
dt =−1
τp [Vp−v(Xp, t)] +g, (2.10)
wheregis the acceleration of gravity,τp is the relaxation time of the particle, which is:
τp = 2ρpr2particle
9µ , (2.11)
where ρp is the mass density of the particle and rparticle is the radius of the particle.
The fluid velocity at the location of the particles is evaluated by linear interpolation.
The inertia of the particle becomes dominant at higher velocities or masses.
Physical property Blood Water [132] Dimension
Density (ρ) 1.06·103 [133] 1.0·103 [kg/m3] Shear viscosity (µ) 3.53·10−3 [134] 1.0·10−3 [P as]
Kinematic viscosity (ν) 3.33·10−6 [135] 1.0·10−6 [m2/s]
Surface tension (in air) (γ) 5.8·10−2 [136] 7.3·10−2 [kg/s2]
pH 7.35-7.45 [137] 7
hematocrit 45.7 [138] [%]
Table 2.3: Physical properties of human blood (at 37◦C) and water (at 20◦C) at 1atm pressure
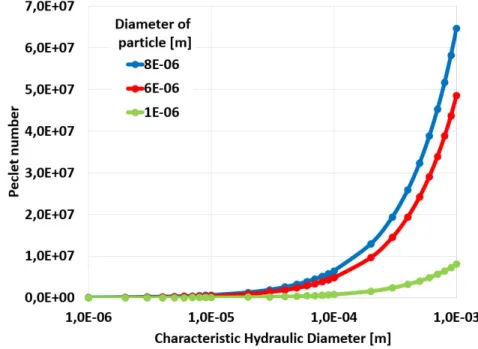
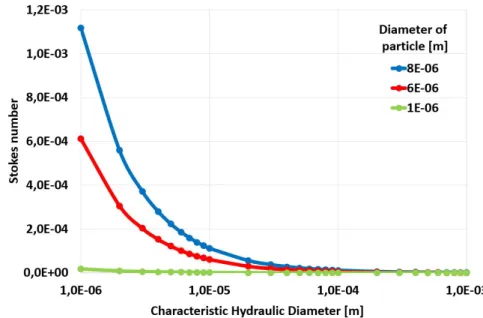
There are dimensionless numbers that provide information about the qualitative behavior of flow in a continuous single-phase liquid. The Reynolds number (Re) de- termines the inertial effect of fluid flow (turbulency), and the P´eclet number (P e) describes the mass transport contribution of molecules or particles (dispersion). The particle Reynolds number (Rep) shows the inertial effect on a particle within a fluid flow, and the Stokes number (St) is useful to study the trajectory mismatch between the particle and fluid, and the size-based separation effect.
The particle Reynolds number (Rep) can be defined as follows from [139] and is represented in Fig. 2.2:
Rep= ρvmaxd2particle µDH
=Red2particle
D2H , (2.12)
whereRe is the Reynolds number, dparticle is the particle diameter, vmax is the maxi- mum flow velocity and µis the shear viscosity (in our case, blood at 3.53·10−3 P as).
In case of mass transport, the particle motion can be estimated by the P´eclet number:
P e= vmeanDH
D , (2.13)
Figure 2.2: Particle Reynolds number of different size particles (1µm, 5µm, and 8µm) at different characteristic hydraulic diameter (log scale) at 1mm/sflow rate within blood (ρ= 1060kg/m3andµ= 3.53·10−3 P as).
where vmean is the mean velocity of the fluid (in our case, v ≈ 1.0·10−2 m/s) and D is the diffusion coefficient of particles. The diffusion coefficient of the particles is described by the Stokes-Einstein equation:
D= kBT
6πµrparticle, (2.14)
where kB is Boltzmann’s constant (1.38·10−23 J/K), T is the absolute temperature (in our case: 298K), and rparticle is the radius of a spherical particle. In consideration of blood cells, the shape of the particles are not perfectly round and rigid but in these models blood cells can be approximated using perfect spherical particles. If P e>1 the advection rate is bigger than the diffusion rate thus the particles are basically confined to streams. When a particle encounters an accelerating flow in a nonlinear channel, the Stokes number estimates the particle behavior as the ratio of the relaxation time of the particle (τp) (eq. 2.11) to the characteristic time of the flow (τf):
St= τp
τf = 2ρpr2particle/9µ DH/vmax = ρp
18ρRep, (2.15)
where vmax is the maximum fluid velocity well away from the obstacle, ρp and ρ are the particle density and fluid density.
If St>1, a particle will continue in its original direction of movement instead of following the fluid stream when the flow turns suddenly due to the channel geometry.
The P´eclet and the Stokes number of the main blood components at 0.001 m/s flow rates are demonstrated in Fig. 2.3 and in Fig. 2.4.
Figure 2.3: Peclet number of different size particles (1µm, 5µm, and 8µm) at 1mm/s flow rate within the blood (ρ= 1060 kg/m3 and µ= 3.53·10−3 P as)at different charac- teristic hydraulic diameters (log scale) using a Newtonian fluid approximation of blood.
2.2.5 Effects of Viscoelasticity
Since blood is a non-Newtonian fluid, its rheological properties depend on shear rate and the dimensions and the geometry of the conduit through which it flows. The cellular components are suspended in plasma, an aqueous solution that generally follows Newtonian dynamics. Since flow resistance is affected in many pathological conditions, quantitative approaches have been proposed to characterize the complex rheological properties of blood. Blood cells suspended in plasma will deform due to the interactions with the surrounding fluid and walls, described by viscous stress tensor (τ) this results in a gradual deformation over time. The rate of shear, also called velocity gradient, is caused by the laminar flow along the channel where the lamellae slip on one another
Figure 2.4: Stokes number of different size particles (1µm, 5µm, and 8µm) at 1mm/s flow rate within the blood (ρ= 1060 kg/m3 and µ= 3.53·10−3 P as)at different charac- teristic hydraulic diameters (log scale) using a Newtonian fluid approximation of blood.
and move at different speeds perpendicular to the wall. If the ratio between shear stress and rate of shear strain is linear the fluid is considered Newtonian fluid. For an incompressible and isotropic Newtonian fluid, the viscous stress is related to the strain rate by the simpler equation:
τ =µδv
δy, (2.16)
whereδv/δyis the derivative of the velocity component that is parallel to the direction of shear, relative to the displacement in the perpendicular direction. In application the liquid flow, which is vertebrate blood, is composed of blood cells suspended in blood plasma. The plasma, which constitutes 55 % of blood fluid, is an aqueous solution containing 92 % water, proteins, dissolved nutrients (amino acids, fatty acids and glu- cose), waste products (carbon dioxide, urea, lactic acid) [129]. Regarding viscosity, the intravenous blood cannot be considered a perfect Newtonian liquid due to blood cells, but the plasma. Viscoelasticity is a property of human blood that is primarily due to the elastic energy that is stored in the deformation of red blood cells as the heart pumps the blood through the body. The energy transferred to the blood by the pressure-driven flow is partially stored in the elastic structure, another part is dissipated by viscosity, and the remaining energy is stored in the kinetic motion of the blood.
In Poiseuille flow, blood cells and plasma do not travel at the same average veloc- ity. This results in differences in microchannels and discharge hematocrits. Although Eq. 2.4 is only valid for Newtonian fluids, fitting experimental data to this equation (Q = ∆P πr8µ tube4
eL ) provides a convenient method of characterizing flow resistance by the effective viscosity (µe), which depends on the fluid being tested, the capillary diameter, and the flow rate (or pressure drop) [140]. At high shear rates blood cells occupy the central axis of microfluidic channels leaving the cell-free zone of plasma periphery. A decrease in hematocrit tends to increase shear stress due to the decreased effective vis- cosity (µe). The normal value of hematocrit is 40−45 % for men, meanwhile 35−40 % for women, which is approximately three times more than that of water. The F˚ahræus- Lindquist effect [130] describes the relation between the effective viscosity (µe) and the radius of capillary tubes (rtube). According to experimental observation of F˚ahræus et al. the relative viscosity of blood decreases inversely to the diameter of channels due to the erythrocytes move over the center of the channel, leaving plasma at the wall of the microchannels and the hematocrit in the channel was always less than the hematocrit in the original sample. The ratio of these two hematocrits, the tube relative hematocrit (HR):
HR= hematocritchannel
hematocritsample, (2.17) wherehematocritchannelis defined as the ratio of blood cells volume within the channel to the total volume of the sample.
In the following chapters and discussions we consider a Newtonian approximation of blood flow under the assumption that most of our microfluidic channels are at the sim- ilar hydraulic range, and the flow velocities also are considered within a small variation of a certain range. This simplification is especially necessary when conducting nu- merical calculations where the implementation of non-newtonian fluid dynamics could render the already complex models insolvable.
Chapter 3
Flow Through Nematodes Filter
3.1 Filtration of Nematodes Using an Integrated Micro- capillary System
3.1.1 Motivation, description of the problem to be solved
The filarial nematodes are a group of arthropod-borne worms that reside in the subcutaneous tissues, deep connective tissues, lymphatic system, or body cavities of humans. Some adult filarial worms can survive in the human host for many years, causing a number of chronic and debilitating symptoms, including inflammatory reac- tions [141]. The female worms produce large numbers of larvae called microfilariae, which are highly motile, threadlike prelarvae that in some species maintain the egg membrane as a sheath; these are called sheathed forms, while those that rupture the egg membrane are called unsheathed forms. Once released by the female worm, mi- crofilariae can be detected in the peripheral blood or cutaneous tissues, depending on the species. The microfilariae, which may survive for 1 to 2 years, are not infective for other vertebrate hosts, nor do they undergo any further development in the vertebrate host [141]. The infections are transmitted to humans by the bites of obligate blood- sucking arthropods that had become infected through ingesting larvae (microfilariae) contained in a blood meal obtained from a mammalian host. The most speared filarial species in which the human is the definitive host is summed in Tab. 3.1.
Disease-specific immunodiagnostic and molecular testing markets increase world- wide. The genusDirofilaria, which includes etiologic agents such asDirofilaria immitis
Species Distribution Vector Location Wuchereria
bancrofti
Tropics and subtropics worldwide; mainly India, China, Indonesia, Eastern Pacific
Mosquito Lymphatic
Brugia malayi Southeast Asia, Indone- sia, India, Indonesia, Southeast Asia
Mosquito Lymphatic
Brugia timori Islands of Timor and Lesser Sunda in Indonesia
Mosquito Lymphatic
Loa loa Africa Deerfly Subcutaneous
Mansonella perstans
South and Central America, Africa
Biting midge Body cavities, mesentery, perirenal Mansonella
ozzardi
South and Central America, Caribbean
Biting midge, blackfly
Subcutaneous, body cavities Mansonella
streptocerca
West and Central Africa Biting midge Subcutaneous Onchocerca
volvulus
South and Central America, Africa
Blackfly Subcutaneous Dirofilaria
immitis
Japan, Australia, United States, Europe
Mosquito Pulmonary
nodules Dirofilaria
repens
United States, Africa, Asia, Europe, and South America
Mosquito Subcutaneous
Table 3.1: Listing of human filariasis by Gracia et al. [141]
andDirofilaria repens, is responsible for the increased occurrence of zoonotic dirofilar- iosis in vertebrates worldwide. Human infections by these parasites may also occur, and 1782 cases have been reported in over 37 countries in Europe, North America, Southeast Asia, and Africa [142–144], 372 of which were pulmonary and 1410 of which were subcutaneous/ocular cases over the last decade [145]. Increased -travel, pesticide -restrictions, and the introduction of the Asian tiger mosquito, which take a blood -meal that is twice as large as the common mosquito species, have contributed to the spread of cardiopulmonary and subcutaneous dirofilariosis in final host carnivores [146].
The life cycle of species of Dirofilaria genus consists of larval stages (L1-L3) in arthropod intermediate host as vector (mosquito), developing stages (L3-L5) and adult stage in natural host (Fig. 3.1). The development period of the microfilariae mostly depends on the temperature inside the species of intermediate host (from 10 to 21 days at around 25◦C). In infective stage, the larvae (L3) migrate to the Malpighian tubule lumen of the mosquito, while during subsequent nutrition of the intermediate host the larvae enter to subcutaneous connective tissue of definitive host. In this stage (L3), the infective larvae of these filarioidea invade a variety of human or animal tissues and elicit little or no discernible response from the host during the course of their development unless they enter exquisitely sensitive tissues such as the conjunctivae. The D. immitisandD. repens, which are responsible in human, persist for months without a detectable host response. In their natural hosts, filarioids are typically long-lived, living often several years or more [147]. D. immitis infective larvae (L3s), commonly called
”heartworm”, cause a chronic infection in the right heart/inferior vena cava, and the pulmonary vein where uncontrolled parasite development may result in serious disease for the natural host but in humans do not survive their migration in subcutaneous tissue [148]. D. repens causes chronic infection where parasite development is limited within the eye, subcutaneous tissues, abdominal cavities, and urinary bladder. Species of Dirofilaria affect mostly dogs and other carnivores such as cats, wolves, and foxes.
Humans may become infected as aberrant hosts, the worms fail to reach adult stage while residing in a human body.
The late stage (L4-L5) differential diagnosis of human pulmonary dirofilariosis costs
$80,000 or more per patient in the USA [160]. In addition, in the case ofD. immitis, it exposes the patient to unnecessary surgery which carries a risk of mortality. Therefore, the early-stage (L3) diagnostic techniques reduce risk of complications and also save health care costs. Large scale screening for dirofilariosis involves the use of the serolog- ically based antigen or antibody lateral flow devices which are commercially available for this purpose: VetScan Canine Heartworm Rapid Test Kit (Abaxis, Union City, CA, USA), Heartworm IC (Argolabo S.p.A., Scarmagno, TO, Italy), Solo Step CH Canine Heartworm Antigen Test (Heska, Loveland, CO, USA), FASTest HW Antigen (Megacor Diagnostik GmbH, Hoerbranz, Austria), CH9705/FX Immunochromatographic device (Multimage S.r.l., Cavaria, VA, Italy), Woodley InSight Heartworm Rapid Diagnostic
Figure 3.1: The life cycle ofDirofilaria immitiswhich consists of three stages (L1-L3) in arthropod (mosquito) intermediate vector and other two stages (L4 and L5) in vertebrate host. During the blood meal, an infected mosquito introduces L3 filarioid larvae of D.
immitis into the skin of the definitive host. The L3 nematodes invade the tissues of natural host undergoing themselves two more molts into adults. Adult heartworms reside in pulmonary arteries and are occasionally found in the right ventricle of the heart. Adult females are usually 250−310 mm long by 1mm wide; males are usually 120−200 mm long by 0.7−0.9 mm wide. Adults can live for 5 − 10 years. In the heart, the female worms are capable of producing microfilariae over their lifespan, which are 290−330µm long and 5−7 µmwide [149]. The microfilariae are found in peripheral blood, which can be ingested by another mosquito during its blood meal.
Test (Woodley Equipment Company Ltd, Horwich, UK), and Canine Heartworm Anti- gen Test (SA Scientific, San Antonio, TX, USA). These antigen or antibody lateral flow devices require at least three adult female heartworms and do not exist for detec- tion of D. repens. The antigen presence of dirofilariosis does not occur in each case thus in diagnostics several seroepidemiological methods have been developed to explore the existence of intravenous nematodes or to determine its volumetric population from blood samples. The gold standard in diagnosis depends upon microscopical detection of microfilariae in blood but classical microbiological test is also used. This is very difficult in dirofilariosis where the parasitemia is frequently below 100 nematodes per
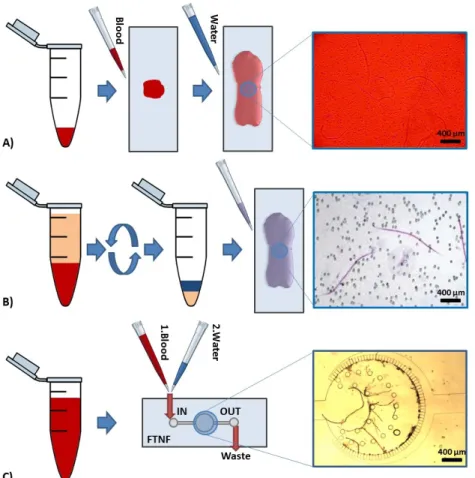
Figure 3.2: Comparison of detection and diagnostic methods and protocols for dirofilar- iosis including the proposed simple use FTNF device. A) Blood smear test. Starts with pipetting a drop of serological sample on a glass slide, then hemolyzing with deionized wa- ter and finally counting the number of nematodes within the all volume of sample. B) The modified Knott0s test. Anticoagulant blood sample is dissolved 2% formalin in a conical centrifuge tube. After the 5 minutes centrifugation at 1500rpm, the sediment is mixed by one drop of methylene blue stain coloring the cuticle of nematodes. Finally, the number of nematodes is counted optically. C) Flow-through nematode filter (FTNF). Concentrates the nematodes in the center of the device before the hemolysis from a few ml of blood offering an instantaneous readout.
milliliter of blood. Given the low abundance of parasites in the blood, methods have been developed to raise the efficiency of detection rising the cost and the required time of diagnosis. The following enumeration, which is also summarized in Table 3.2, repre- sents a scale of executive complexity in inverse proportion of currently used diagnostic methods [146]: serologic methods (fresh blood smear and histochemical stain based
Method Limit of detection Volume requirement
Duration References Serologic methods
(fresh blood smear, histochemical stain based tests)
1-2 nematodes 0.5-1 ml 10-30 min
[146, 150]
Concentration methods (Knott’s test, hematocrit method, filter test)
1-2 nematodes 2-3 ml 20-40 min
[151, 152]
Enzyme-linked immunosorbent assays (ELISAs)
22-43 kDa
antigens
200-400µl 2-4 h [153–156]
PCR amplification 2-3 DNS 10-100 µl 3-5 h [142, 157–159]
Table 3.2: Laboratory diagnostics of blood-borne parasitic diseases
tests), concentration methods (Knott’s test, hematocrit method, filter test), enzyme- linked immunosorbent assays (ELISAs), multiplex real-time PCR amplification. When dirofilariosis is diagnosed, the erratic progression of many infections and the lack of microfilariae in most cases necessitate the use of combined diagnostic techniques. The evaluation of serological methods and the concentration procedures are based on opti- cal detection while the enzyme-linked immunosorbent assays (ELISAs) and RT-PCR amplification requires further costs (instruments, higher skilled labor). Each diagnostic technique is multiplexable and combinable with other methods. The most widespread technique is the smear test, which is shown in Fig. 3.2.A and starts with pipetting serological sample onto a glass slide after the hemolysis, the nematodes are counted.
The modified Knott’s test, which concentrates nematodes by centrifugation and mark specific species by Giemsa stain and shown in Fig. 3.2.B. First, the anticoagulant blood sample is dissolved 2% formalin in a conical centrifuge tube. After the 5 minutes cen- trifugation at 1500 rpm, the sediment is mixed by one drop of methylene blue stain coloring the cuticle of nematodes to distinguish better the different nematode spices.
Finally, the number of nematodes is counted as is the previous method. The advantage of the concentration method versus the basic serologic methods is the raised detection limit from a bigger sample volume.
I have designed a microfluidic device, called flow-through nematode filter (FTNF), which is shown in Fig. 3.2.C. This device uses an integrated filtering technique pro- viding the ability to detect much smaller concentration of nematodes from specimens, determine them more accurately and specifically without any external devices reducing the price of the measurement retaining an similar efficiency. The developed diagnostic device integrates a special, microfluidic filter to concentrate circulating parasites from serological sample.
The overall mechanism and the novelty of the device is shown and highlighted in Fig. 3.2 and in Fig. 3.3. The designed microfluidic device contains a particle separation technique which is easy to implement in cheap disposable plastic chips, that we believe is well suited for the task of removing parasites from a fewml of blood in order to aid the instantaneous filtration. The mechanism of separation by FTNF is based on the interaction of nematodes suspended in whole blood with an ordered array of micro- capillaries and micropillars that the fluid is forced to flow through under low Reynolds number conditions, while the detectable larvae are trapped.
The required filtration range of the designed device for nematode filtration comes from parasitology. These nematodes are ovoviviparous and the evolving unsheathed embryo (microfilariae) live in the bloodstream. The length ofD. immitisis 330−380µm and their width is 5−7µm[149]. The microfilariae ofD. repens is bigger, 300−360µm long and 6−8µmwide [149]. In this matter the developed structure has to be robust, efficient to filter out the desired nematodes and to reduce the risk of coagulation.
Figure 3.3: The overall mechanism of the flow through nematode filter (FTNF) device.
Parasite-infected serological sample is forced through the capillary system from the inlet on the left (IN) through to the outlet on the right (OUT), meanwhile the most of the parasites remain trapped within the pillar and capillary filter system.
Here, a continuous hydrophoretic filtration technique of nematodes which does not require auxiliary liquid control, can be fabricated using a monolithic polydimethylsilox- ane (PDMS)-glass technique, has been presented to construct 12 parallel microfluidic systems varying microcapillary width from 6.1µmup to 15.4µm. The flow-through ne- matode filter (FTNF), which represented in Fig. 3.3 is based on a common microfluidics- based particle filtration technique, easy to implement in cheap disposable plastic chips, that we believe is well suited for the task of removing parasites from blood in order to aid filtration. The fabrication of constructed devices are based on soft-lithography techniques using monolithic polydimethylsiloxane (PDMS).
3.2 Device Principles
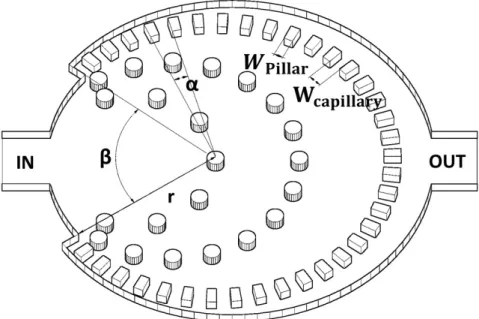
Figure 3.4 demonstrates the geometry of the microfluidic filter for this mentioned veterinarian purpose. Each microfluidic structure has a 400µm wide and 20 µmhigh inlet and an outlet. 12 capillary structures have been implemented, which are uniform within the central region of one device but the widths of microcapillaries (Wcapillary) varies from 6.1µmup to 15.4 µm. The active zone, where parasites remain trapped is surrounded by these rectangular cross-section microcapillaries, which are on a radius (r) of 1 mm from the center and its repetition angle (α) is from 3.38◦ up to 3.91◦. The width of obstacles/pillars (Wpillar = 52.8 µm) and the angle without capillary connection (β = 75◦) are the same in each structure.
Figure 3.4: Schematic of the flow-through nematode filter. Theαangle is the structural repetition of the microcapillaries, r is the radius of the active zone, Wpillar is the width of the pillars, Wcapillary is the width of the capillary channel and β is the angle without capillary connection. The proposed inlet and outlet channels are marked with IN and OUT, respectively. The capillaries are positioned in a circular manner to increase filtration efficiency by providing an isobaric pressure distribution along the entire filter system.
The following trigonometrical equation proximates the relationship between α and
the capillary width (Wcapillary):
sinα
2 = Wpillar+Wcapillary
2r (3.1)
Those rigid particles which have greater diameter than Wcapillary, will be filtered out from the liquid flow. The total cross section of microcapillaries is described by the following equation:
Scapillaries= 360◦−βh
α (2rsinα
2 −Wpillar) (3.2)
where h is the height of the channel and 360◦ −β is that angle where the capillaries connect to the active zone.
Generally, the microfluidic filters are described by the pressure drops (∆P) at dif- ferent flow velocities and the total flow resistance (Rtot).
∆P =RtotQ (3.3)
The pressure drop is the function of the flow rate (Q) and the total flow resistance Rtot which is defined as:
1 Rtot
=
n
X
i=1
1 Ri
= 1 R1
+ 1 R2
+...+ 1 Rn
(3.4) where n is the number of capillaries within one device (n= (360◦−β)/α). Ri is the flow resistance of one capillary channel
Ri = 8µL
πrH4 (3.5)
whereµis the dynamic viscosity,Lis the length of the microcapillary and the nominal hydrodynamic diameter (rH) is
rH = hWcapillary h+Wcapillary
(3.6) Integrating Eq. 3.4, Eq. 3.5 and Eq. 3.6 into Eq. 3.3 we get the pressure drop of cylindric-shape a capillary structure
∆P = 8µLQα(h+Wcapillary)4
π(360◦β)h4Wcapillary4 (3.7)
3.3 Computational Fluid Dynamic Simulations
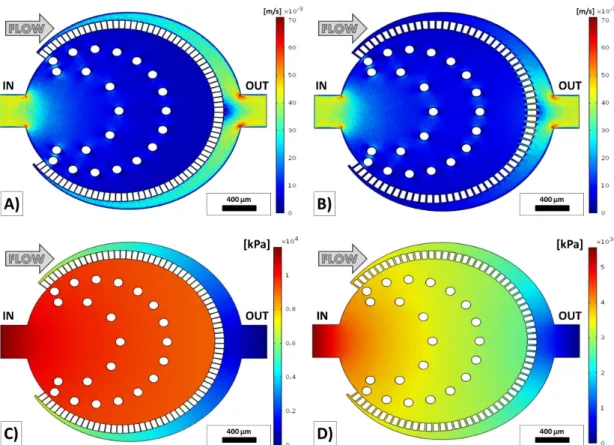
The main aim of the computational fluid dynamics simulation was to design an iso- baric zone in the middle of the device by predicting the flow behavior of the microfluidic device. Due to this reason, the verification of the simulation by pressure measurements were not in the scope of the thesis work. In this case, the efficiency of filtration could be increased by these results. The computational fluid dynamics simulations were calculated to predict the velocity and pressure profiles of the developed structure by COMSOL Multiphysics 4.3 (COMSOL Inc., Burlington, MA, USA). The pressure drop has a significant meaning from the point of flow through filtering. Twelve similar mi- crofluidic devices were designed by increasing capillary width (Wcapillary) from 6.1µm up to 15.4 µm and the flow velocity and pressure profile was calculated at 0.25 ml/h, 0.5ml/h, and 1 ml/hflow rates with the initial and boundary condition and shown in Fig. 3.5.
As it was discussed in Chapter 2, in narrow microfluidic channels the blood could be considered as Newtonian fluid thus the eq. 2.2 could be applied to determine the flow profile. The initial parameters were set to the appropriate blood properties thus the viscosity was around 3.53·10−3 P as, the density was 1060 kg/m3 in the all do- mains of the microfluidic device. The side walls had non slipping condition, the outlet had zero-pressure and the inlet laminar inflow condition at 0.25 ml/h, 0.5 ml/h, and 1 ml/h volumetric flow rates. To investigate the efficiency of filtration the pressure drop has an important effect. If the pressure drop is significant the trapped elastic par- ticles, which are larger than the capillary width (Wcapillary) can be squeezed through the microcapillary structure while using an abnormal pressure the filter can be also destroyed [161].
For each geometry the flow velocity and pressure profiles have been calculated and the maximum pressure differences within the devices are shown in Fig. 3.6. The pressure field has a maximum value on the sidewall of inlet and the smallest value appears on the sidewall of outlet. Within one device the pressure drop rises as a laminar way in the function of flow rate and is reduced by the capillary width at the same boundary and initial conditions. The equidistant microcapillaries from the geometric center develop
Figure 3.5: Numerical simulation results of flow velocity and pressure profiles at 1ml/h inflow rate. A) Flow velocity profile of the thinnest (Wcapillary = 6.1 µm) capillary struc- ture at 1ml/h. B) Flow velocity profile of the thickest (Wcapillary = 15.4 µm) capillary structure at 1ml/h. C) Pressure profile of the thinnest capillary structure at 1ml/h. D) Pressure profile of the thickest capillary structure at 1ml/h.
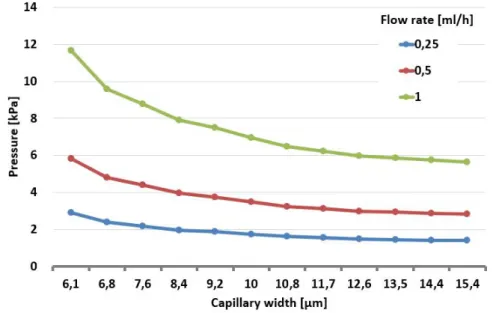
a quasi-homogeneous pressure field within the active zone, which is the central field of the microfluidic device, where the nematodes remain trapped, aiding the filtration of the larvae but blood cells. Based on computational flow dynamics simulations the approximation of the pressure drop can be described with the following equation with R2 = 0.9939. Decreasing the capillary width (Wcapillary) increases the flow resistance quasi exponentially and in the same time the pressure drop at a fixed flow rate which is represented in Fig. 3.6.
The microfluidic filters could be clogged during a long measurement, thus it could be useful to predict the incense of the pressure in the case of clogging. Figure 3.8 shows the clogging caused pressure drop in the thinnest (Wcapillary = 6.1µm) FTNF
Figure 3.6: Pressure drop within each device calculated by computational fluid dynamics simulations at 0.25ml/h, 0.5ml/h, and 1ml/hflow rates.
Figure 3.7: Flow resistivity within each device calculated by computational fluid dynam- ics simulations.
at 0.5 ml/h. The clogging effect could be significant if more than 60 percent of the channels are blocked.
Figure 3.8: Clogging analysis of the thinnest (Wcapillary = 6.1µm) FTNF device using computational fluid dynamics simulations at 0.5 ml/h flow rate. Closing the microcapil- laries 1 by 1, the pressure drop rises.
3.4 Device Design and Fabrication
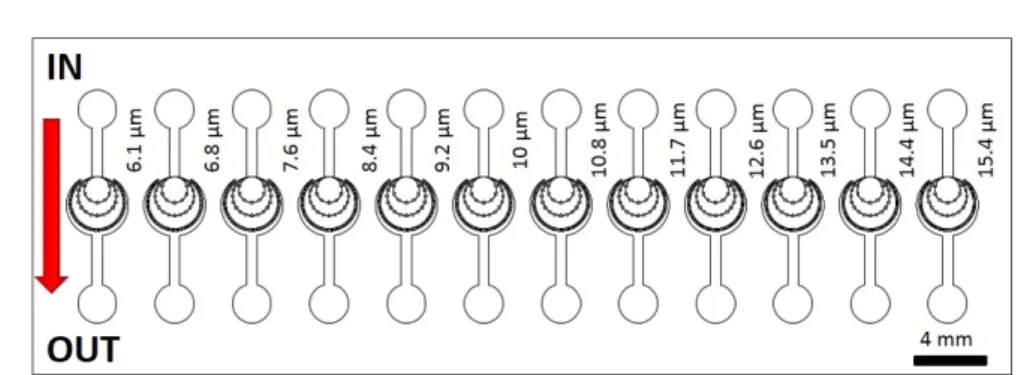
Figure 3.9: Overview of the microfluidic device, which integrate 12 different Flow Through Nematode Filters. The capillary width is between 6.1 µmand 15.4µm.
Channel layouts were designed by using AutoCAD 2013 (Autodesk Inc., San Rafael, CA, USA), which are shown in Fig. 3.9 and devices were fabricated in polydimethyl- siloxane polymer (PDMS, Sylgard 184, Dow Corning, USA) using a standard microfab- rication soft-lithographic technique [161]. The microfabrication procedure starts with making a master for replica molding. SU-8 (MicroChem, Newton, MA, USA) photore- sist was spin coated onto 4” silicon wafer to a thickness of 20 µm (Fig. 3.10.A) and patterned using UV light in contact mask aligner through a chrome mask (Fig. 3.10.B).
Figure 3.10: Fabrication steps of the microfluidic devices. A) SU-8 photoresist was spin coated onto silicon wafer. B) The shape of the microfluidic channels were patterned by UV light in contact mask aligner through a chrome mask. C) The unpolarized photoresist was washed away from the surface. D) The liquid PDMS pre-polymer conformed to the shape of the master. E) The patterned PDMS slab was bonded to microscope glass slide following surface treatment. F) The final device.
PDMS monomer and curing agent were mixed to a ratio of 10 : 1 (v/v), degassed and poured over the master and set aside at 70◦C for 2 h for polymerization. The liquid PDMS pre-polymer conforms to the shape of the master and replicates the features of the master (Fig.3.10.D). After the polymerization the solid PDMS replica was pulled off from the mold surface and access holes were punched through the patterned PDMS slab using a 1 mm hollow pin vise. The patterned PDMS slab was bonded to microscope glass slide following surface treatment by Plasma-preen II 863 (Plasmatic Systems Inc.
North Brunswick, NJ, USA) (Fig. 3.10.E). Finally, teflon tubes were inserted into the access holes for fluidic contacts.
3.5 Experimental Setup
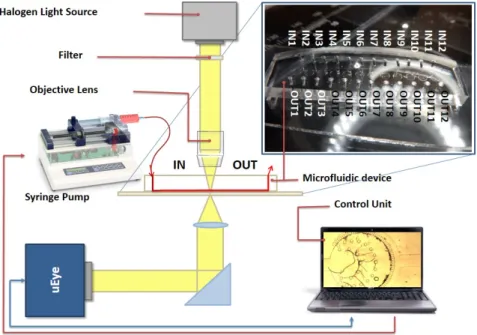
Figure 3.11 illustrates the schematic diagram of our nematode filtration platform.
Pressure-driven flow was created using syringe pumps (NE-4000, New Era Pumping System Inc, Farmingdale, NY, USA) attached to the inlet via Teflon tubes. Typical flow rates were used between 0.1 ml/h and 2 ml/h, controlled by the syringe pump.
Imaging was performed on an inverted Olympus IX71 microscope (Olympus, Tokyo, Japan). Image recording was through a USB color CCD camera (uEye UI-222x series, IDS Imaging Development Systems GmbH, Obersulm, Germany). All videos were cap- tured at a speed of 50 frames/second and captured videos were analyzed using Matlab (The MathWorks Inc., Novi, MI, USA). For parasitological experiments, blood-borne infected, anticoagulant, canine blood has been used, where D. repens parasites were
determined previously by Knott’s method obtaining their concentration in serological samples.
Figure 3.11: Schematic image of the parasite filtration platform. The microfluidic devices are mounted on an inverted microscope. The syringe pump system with the CCD camera unit are controlled from a single platform.
3.6 Experimental Results
The single layer microfluidic design allows the easy loading, immediate filtration and analysis of nematodes, eliminating the need of other sample preparation instru- ments such as centrifuge or other devices. Before each experiment, these microfluidic structures were optically checked, purified and dried eliminating unnecessary particles (dust), which can cause clogging. The developed structures were tested at 0.25 ml/h, 0.5 ml/h, and 1 ml/h volumetric flow rates by 15 different blood-borne infected, an- ticoagulant, canine blood samples. The type and the severity of dirofilariosis was determined and classified into three commonly used classes (-, +, ++).
Figure 3.12 shows the procedure of nematode filtration, which contains the follow- ing steps. First, the serological sample is forced through the microfluidic device at a constant volumetric flow rate during which most of the nematodes remain trapped in
Figure 3.12: Procedure of nematode filtration. A) serological sample is forced through the microfluidic device B) the medium is changed to air then deionized water C) haemolysis and increment of visibility D) counting the nematodes optically
the isobaric central region (Fig. 3.12.A). Changing the medium to air and subsequently to deionized water, air bubble is pushed thought the capillary structure (Fig. 3.12.B).
Since deionized water induces hemolysis by osmotic shock the attached and aggregated cells as thrombocytes and lymphocytes are lysed and flushed away from the detection area, while nematodes are resistant to osmotic shock due to their cuticulae this lysis increases the visibility and the contrast (Fig. 3.12.C). Finally, the trapped nematodes are counted optically in the central region (Fig. 3.12.D). Our experiments indicates that the number of trapped nematodes correlates with the applied volumetric flow rate and the microcapillary width.
Blood-borne infected, anticoagulant blood samples were pushed through the mi- crofluidic devices and the major population of nematodes were captured in the quasi- isobaric central region (Fig. 3.4). The population of the nematodes in the original
![Table 2.2: The size, percentage and the concentration of the main blood cells [128]](https://thumb-eu.123doks.com/thumbv2/9dokorg/1306438.105091/13.892.246.721.781.1052/table-size-percentage-concentration-main-blood-cells.webp)