Multi dimensional analysis of sensor communication processes ∗
Mohamed Amine Korteby, Zoltán Gál, Péter Polgár
University of Debrecen, Faculty of Informatics korteby.amine@inf.unideb.hu
gal.zoltan@inf.unideb.hu polgarp@mailbox.unideb.hu
Submitted: December 10, 2020 Accepted: March 8, 2021 Published online: May 18, 2021
Abstract
The Internet of Things requires communication mechanism to be optimal not only from the data transfer but from the energy consumption point of view, too. One of the most analyzed types of the sensor network is Low Energy Adaptive Clustering Hierarchy (LEACH) system depending on the population density, algorithm of cluster head election, heterogeneity of the energy and physical position of the nodes, velocity of the sink node, data aggregation rate and size of the data frame. Complexity of the system has been analyzed based on status data series of 360 simulation cases. New family of wireless sensor network (WSN) system is proposed with name CB-LEACH, having better characteristics than the classical LEACH system. The service ability of sensor network and dependency properties was done with analytic technique based on Singular Value Decomposition (SVD). Using this method there were identified most important modes serving as basis to regenerate responses of the studied sensor systems. It was found that the number of significant modes is just six. The novelty of the paper is a proof of concept that SVD is a useful multidimensional tool which can be used for describing the behavior of the newly proposed CB-LEACH family of sensor network mechanisms.
∗This work was supported by the construction EFOP-3.6.3-VEKOP-16-2017-00002. The project was supported by the European Union, co-financed by the European Social Fund. This paper was supported also by the FIKP-20428-3/2018/ FEKUTSTRAT project of the University of Debrecen, Hungary and by the QoS-HPC-IoT Laboratory.
53(2021) pp. 169–182
doi: https://doi.org/10.33039/ami.2021.03.005 url: https://ami.uni-eszterhazy.hu
169
Keywords:Wireless sensor networks, Low Energy Adaptive Clustering Hier- archy (LEACH), switching, cluster, classification analysis
AMS Subject Classification:62H30, 68M10, 90B15, 62H25, 62H30
1. Introduction
Nodes in wireless sensor networks monitor an Area of Interest (AoI) and, depending on their function, data is transmitted directly or indirectly to a Base Station (BS) or Sink Node (SN) that is connected to a wired network for further processing.
This forwarding process is accomplished through various routing mechanisms that are the focus of the related research. Because sensor devices have limited power resources, the efficiency of their energy consumption is crucial. At the same time, these sensors are heavily concentrated in physical areas that are difficult to access physically by human, so their power supply is virtually non-replaceable. Thus, the key to their operating time is the efficiency of their energy consumption.
Routing protocols play a key role in sending aggregated data, inducing careful handling of such tasks. A successful model of a WSN system is one that can strike a good compromise between the maximum amount of data collection and the minimum amount of energy consumption. In WSN routing mechanisms, clustering appears to be an important consideration as it provides efficient energy savings and data delivery at the network level. Hierarchical routing which includes clustering is proving to be a preferred method of arranging sensors [8, 16]. At the same time, the method increases scalability, reduces the amount of energy loss, and delay time, while providing good connectivity and load balancing with increased network life [1, 7].
LEACH is a hierarchical, cluster-based, energy-efficient routing mechanism. It extends the lifetime of the system with randomly selected Cluster Head (CH) ele- ments that forward frames from cluster members to the SN after aggregation. This intermediate transmission step significantly reduces the energy used by the nodes that operate the radio channel, since the transmission consumption of the data frame is based on the power function of the distance with exponent 2𝑏. Here𝑏 is the path loss exponent, its value depends on the path propagation properties and most often 𝑏≥2.
The further structure of the paper is as follows: in the second chapter we discuss the architecture and energy effects of the classical LEACH mechanism. In the third chapter we introduce our newly developed system Cost Balanced LEACH (CB- LEACH) and we present the methods used for the analysis of multidimensional data sets. Chapter four examines the newly proposed WSN system based on a synthetic state data series generated using 360 different simulations. In the last chapter we summarize the results and formulate the directions for the possible continuation of the research work.
2. Architecture and functions of the LEACH mech- anism
Routing protocols were divided into four schemes: Network Structure Scheme, Topology Based Scheme, Communication System Scheme, and Reliable Routing Schema. Besides, the network structure scheme can be broken down into two classes: Flat routing and Hierarchical routing, depending on the role of the sensor nodes. In Flat routing, the sensor nodes have similar roles and functionalities in the network. Used in small area networks, the principal issue of this type of routing is scalability. Flooding and Gossiping, Directed diffusion, Rumor, SPIN are the most popular Flat routing protocols.
Hierarchical routing delivers greater energy efficiency and reliability within its architecture, the entire network is partitioned into clusters and unique nodes called cluster heads (CH) based on certain criteria. CH manages the gathering and ag- gregation of data received from its neighborhood, then forwards the collected data to the Base Station (BS) while providing other services to other nodes which con- sumes more energy. Hence is required cluster rotation method, a common approach often used to manage the energy harvesting inside the cluster.
LEACH is a Time Division Multiple Access (TDMA) based Media Access Con- trol (MAC) routing protocol, self-adaptive and self-organized and most widely known hierarchical routing protocol. Due to its capability to increase energy ef- ficiency it improves the lifespan of sensor nodes by using randomized rotations of local cluster head functions between the nodes [11, 12, 14, 18].
LEACH protocol consists of several rounds with two phases in each round:
Set-up Phase and Steady Phase (see Figure 1).
Figure 1. Mechanism for sending frames by epoch period.
In Set-up phase CH advertisement, cluster set-up, and TDMA scheduling are performed. During the CH advertisement, each node participates in CH election process based on the following equation:
𝑇(𝑛) =
{︃ 𝑝
1−𝑝·mod(𝑟,1/𝑝), if𝑛∈𝐺,
0, otherwise, (2.1)
where𝑇(𝑛)is the threshold,𝑛is the node index taking values in continuous inter- val[0,1]and set {1,2, . . . , 𝑁}, respectively. Parameter𝑝denotes the CH election
probability or the percentage of a node to become CH and is constant for a given simulation scenario. Functionmod(𝑟,1/𝑝)is the remainder after dividing the cur- rent index 𝑟 by the number 1/𝑝 and 𝐺 is the set of sensor nodes that did not become CH in previous1/𝑝rounds. 𝑁 𝑜𝑑𝑒𝑛 acquires a cluster head function in the 𝑟𝑡ℎ epoch period if it drew𝑞𝑛< 𝑇(𝑛). 𝑞𝑛 is a random number𝑞𝑛∈0,1drawn by 𝑁 𝑜𝑑𝑒𝑛 in the actual epoch. If 𝑁 𝑜𝑑𝑒𝑛 was CH in any of the last 1/𝑝epochs, then 𝑇(𝑛) = 0, so any𝑞𝑛>0 =𝑇(𝑛), which means that it cannot regain a cluster head function in the actual epoch. With this rule and the random choice in the process, each node in the WSN is equal likely to become CH while achieving a homogeneous energy distribution among the CHs. The cluster head notifies all nodes in the sys- tem of its state with a control-type frame sent in a broadcast manner. Each of the nodes without CH function independently selects the most advantageous CH based on the field signal strength from the cluster head sources.
We refer round𝑟 to be an epoch. A node with index 𝑛 becomes CH for the current round if the generated random value 𝑞𝑛 of a sensor node is strictly less than the threshold 𝑇(𝑛). For a given round we have a fixed threshold and it is compared to the sensor node random values. If it is equal to 0, it means that𝑛does not belong to𝐺but belongs to the complementary set of nodes that were already elected as CH or died. Once a node is elected CH it cannot participate in the next 1/𝑝round of CH election: i.e. if 𝑝∈ {0.05,0.10} then the elected CH cannot be reelected in the next1/𝑝∈ {20,10}rounds respectively. This criterion is useful for the energy load balance inside the network since every node gets a better chance to become CH.
Based on this rule any of the nodes can become CH with similar probability, pro- viding uniformity on AoI space the extra energy consumption of the CH function.
The CHs announce the other nodes with radio channel broadcast about its new CH function. The ordinary nodes receive these signals and based on the intensity of the signal decide which cluster to become a member with. The signal intensity in practice depends on different environmental parameters but for the classical ver- sion of the LEACH, just the distance between the node and the CH is considered.
The ordinary nodes send their responses to the most advantageous CH, becoming in this way members of that cluster. The CH schedules the communication inside of the cluster for the members during the actual epoch time.
In the epoch time second phase is named Seady Phase. During this period sensor end nodes send their data to the selected CH. The CH aggreagates own frames with the transit traffic and send the aggregated data to the Sink Node.
Thus, in the case of a WSN consisting of N sensor nodes, these two phases occur alternately in successive periods.
During the LEACH simulation, the strength of electromagnetic field is assumed to be exclusively distance-dependent, so the radio energy attenuation𝐴(𝑑)per bit transmission is as follows:
𝐴(𝑑) =𝐸𝑅𝑥(𝑑)/𝐸𝑇 𝑥(𝑑),
𝐴(𝑑) =
⎧⎪
⎨
⎪⎩
1, if𝑑∈[0, 𝛿),
(𝛿/𝑑)2, if𝑑∈[𝛿, 𝑑0), (𝛿/𝑑0)2·(𝑑0/𝑑)2𝑏, if𝑑∈[𝑑0,∞),
(2.2)
where𝑑is the distance between the sender and the receiver,𝐸𝑅𝑥and𝐸𝑇 𝑥 are the received and transmitted power,𝛿is the geometric parameter of the radio antenna (on the scale of centimeters),𝑑0is the propagation distance threshold,bis the path loss exponent, where𝑏≥2. The node with its data selects the most advantageous CH, i.e. the nearest CH. In the absence of data, the node goes to sleep mode for an epoch period to save energy [6, 10]. The CH provides a notification to the members of the cluster with a TDMA or Code Division Multiple Access (CDMA) control type frame, thus guaranteeing a collision-free frame transmission to the cluster head during the current epoch.
LEACH is the archetype for distributed routing protocols and one of the most efficient WSN mechanisms for power management. At the same time, we must not ignore some of its shortcomings [8]. The entry of any node into the CH function is independent of the residual energy of the given node, resulting in an uneven distribution in the physical location of the clusters in the covered area [1, 2, 14, 17]. This is exacerbated by the fact that the CH node may be even further away from the SN than members of its cluster, delivering data with poor efficiency [4, 5, 15]. Thus, some CH nodes drain their energy source sooner than other nodes, forming energy-free holes in physical space [3, 13]. Furthermore, the robustness of the network is reduced if the low-power node is given the CH function, because the frames of the cluster members arriving at the CH may be cancelled during the transmission to the SN due to the lack of power [9].
3. Cost Balanced LEACH mechanism: CB-LEACH
We propose a new family of LEACH mechanism named CB-LEACH having better performance than classical LEACH. With the change we proposed, we endowed the basic LEACH mechanism with additional skills and intelligence. This is a Cost Balanced (CB) version of LEACH, which decides the route for transmitting frames based on complex metric. In the case of CB-LEACH, we allow the SN to move along a given path, as well as more efficient selection of the optimal CH for the end nodes. Because nodes in the current epoch time may be closer to the moving SN than the selected CH, they should send their frames directly to the SN instead of indirectly through the selected CH. To this end, we also include the SN in the set of selectable CH nodes. The energy of SN is considered not decreasing over time and is the largest in the WSN system. We consider not only the distance of the possible CHs from the end nodes but also their energy level, as well. To do this, a given sensor node decides own CH to connect to, based on the following metric:
COST(𝑖, 𝑗, 𝛼) =𝛼· 𝐸0
𝐸𝐶𝐻𝑗
+ (1−𝛼)·
(︂𝐷(𝑖, 𝑗) 𝑑0
)︂2𝑏
, (3.1)
whereCOST(𝑖, 𝑗, 𝛼)is the metric ofNode𝑖and𝐶𝐻𝑗calculated with a balance factor 𝛼 ∈[0,1], 𝐷(𝑖, 𝑗) is the distance betweenNode𝑖 and 𝐶𝐻𝑗, 𝑑0 is the propagation distance threshold and 𝑏 is the path loss exponent, 𝐸0 is the initial energy for any normal type node (NN) and 𝐸𝐶𝐻𝑗 is the actual energy level for a given𝐶𝐻𝑗. Parameter 𝛼named balance factor is our newly introduced element of the model to connect energy and distance properties of the nodes. Since the denominator of the first term of equation (3.1) can be zero after a long time, the properties of the system are analysed up to the last operating node, so that each term of the formula remains a positive and finite quantity.
In current epoch time Node𝑖 chooses the 𝐶𝐻𝑗 for which the value of the COST(𝑖, 𝑗, 𝛼) metric is the smallest. It can be observed that if 𝛼 = 0, we get back the mobility-enhanced CH version of the LEACH mechanism, which is fur- ther identified as ENH-LEACH (Enhanced). If we do not change the position of the SN in time, we get back the Basic LECH mechanism, which is hereinafter referred to as BAS-LEACH.
However, if𝛼= 1, only the energy of the CH counts, which generates a com- petitive situation between the potential CHs and eachNode𝑖 will choose the same single CH, i.e. the SN with the maximum energy. In this case, each node sends its data directly to the SN, independent of the other potential CHs. This routing mechanism will be referred to as DS (Direct Sequence) hereinafter.
Our simulation measurements demonstrated that ENH-LEACH and DS are significantly different routing protocols. The two extreme values of the balancing factor 𝛼 have advantages and disadvantages from different aspects. When 𝛼 is in range (0,1) it has harmonization effect on the decisions of LEACH routing mechanism. Based on these, the proposed CB-LEACH is compatible with the family of protocols as follows:
CB-LEACH∼
⎧⎪
⎨
⎪⎩
ENH-LEACH, if𝛼= 0,
Modified LEACH Familly, if𝛼∈(0,1),
DS, if𝛼= 1.
(3.2)
The DS sends the frame from each node directly to the SN. This means long distances, which consumes a significant amount of energy. However, due to the random transmission mechanism, the planar distribution of the residual energy of the nodes is expected to be strongly dependent on the distance between end node and SN. ENH-LEACH divides the physical field of the WSN into two parts, since treating the SN as a cluster head provides the nodes in the vicinity of the SN with a radius𝑑0 a favorable power consumption for frame transmission time. The obvious question is what properties the modified LEACH family inherits from the two boundary cases as a function of the 𝛼parameter. Further questions can put about the dependence of the CB-LEACH system on other parameters.
The CB-LEACH mechanism depends on a significant number of parameters, in- ducing execution of 360 simulation cases. In each case, the communication activity of a given WSN was completed during epoch numbers in the scale of5·105. Vec- torisation of the analyzed system responses is based on normalization of elemental
answer vectors and concatenation of them in common vector named probe. There is a legitimate need to identify the parameters that most significantly influence the behavior of the present network. For this, we applied Singular Value Decompo- sition (SVD) analytic method [2], to efficiently evaluate behavior dependence on the tuplet of independent parameters. Having relatively high number of simulation probes, SVD gives possibility to determine the number of most significant modes of the CB-LEACH system behavior.
4. CB-LEACH system analysis and characteristics
We analyzed and evaluated the synthetic state data obtained from𝑛′= 360probes of Direct Sequence (DS), Basic LEACH (BAS-LEACH), and Enhanced LEACH (ENH-LEACH) simulations according to different parameters, using the methods described in this chapter. These mechanisms can be considered as special cases of CB-LEACH family proposed by us.
Figure 2 shows Area of Interest after ending the simulation of one probe exam- ple. Area of Interest is the biggest doted black circle. Red doted arc represents𝑑0
(see formula (2.2)), radio channel distance threshold. There are 𝑁 sensor nodes represented by black circles. Normal nodes (NN) and Advanced nodes (AN) are distinguished by the radius of black circles. Smallest circles belong to NNs and ANs have greater radius. For each simulation probe a number of 𝑁 sensor nodes are spread in uniformly distributed coordinates inside of AoI. Gray scale of the node marker is proportional with the age of node. Darker nodes die first, brighter nodes die later.
Figure 2. Example of one simulation probe after the execution of simulation. Parameter names conform to Table 1.
Depending on the constant velocity value, the sink node may move on trajectory in horizontal segment between filled red (left) and non filled (right) circles during the actual simulation. Number of forward and backward courses depend on the velocity and running time and are counted in variables Fw and Bw, respectively.
Being the sensor nodes uniformly distributed in space, the weighted energy point (WEP) in space of the WSN is situated in the center of the AoI. This WEP moves during the simulation if the remaining energy of the nodes is not uniformly de- creasing in space. In this example red segment in the center zone of AoI represent movement of WEP during the simulation. FND, HND, TQD and LNA are epoch identifiers for first node die, half node die, third quarter node die and last node alive, respectively. Population density in the AoI is constant, 𝜌= 0.2𝑚−2 during all simulations, meaning one node per5𝑚2.
The unchanged characteristics of the WSN system and the values of the six parameters of the simulation environment are shown in Table 1. In the table specific parameters have more than one value, others just one. Parameters with variable values are marked with star (*) character at the beginning of the line.
Hereby we have 𝑛′ = 5·3 ·3·2·2 ·2 = 360 combinations of the orthogonal parameters giving us𝑛′ simulation probes.
Table 1. Parameters of the simulated system. Parameters having variable values are marked with star (*) character at the beginning of the row. Other parameters have fixed value during the simulation
probes.
Parameters Value(s)
Physical area size(𝑥𝑚×𝑦𝑚) 100𝑚×100𝑚
Radius of the field 𝑅=𝑥𝑚/2
Initial and farthest position of the Sink Node (−𝑥𝑚,0)(𝑥𝑚,0)
Number of nodes of the WSN 𝑁= 157
* Balance Factor 𝛼= 0,0.25,0.50,0.75,1.00
* Ratio AN node number / total nodes, N 𝑚= 0.3,0.5,0.7
* Velocity of the Sink Node 𝑣= 0,5,10m/s
* Radio frames length 𝐹 𝑠= 1000,4000bits
* Aggregation level of the radio frames 𝑔= 0.10,0.89
* Ratio of the CH nodes 𝑝= 5,10%
Energy factor of the AN 𝑎= 1
Initial energy unit 𝐸0= 2.5J
Energy consumption of the electronics 𝐸𝑒𝑙𝑒𝑐= 50nJ/bit Energy multipath factor vs. of antenna height 𝐸𝑚𝑝= 1.3pJ Energy consumption of the antenna amplifier 𝐸𝑎𝑚𝑝= 0.1 nJ/bit Energy consumption of the frame aggregation 𝐸𝐷𝐴= 5nJ/bit
Radio antenna height ℎ= 1.5m
Radio channel distance threshold 𝑑0= 87.7 m
Energy Free Space Factor 𝐸𝑓 𝑠= 10pJ/bit/𝑚2
Path loss exponent 𝑏= 4
The CB-LEACH balancing factor𝛼influences the cluster head selection strat- egy and the type of WSN routing based on equations (3.1) and (3.2). The cluster
head average probability, 𝑝plays a role in relation (2.1). Typically, the operation of the system is usually tested with relatively small values. To show the effect of heterogeneous initial energy levels, the set of𝑁 sensor nodes are classified into two energy groups: NN (Normal Node) and AN (Advanced Node). AN initially has 𝑎+ 1>1 times greater energy than NN. The Ratio of the AN nodes number to the total nodes 𝑁 is𝑚∈(0,1). The initial energies of these two groups, and the entire WSN system, are as follows:
𝐸𝑁 = (1−𝑚)·𝑁·𝐸0, 𝐸𝐴=𝑚·(𝑎+ 1)·𝑁·𝐸0,
𝐸𝑇 =𝐸𝑁+𝐸𝐴= (𝑎·𝑚+ 1)·𝑁·𝐸0.
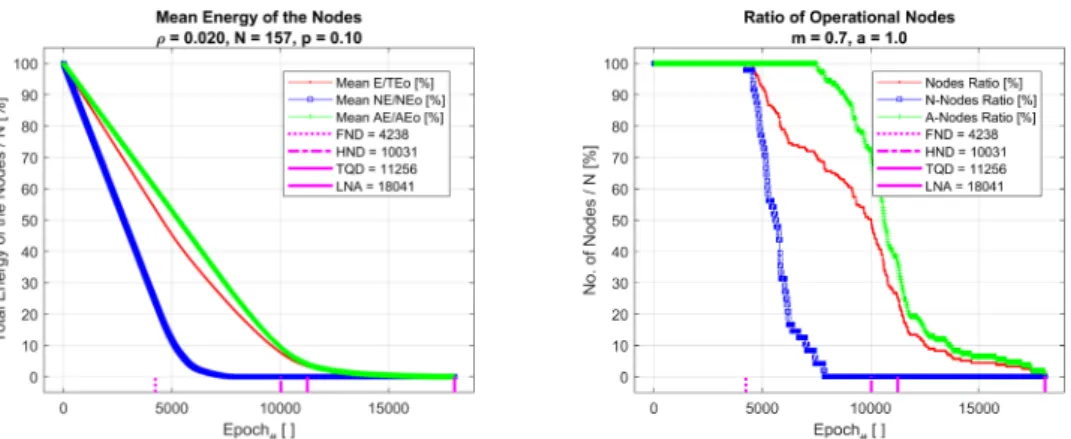
Examples of status responses time series of WSN system for Basic LEACH can be seen on Figure 3. On the left hand side figure NN and AN node types have the spatial average energy level versus time represented with blue and green curves, respectively. Average energy curve for the whole WSN is shown by red curve. On the right hand side figure same colors are used to represent alive nodes versus the time.
Figure 3. Examples of two elemental time series responses of Basic LEACH𝑝𝑟𝑜𝑏𝑒𝑖: Remaining average energy level in space,𝐸𝑖𝐵
(left) and Relative number of operational nodes,𝑁𝑖𝐵 (right). Initial parameters are: 𝛼= 0;𝑚= 0.7;𝑣= 0m/s;𝐹 𝑠= 4000bit;𝑔= 0.1;
𝑝= 0.1.
The response data series provided by the WSN system per routing mechanism are given by the following vector concatenations:
𝑦𝐷𝑖 = (𝐸𝑖𝐷, 𝑆𝑖𝐷, 𝐹𝑖𝐷, 𝑁𝑖𝐷)∈𝑀1,8𝑒0, (4.1) 𝑦𝑖𝐵= (𝐸𝑖𝐵, 𝑆𝑖𝐵, 𝐹𝑖𝐵, 𝑁𝑖𝐵, 𝑇𝑖𝐵, 𝐾𝑖𝐵, 𝐷𝐵𝑖 , 𝑅𝐵𝑖 )∈𝑀1,8𝑒0, (4.2) 𝑦𝑖𝐸= (𝐸𝑖𝐸, 𝑆𝑖𝐸, 𝐹𝑖𝐸, 𝑁𝑖𝐸, 𝑇𝑖𝐸, 𝐾𝑖𝐸, 𝐷𝐸𝑖 , 𝑅𝐸𝑖 )∈𝑀1,8𝑒0, (4.3)
where𝑀1,8𝑒0 is the class of matrices with one row and8𝑒0columns. Upper indexes D, B and E stands for Direct Sequence, Basic LEACH and Enhanced LEACH mechanisms, respectively. Elemental responses of the WSN for simulation 𝑖 = 1, . . . , 𝑚′ are vectors with𝑒0 elements each: spatial average remaining energy level in % (𝐸𝑖), Shannon entropy in space of energy levels (𝑆𝑖), relative number of frames sent to the sink node in % (𝐹𝑖), relative number of operational nodes in % (𝑁𝑖), relative number of transactions/epoch in % (𝑇𝑖), relative number of clusters/epoch in % (𝐾𝑖), average distance in space between CH and sink node in % of 𝑑0 (𝐷𝑖), average cluster radius in % of𝑑0 (𝑅𝑖).
Since we executed simulation for each combination of independent parameter values, every probe gives us response as a set of data series of the WSN system for DS, BAS-LEACH and ENH-LEACH (see Figure 4). Because number of elements of the response time series belonging to different probe are not equal, it was used dilatation and compression of the time. The common length 𝑒0 = 27,953 of one elemental response vector is the average size of the elemental time series length of the 𝑚′ probes, determined from Basic and Enhanced LEACH cases. In this way response vectors in formulae (4.1), (4.2) and (4.3) are transformed and considered as status vectors versus progress in the range[0%,100%).
Figure 4. Structure of the WSN simulation system. For each parameter tuple the WSN system generates sensors in random po- sitions of the AoI and executes simulation for DS, BAS-LEACH and ENH-LEACH routing mechanisms separately. Scaled and normal- ized response status data series are concatenated in probe vectors.
Matrix𝑌 is the response matrix of WSN system having𝑛′ probes.
Each of the above three row-vectors𝑦𝑖𝐷,𝑦𝑖𝐵,𝑦𝑖𝐷contain8𝑒0 elements. Because in case of DS mechanism just𝐸𝐷,𝑆𝐷,𝐹𝐷,𝑁𝐷response data series have meaning, being half as many time series as BAS-LEACH or ENH-LEACH mechanisms have, each DS vector mentioned was scaled to double length,2𝑒0. Each elemental status data series of probe 𝑦𝑖, 𝑖= 1, 𝑛′ generated by simulation𝑖 of the WSN system is concatenated to create the probe vector identified by the following formula:
𝑦𝑖= (𝑦𝑖𝐷, 𝑦𝐵𝑖 , 𝑦𝑖𝐸)𝑇 ∈𝑀𝑚′,1,
where 𝑇 is the transpose operator. Collection of column vectors 𝑦𝑖, 𝑖 = 1, 𝑛′ represents status matrix of the WSN system given by the following formula:
𝑌 = (𝑦1, . . . , 𝑦𝑛′)∈𝑀𝑚′,𝑛′,
where𝑚′= (2·4 + 8 + 8)·𝑒0= 24·𝑒0= 670,872 and𝑛′= 360.
Should mention that since the structure of the 𝑦𝑖 column vector representing the simulation probe 𝑖 is fixed, it can be considered as a vectorized image map.
Each of the𝑛′ different probes is a composed object of twenty vectorized images.
Each object belonging to the corresponding probe has the same structure but different content from the others. Hereby we have better representation of the system responses and we search a smaller number of representative probes,𝑘that are able to best characterize the WSN system.
We used Singular Value Decomposition to determine the number of most im- portant modes able to form an orthogonal basis for all the𝑛′ probes. According to Figure 5 (left), the correlation coefficients between the responses𝑦𝑖and𝑦𝑗are in the interval(0.5,0.95), mostly closer to the larger values, where𝑖 < 𝑗,𝑖, 𝑗∈ {1, . . . , 𝑛′}. It is numerically confirmed by Figure 5 (right), that the𝑘= 6largest singular val- ues represents 33.55% of the information given by𝑛′ = 360 singular values. The elbow part of the singular values scree plot proves that there are 𝑘 = 6 virtual modes serving as synthesization basis for all𝑛′ = 360probes. It means that there are 6 different virtual parameter tensor values (𝛼, 𝑚, 𝑣, 𝐹 𝑠, 𝑔, 𝑝), which represent 6 virtual probes that primarily characterize our CB-LEACH WSN system. This is considered the main novelty of our findings about the proposed CB-LEACH family of routing mechanisms.
Figure 5. Correlation matrix of Y responses of WSN system (left) and singular values of the response matrix Y (right).
Decomposition of status matrix𝑌 is given by the following formula:
𝑌 =𝑈*Σ*𝑉𝑇,
where matrixes 𝑈 ∈ 𝑀𝑚′,𝑚′, Σ ∈ 𝑀𝑚′,𝑛′ and 𝑉 ∈ 𝑀𝑛′,𝑛′ are unitary basis in progress, singular value matrix and unitary basis matrix in AoI space, respectively.
The simplified response matrix𝑌ˆ is the approximation of the matrix𝑌 and contains in each column 20 elementary data series having the noise reduced significantly:
𝑌ˆ =𝑈𝑘*Σ𝑘*𝑉𝑘𝑇,
where matrixes 𝑈𝑘 ∈ 𝑀𝑚′,𝑘, Σ𝑘 ∈ 𝑀𝑘,𝑘 and 𝑉𝑘 ∈ 𝑀𝑛′,𝑘 are most significant 𝑘 columns of matrixes𝑈,Σand 𝑉, respectively.
Figure 6 demonstrates similarity between the original (𝑌) and filtered response system (𝑌ˆ). Both parts of Figure 6 contain 7,200 data series versus progress. The response data series belonging to a given probe contains the values going from top to bottom along with the columns. The values of the normalized and scaled response data series are represented by color codes having values conform to the color bars. It can be observed that the two images are very similar in both aspect of layout and sharpness. The root mean square error (RMSE) of the two matrices is𝑅𝑀 𝑆𝐸= 9.15%.
Figure 6. Data series responses of a WSN system, original Y (left) and approximated𝑌^ (right). Progress direction is from top
to bottom, normalized values are represented by color codes.
The facts found so far prove the feedback neural networks to be useful in analysis of complex systems as they reduce the learning process required for modelling.
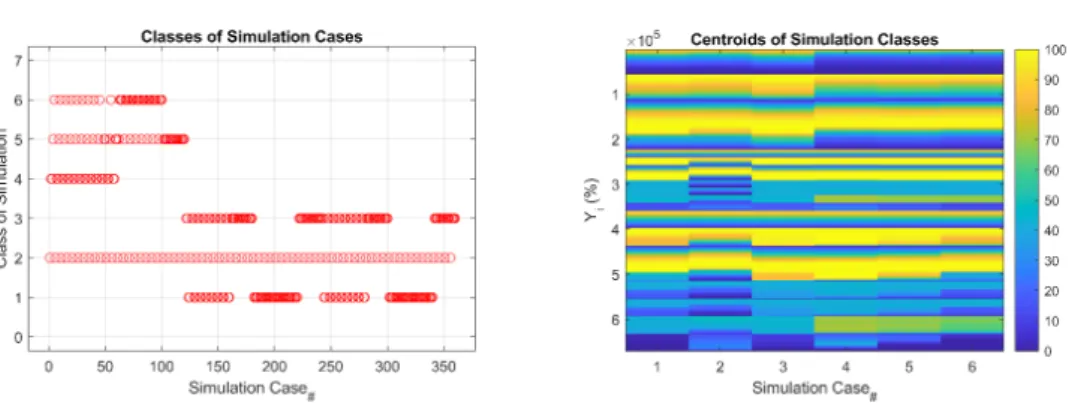
This aspect is not discussed in this paper because it is subject of our next research phase. Using the 𝑘-means clustering method, we classified the responses of the 𝑛′ simulations cases (probes) into𝑘 classes, i.e.𝑦𝑖, 𝑖= (1, 𝑛)column vectors into clusters. The result of this computation is illustrated in Figure 7. The number of probes belonging to groups1, . . . , 𝑘are 96, 72, 96, 24, 38 and 34, respectively (see Figure 7 left). Since the number of members is of the similar order of magnitude per class, each class is important. Figure 7 (right) represents centroid vectors of 𝑘= 6clusters conform to probes classification provided by the𝑘-Mean algorithm.
Centroid of a class is the mean vector in space for member vectors belonging to the same class. We should mention that significant difference exists between these centroid vectors.
Figure 7. Classification of simulations by 𝑘-Mean algorithm into 𝑘= 6clusters (left) and centroids of the probe classes (right).
This aspect proves detectable diversion between the probe classes resulted for simulations based on 𝑛′ tuple of independent parameters of the proposed CB- LEACH family of WSN mechanisms.
5. Summary and conclusions
The method presented in the paper allows the behaviour analysis of the newly pro- posed CB-LEACH wireless sensor routing mechanism. CB-LEACH is an energy- efficient extension of the classic LEACH, the operation of which can be influenced by six parameters. To determine the optimal parameter tensor, the analysis of the synthetic state data set was generated by 360 different simulation cases which required the use of dimension reduction analysis based on Singular Value De- composition to determine the number of most significant modes. This number is𝑘= 6, which is not a coincidence due to the number of independent parameters (𝛼, 𝑚, 𝑣, 𝐹 𝑠, 𝑔and𝑝), but generic property due to the special behaviour of the CB- LEACH family. To classify the 𝑛′ = 360 simulation cases into𝑘 classes, we used 𝑘-Mean clusterization algorithm enrolling to the closest cluster with good accuracy each simulation probe based on independent tuples of parameters.
As a continuation of the research work, further analyzes are considered im- portant on the noise reduction of response probes of elementary data series as a function of singular value number and reducing precessing capacity of the method.
Sensitivity analysis will be executed to find approximated closed-from expression of the energy usage dependence on the multidimensional parameter set.
References
[1] O. M. Alia:Dynamic relocation of mobile base station in wireless sensor networks using a cluster-based harmony search algorithm, Information Sciences (2017), pp. 76–95, doi:https://doi.org/10.1016/j.ins.2016.12.046.
[2] S. Baljinder,V. Amit,K. Manit:A survey on various energy-efficient routing protocols in WSN, International Journal of Advanced Research, Ideas and Innovations in Technology 4 (2019), pp. 862–865.
[3] M. Belwal:Energy Efficient LEACH and Improved LEACH: A Review, International Jour- nal of Advanced Research in Computer Science 10 (2019), pp. 51–52,
doi:https://doi.org/10.26483/ijarcs.v10i3.6412.
[4] Y. Chi,H. Chang:An energy-aware grid-based routing scheme for wireless sensor networks, Telecommunication Systems 54 (2013), pp. 405–415,
doi:https://doi.org/10.1007/s11235-013-9742-x.
[5] Z. Gal,M. Korteby:Energy Sparing of the Leach Communication Mechanism in Het- erogeneous WSN, in: 8th International Conference on Advanced Science and Information Technology, 2019, pp. 53–64.
[6] N. Ghosh,I. Banerjee:An energy-efficient path determination strategy for mobile data collectors in wireless sensor network, Computers & Electrical Engineering 48 (2015), pp. 417–
435,doi:https://doi.org/10.1016/j.compeleceng.2015.09.004.
[7] S. Harjit,S. Varun:Energy Efficient Clustering for Network Stability and Longevity for Heterogeneous Wireless Sensor Network, International Journal of Engineering Science and Computing 8 (2018), pp. 18867–18872.
[8] W. Heinzelman,A. Chandrakasan:An application-specific protocol architecture for wire- less micro sensor networks, IEEE Transactions on Wireless Communications 1 (4 2002), pp. 660–670,
doi:https://doi.org/10.1109/TWC.2002.804190.
[9] N. Ismat,R. Qureshi,I. Mumtaz:Efficient Clustering for Mobile Wireless Sensor Net- works, in: 17th IEEE International Multi Topic Conference, 2014, pp. 110–114,
doi:https://doi.org/10.1109/INMIC.2014.7097321.
[10] A. Khan,A. Abdullah,M. Razzaque,J. Bangash:Vgdra: A virtual gridbased dynamic routes adjustment scheme for mobile sink-based wireless sensor networks, IEEE Sensors Journal 15 (2015), pp. 526–534.
[11] J. Kim,J. In,K. Hur,J. Kim,D. Eom:An intelligent agent-based routing structure for mobile sinks in WSNs, IEEE Transactions on Consumer Electronics 4 (2010), pp. 2310–2316.
[12] W. Liang,J. Luo,X. Xu:Prolonging network lifetime via a controlled mobile sink in wire- less sensor networks, in: IEEE global telecommunications conference GLOBECOM, 2010, pp. 1–6.
[13] N. Mittal,U. Singh,B. Sohi:A stable energy efficient clustering protocol for wireless sensor networks, Wireless Networks 23 (2017), pp. 1809–1821.
[14] H. Salarian,K. Chin,F. Naghdy:An energy-efficient mobile-sink path selection strat- egy for wireless sensor networks, IEEE Transactions on Vehicular Technology 63 (2014), pp. 2407–2419.
[15] M. Thakur: Mobile Sink Based NLEACH Protocol by using Ant Colony Optimization, International Journal of Science Research and Technology 2 (2016), pp. 1–10.
[16] J. Wang,Y. Cao,B. Li,H. Kim,S. Lee:Particle swarm optimization based clustering algorithm with mobile sink for WSNs, Future Generation Computer Systems 76 (2016), pp. 452–457,
doi:https://doi.org/10.1016/j.future.2016.08.004.
[17] M. A. Zahhad,S. Ahmed, N. Sabor, S. Sasaki:Mobile sink-based adaptive immune energy-efficient clustering protocol for improving the lifetime and stability period of wireless sensor networks, IEEE Sensors Journal 15 (2015), pp. 4576–4586.
[18] Z. Zhou,C. Du,L. Shu,G. Hancke,J. Niu,J. Ning:An Energy-Balanced Heuristic for Mobile Sink Scheduling in Hybrid WSNs, IEEE Transactions on Industrial Informatics 12 (2016), pp. 28–40.