toxins
Article
E ff ects of Single and Repeated Oral Doses of Ochratoxin A on the Lipid Peroxidation and
Antioxidant Defense Systems in Mouse Kidneys
Szilamér Ferenczi1,*, Dániel Kuti1, Mátyás Cserháti2, Csilla Krifaton2, Sándor Szoboszlay2, József Kukolya3, Zsuzsanna Sz ˝oke4, Mihály Albert5, Balázs Kriszt2, Krisztina J. Kovács1, Miklós Mézes6,7 and Krisztián Balogh6,7
1 Institute of Experimental Medicine, Laboratory of Molecular Neuroendocrinology, 43. Szigony Street, Budapest 1083, Hungary; kuti.daniel@koki.mta.hu (D.K.); kovacs.krisztina@koki.mta.hu (K.J.K.)
2 Szent István University, Department of Environmental Protection & Safety, 1. Páter K. Street, Gödöll˝o 2100, Hungary; Cserhati.Matyas@mkk.szie.hu (M.C.); Krifaton.Csilla@mkk.szie.hu (C.K.);
szoboszlay.sandor@mkk.szie.hu (S.S.); Kriszt.Balazs@mkk.szie.hu (B.K.)
3 Central Environmental and Food Science Research Institute, Department of Microbiology, 15. Herman O. Street, Budapest 1022, Hungary; kukolya.jozsef@gmail.com
4 National Agricultural Research and Innovation Center, Agricultural Biotechnology Institute,
Reproduction Biology and Toxicology Research Group, 4. Szent-Györgyi A. Street, Gödöll˝o 2100, Hungary;
szoke.zsuzsanna@abc.naik.hu
5 CEVA Phylaxia Ltd, 5. Szállás Street, Budapest 1107, Hungary; mihaly.albert@ceva.com
6 Szent István University, Department of Nutrition, 1. Páter K. Street, Gödöll˝o 2100, Hungary;
Mezes.Miklos@mkk.szie.hu (M.M.); Balogh.Krisztian@mkk.szie.hu (K.B.)
7 “MTA-KE-SZIE Mycotoxins in the Food Chain” Research Group, Hungarian Academy of Science, Kaposvár University, 40. Guba Sándor Street, Kaposvár 7400, Hungary
* Correspondence: ferenczi@koki.hu
Received: 15 September 2020; Accepted: 20 November 2020; Published: 22 November 2020
Abstract:Ochratoxin-A (OTA) is a carcinogenic and nephrotoxic mycotoxin, which may cause health problems in humans and animals, and it is a contaminant in foods and feeds. The purpose of the present study is to evaluate the effect of oral OTA exposure on the antioxidant defense and lipid peroxidation in the kidney. In vivo administration of OTA in CD1, male mice (1 or 10 mg/kg body weight in a single oral dose for 24 h and repeated daily oral dose for 72 h or repeated daily oral dose of 0.5 mg/kg bodyweight for 21 days) resulted in a significant elevation of OTA levels in blood plasma. Some histopathological alterations, transcriptional changes in the glutathione system, and oxidative stress response-related genes were also found. In the renal cortex, the activity of the glutathione-system-related enzymes and certain metabolites of the lipid peroxidation (conjugated dienes, trienes, and thiobarbituric reactive substances) also changed.
Keywords: ochratoxin-A; glutathione; oxidative stress; kidney; gene expression
Key Contribution:Ochratoxin A initiated free radical formation and increased theNrf2mRNA in the kidney, depending on the dose and duration of exposure. However; the NRF2 Ser40-P protein level did not increase; therefore; antioxidant genes did not activate, which resulted in improper antioxidant defense and, consequently, cell damage.
1. Introduction
Mycotoxins are harmful or toxic to animals and humans. Ochratoxin-A (OTA) is a secondary metabolite of certainAspergillusandPenicilliumstrains [1]. OTA exposure caused nephropathy in
Toxins2020,12, 732; doi:10.3390/toxins12110732 www.mdpi.com/journal/toxins
Toxins2020,12, 732 2 of 25
porcine [2,3] and humans [4–7]. OTA-induced nephropathy is characterized by cell degeneration of renal proximal tubular and glomerular epithelial cells in the renal cortex area. It can also cause interstitial fibrosis, polyuria, and alterations in hematological and clinical biochemical parameters [8].
The chemical structure of OTA is similar to phenylalanine; thus, it impairs protein synthesis [9,10].
As a carcinogen, OTA has been demonstrated in renal adenocarcinoma and liver tumors [11,12].
OTA affects the expression of genes related to cell damage, apoptosis, cellular stress, and antioxidant defense [13]. OTA toxicity mechanism includes the formation of oxygen free radicals and lipid peroxidation [14]. There is evidence that antioxidants, such as vitamins E and C, decrease lipid peroxide formation, therefore, the oxidative stress-inducing effect of OTA [15]. However, renal tubular cell damage can be found without the induction of lipid peroxidation but a higher expression of genes encoding the antioxidant enzymes [16]. The molecular mechanisms that respond to oxidative stress are highly conserved in mammals. The transcription factor nuclear factor erythroid 2-related factor 2 (NRF2) is the master regulator of the oxidative stress response [17]. OTA-induced oxidative stress affects the antioxidant defense systems [18] and also modulates NRF2 expression and, therefore, activation of the antioxidant response element [19]. In response to elevated ROS levels, NRF2 induces the expression of certain antioxidant enzymes such as Heme Oxygenase (HO1), NAD(P)H quinine dehydrogenase (NQO1), and glutathione synthetase (GSS) [20].
These factors belong to the phase II detoxifying enzymes in xenobiotic transformation [21].
The activity of the NRF2 is regulated by redox balance in the cells. In physiological conditions, NRF2 is bound to Ketch-like ECH-associated protein 1 (KEAP1) as an oxidative stress sensor and promote ubiquitination and enzymatic degradation of NRF2 in proteasomes [22], keeping the low basal NRF2 activity. However, when oxidative stress increases, the KEAP1 cysteine side chains are oxidized. Consequently, the interaction between NRF2 and KEAP1 destabilizes, allowing the nuclear translocation of NRF2 to transcribe its specific target genes [23]. The principal element of the antioxidant system is the superoxide dismutase (SOD) enzyme family. SOD1 is the intracellular and nuclear form of SOD, accounting for 80% of total SOD protein [24]. SOD2 is localized in the mitochondria [24], and SOD3 is the secreted form that is associated with the extracellular matrix [25].
The SOD enzymes are scavenged reactive oxygen species, mainly superoxide anion generated in the cell by NADPH oxidase (NOX), xanthine oxidase, cytochrome P450, and mitochondrial respiration [26].
The SOD1 is a copper/zinc-dependent enzyme, and zinc supplementation could decrease OTA-induced oxidative damage in HepG2 cells [27]. The in vivo effect of acute and chronic OTA exposition on the kidney SOD enzymes is poorly understood. A recently identified component of the antioxidant defense is the HACE1-HECT E3 ligase. HACE1 is a tumor suppressor that ubiquitylates and proteasomal degradation of RAC1 protein (GTP-bound form of the Rho family GTPase). This event inhibits the de novo ROS generation by RAC1-dependent NADPH oxidases. It will thereby confer the cellular defense from oxidative DNA damage and hyper-proliferation [28]. Inactivation of RAC1 reduced NADPH oxidase I-dependent ROS production [29]. The roles of HACE1 and RAC1 in the OTA toxicities have not been investigated previously.
The effects of OTA on molecular redox mechanisms have been reported; however, the sequence of induction remains unsolved. Further, in vivo is essential to understand the toxic efficiency mode of action of OTA on the renal cortical area, which is the most OTA-affected tissue organ in animals and humans. The present study aimed to investigate the toxic effect of OTA-related oxidative stress and lipid peroxidation in the renal cortex in mice. The use of a rodent based in vivo toxicological study is the most suitable approach. The following markers were analyzed: alterations in the kidney and spleen weight, changes in the expression of OTA-affected genes, and activities of their products in the kidney [13]. In addition, lipid peroxidation parameters, activities of antioxidant enzymes, and immunochemical techniques (Western blot and ELISA) were also included in this study.
Toxins2020,12, 732 3 of 25
2. Results
2.1. Water and Food Consumption and Body Weight Change in Mice
Consumption of food and water did not change as an effect of the single oral dose (24 h), repeated daily oral dose (72 h), or repeated daily oral dose (21 days) OTA treatment. The bodyweight of the treated animals in repeated daily oral dose (72 h) and repeated daily oral dose (21 days) experiment also did not alter significantly (data not shown).
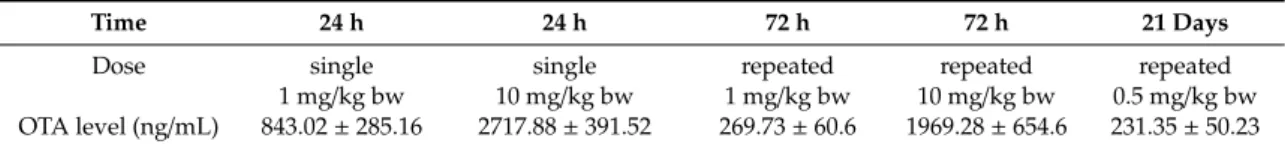
2.2. Blood Plasma OTA Content in a Single Oral Dose (24 h), Repeated Daily Oral Dose (72 h), and Repeated Daily Oral Dose (21 Days) Treatments
Low levels of OTA were found in the blood plasma of vehicle or methyl-methanesulfonate (MMS)-treated control animals. Single oral dose (24 h) mycotoxin administration significantly increased the OTA concentration in the blood plasma in 1 mg/kg bw and 10 mg/kg bw dose groups (Table1, Figure S1A in Supplementary Materials). Similarly, repeated daily oral dose (72 h) mycotoxin treatment with the dose levels of 1 or 10 mg/kg bw also significantly increased the OTA concentration in the blood plasma (Table1, Figure S1B in Supplementary Materials). In the case of the repeated daily oral dose (21 days; (0.5 mg/kg bw), OTA treatment resulted in a significantly higher OTA level in the blood plasma (Table1, Figure S1C in Supplementary Materials).
Table 1.Blood plasma ochratoxin-A (OTA) content in a single oral dose (24 h), repeated daily oral dose (72 h), and repeated daily oral dose (21 days) experiments.
Time 24 h 24 h 72 h 72 h 21 Days
Dose single single repeated repeated repeated
1 mg/kg bw 10 mg/kg bw 1 mg/kg bw 10 mg/kg bw 0.5 mg/kg bw OTA level (ng/mL) 843.02±285.16 2717.88±391.52 269.73±60.6 1969.28±654.6 231.35±50.23
2.3. Effect of OTA on the Weight of Spleen and Kidney
Spleen and kidney weight are both indicators of OTA toxicity, but their absolute weight depends on body weight; therefore, organ weights were normalized to the body weight of animals. The single oral OTA treatment (24 h) significantly elevated the normalized wet weight of the kidney in both OTA doses, but the normalized wet weights of the spleen were significantly higher only in the higher OTA-dose-treated group (10 mg/kg bw) (Figure S2A,B in Supplementary Materials). The repeated daily oral dose (72 h) OTA toxicity did not alter the normalized wet weight of the kidney, but the normalized wet weights of the spleen were significantly lower in both MMS and OTA-treated groups, as compared to the control (Figure S3A,B in Supplementary Materials). On the other hand, the repeated daily oral dose (21 days) OTA treatment with the daily dose of 0.5 mg/kg bw decreased the normalized wet weight of the kidney significantly only in the OTA-treated group, as compared to MMS and control groups (Figure S4A in Supplementary Materials). The normalized wet weight of the spleen did not differ significantly between the MMS- and OTA-treated groups (Figure S4B in Supplementary Materials).
2.4. Histopathological Analysis of the Renal Cortex
The single oral dose (24 h) OTA expositions did not induce degenerative changes at the histopathological level (data not shown). Repeated daily oral dose (72 h) OTA treatment (1 mg/kg bw or 10 mg/kg bw) showed degenerative lesions predominantly in the inner part of the cortex. Sporadic cell necrosis of the tubular epithelium and cell detachment to the lumen of the tubule were also found.
Multifocal necrosis in the tubular cells also occurred. Cell size reduction dispersed apoptotic bodies, and condensed chromatin in the nucleus was observed in the groups treated with high OTA dose and repeated daily oral doses (21 days). However, tubular cell regeneration has also been found in the repeated daily oral dose (21 days) OTA-treated group (Figure S5 in Supplementary Materials).
Toxins2020,12, 732 4 of 25
2.5. Changes of Some Parameters of the Glutathione Redox System and Lipid Peroxidation
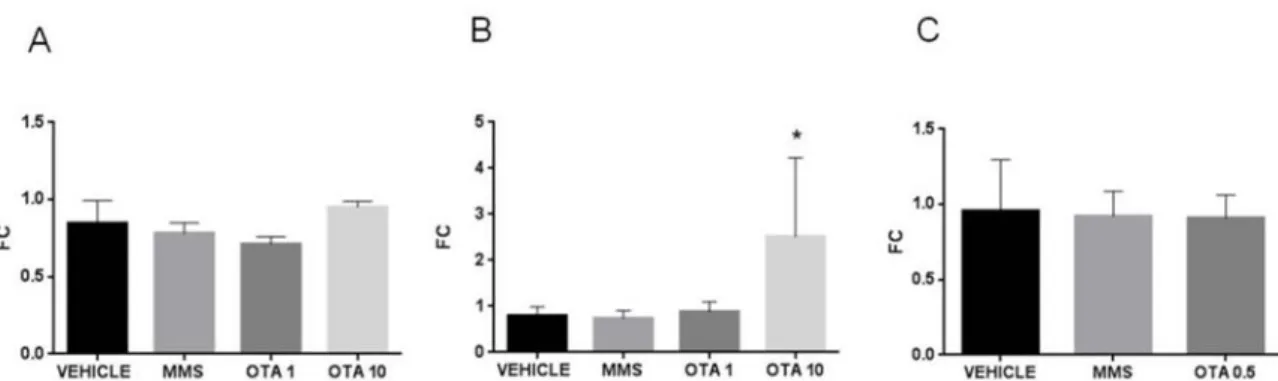
No differences in glutathione peroxidase (GPx) activity were found on day 1, while in the case of the highest dose of OTA (10 mg/kg bw), significantly (p<0.05) lower GPx activity was found at day 3 in the repeated daily oral dose (72 h) experiment (Figure1A,B). At the end of the repeated daily oral dose (21 days) OTA treatment, no significant changes were found in GPx activity of kidney samples (Figure1C).
Toxins 2020, 12, x FOR PEER REVIEW 4 of 25
2.5. Changes of Some Parameters of the Glutathione Redox System and Lipid Peroxidation
No differences in glutathione peroxidase (GPx) activity were found on day 1, while in the case of the highest dose of OTA (10 mg/kg bw), significantly (p < 0.05) lower GPx activity was found at day 3 in the repeated daily oral dose (72 h) experiment (Figure 1A,B). At the end of the repeated daily oral dose (21 days) OTA treatment, no significant changes were found in GPx activity of kidney samples (Figure 1C).
Figure 1. Effect of OTA expositions on GPx activity in the kidney cortex. (A) GPx activity of kidney samples in case of single oral dose (24 h) OTA treatment. The applied OTA doses did not change significantly the GPx activity. (B) GPx activity of kidney samples in case of repeated daily oral dose (72 h) OTA treatment. The highest applied OTA dose decreased significantly (p < 0.05) the GPx activity. (C) GPx activity of kidney samples in case of repeated daily oral dose (21 days) OTA treatment. The applied OTA dose did not change the GPx activity significantly. Abbreviations: MMS:
methyl-methanesulfonate-treated group; OTA 1 and OTA 10: treatment with 1 and 10 mg/kg bw ochratoxin A in the single oral dose (24 h) and repeated daily oral dose (72 h); OTA 0.5: 0.5 mg/kg bw ochratoxin A treatment in the repeated daily oral dose (21 days) experiment. Mean ± S.D. Data were analyzed by one-way ANOVA and Tukey's post hoc test.*p < 0.05 vs. vehicle.
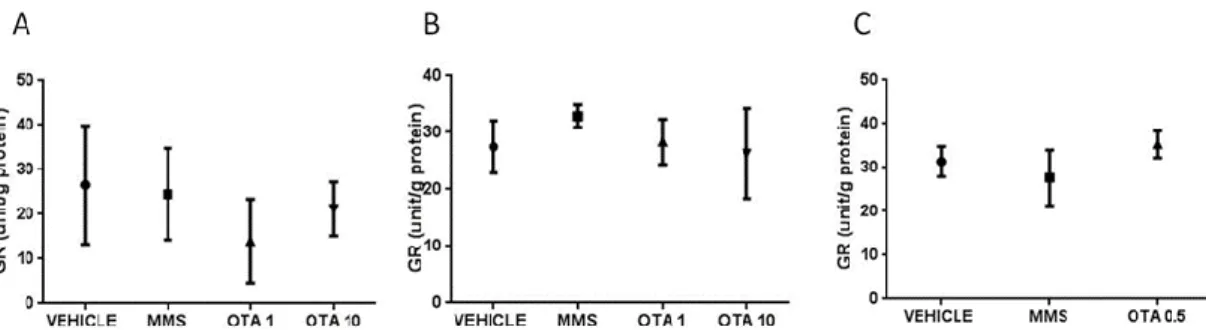
Glutathione reductase (GR) activity did not change in the case of a single oral dose (24 h) and repeated daily oral dose (72 h) treatments (Figure 2A,B). In the case of repeated daily oral dose (21 days) treatment, the GR activity also remained unchanged (Figure 2 C).
Figure 2. Effect of OTA expositions on the glutathione reductase (GR) activity in the kidney cortex.
(A) GR activity of kidney samples in case of single oral dose (24 h) OTA treatment. The applied OTA doses did not change significantly the GR activity. (B) GR activity of kidney samples in case of repeated daily oral dose (72 h) OTA treatment. The applied OTA doses did not change significantly the GR activity. (C) GR activity of kidney samples in case of repeated daily oral dose (21 days) OTA treatment. The applied OTA dose did not change the GR activity significantly. Abbreviations: MMS:
methyl-methanesulfonate-treatment group; OTA 1 and OTA 10: 1 and 10 mg/kg bw ochratoxin A treatment in the single oral dose (24 h) and repeated daily oral dose (72 h) groups; OTA 0.5: 0.5 mg/kg bw ochratoxin A treatment in the repeated daily oral dose (21 days) group. Mean ± S.D. Data were analyzed by one-way ANOVA and Tukey's post hoc test. *p < 0.05 vs. vehicle.
In the case of single oral dose (24 h) OTA treatment, neither the initial phase markers of lipid peroxidation (CD and CT) nor the meta-stable end products (thiobarbituric reactive substances, malondialdehyde (MDA)) showed significant changes (Figure 3A–C).
Figure 1.Effect of OTA expositions on GPx activity in the kidney cortex. (A) GPx activity of kidney samples in case of single oral dose (24 h) OTA treatment. The applied OTA doses did not change significantly the GPx activity. (B) GPx activity of kidney samples in case of repeated daily oral dose (72 h) OTA treatment. The highest applied OTA dose decreased significantly (p<0.05) the GPx activity. (C) GPx activity of kidney samples in case of repeated daily oral dose (21 days) OTA treatment. The applied OTA dose did not change the GPx activity significantly. Abbreviations: MMS:
methyl-methanesulfonate-treated group; OTA 1 and OTA 10: treatment with 1 and 10 mg/kg bw ochratoxin A in the single oral dose (24 h) and repeated daily oral dose (72 h); OTA 0.5: 0.5 mg/kg bw ochratoxin A treatment in the repeated daily oral dose (21 days) experiment. Mean±S.D. Data were analyzed by one-way ANOVA and Tukey’s post hoc test.*p<0.05 vs. vehicle.
Glutathione reductase (GR) activity did not change in the case of a single oral dose (24 h) and repeated daily oral dose (72 h) treatments (Figure 2A,B). In the case of repeated daily oral dose (21 days) treatment, the GR activity also remained unchanged (Figure2C).
Toxins 2020, 12, x FOR PEER REVIEW 4 of 25
2.5. Changes of Some Parameters of the Glutathione Redox System and Lipid Peroxidation
No differences in glutathione peroxidase (GPx) activity were found on day 1, while in the case of the highest dose of OTA (10 mg/kg bw), significantly (p < 0.05) lower GPx activity was found at day 3 in the repeated daily oral dose (72 h) experiment (Figure 1A,B). At the end of the repeated daily oral dose (21 days) OTA treatment, no significant changes were found in GPx activity of kidney samples (Figure 1C).
Figure 1. Effect of OTA expositions on GPx activity in the kidney cortex. (A) GPx activity of kidney samples in case of single oral dose (24 h) OTA treatment. The applied OTA doses did not change significantly the GPx activity. (B) GPx activity of kidney samples in case of repeated daily oral dose (72 h) OTA treatment. The highest applied OTA dose decreased significantly (p < 0.05) the GPx activity. (C) GPx activity of kidney samples in case of repeated daily oral dose (21 days) OTA treatment. The applied OTA dose did not change the GPx activity significantly. Abbreviations: MMS:
methyl-methanesulfonate-treated group; OTA 1 and OTA 10: treatment with 1 and 10 mg/kg bw ochratoxin A in the single oral dose (24 h) and repeated daily oral dose (72 h); OTA 0.5: 0.5 mg/kg bw ochratoxin A treatment in the repeated daily oral dose (21 days) experiment. Mean ± S.D. Data were analyzed by one-way ANOVA and Tukey's post hoc test.*p < 0.05 vs. vehicle.
Glutathione reductase (GR) activity did not change in the case of a single oral dose (24 h) and repeated daily oral dose (72 h) treatments (Figure 2A,B). In the case of repeated daily oral dose (21 days) treatment, the GR activity also remained unchanged (Figure 2 C).
Figure 2. Effect of OTA expositions on the glutathione reductase (GR) activity in the kidney cortex.
(A) GR activity of kidney samples in case of single oral dose (24 h) OTA treatment. The applied OTA doses did not change significantly the GR activity. (B) GR activity of kidney samples in case of repeated daily oral dose (72 h) OTA treatment. The applied OTA doses did not change significantly the GR activity. (C) GR activity of kidney samples in case of repeated daily oral dose (21 days) OTA treatment. The applied OTA dose did not change the GR activity significantly. Abbreviations: MMS:
methyl-methanesulfonate-treatment group; OTA 1 and OTA 10: 1 and 10 mg/kg bw ochratoxin A treatment in the single oral dose (24 h) and repeated daily oral dose (72 h) groups; OTA 0.5: 0.5 mg/kg bw ochratoxin A treatment in the repeated daily oral dose (21 days) group. Mean ± S.D. Data were analyzed by one-way ANOVA and Tukey's post hoc test. *p < 0.05 vs. vehicle.
In the case of single oral dose (24 h) OTA treatment, neither the initial phase markers of lipid peroxidation (CD and CT) nor the meta-stable end products (thiobarbituric reactive substances, malondialdehyde (MDA)) showed significant changes (Figure 3A–C).
Figure 2. Effect of OTA expositions on the glutathione reductase (GR) activity in the kidney cortex.
(A) GR activity of kidney samples in case of single oral dose (24 h) OTA treatment. The applied OTA doses did not change significantly the GR activity. (B) GR activity of kidney samples in case of repeated daily oral dose (72 h) OTA treatment. The applied OTA doses did not change significantly the GR activity. (C) GR activity of kidney samples in case of repeated daily oral dose (21 days) OTA treatment. The applied OTA dose did not change the GR activity significantly. Abbreviations:
MMS: methyl-methanesulfonate-treatment group; OTA 1 and OTA 10: 1 and 10 mg/kg bw ochratoxin A treatment in the single oral dose (24 h) and repeated daily oral dose (72 h) groups; OTA 0.5: 0.5 mg/kg bw ochratoxin A treatment in the repeated daily oral dose (21 days) group. Mean±S.D. Data were analyzed by one-way ANOVA and Tukey’s post hoc test.
Toxins2020,12, 732 5 of 25
In the case of single oral dose (24 h) OTA treatment, neither the initial phase markers of lipid peroxidation (CD and CT) nor the meta-stable end products (thiobarbituric reactive substances, malondialdehyde (MDA)) showed significant changes (FigureToxins 2020, 12, x FOR PEER REVIEW 3A–C). 5 of 25
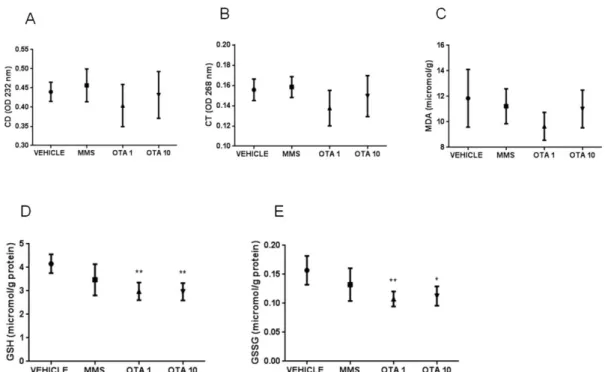
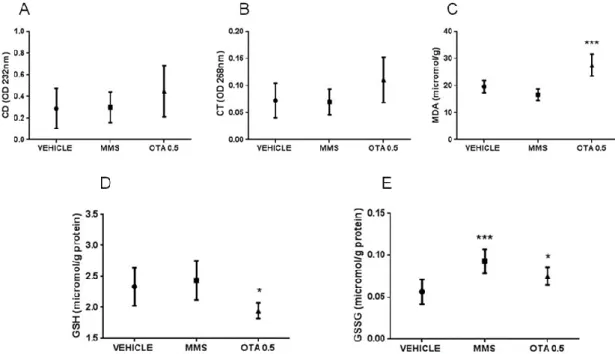
Figure 3. Effect of single oral dose (24 h) OTA exposure on lipid peroxidation parameters and reduced and oxidized glutathione concentration in the kidney cortex. (A) Levels of conjugated dienes (CD) in kidney samples in case of single oral dose (24 h) OTA treatment. The applied OTA doses did not cause significant alterations. (B) Levels of conjugated trienes (CT) in kidney samples in case of single oral dose (24 h) OTA treatment. The applied OTA doses did not cause significant alteration. (C) Malondialdehyde (MDA) concentration in kidney samples in case of single oral dose (24 h) OTA treatment. The applied OTA doses did not cause significant changes. (D) Reduced glutathione (GSH) concentration in kidney samples in case of single oral dose (24 h) OTA treatment. Both applied OTA doses decreased significantly (p < 0.01) the GSH concentration. (E) Oxidized glutathione (GSSG) concentration in kidney samples in case of single oral dose (24 h) OTA treatment. Both applied OTA doses decreased (p < 0.01 and p < 0.05, respectively) the GSSG concentration significantly.
Abbreviations: MMS: methyl-methanesulfonate-treatment. OTA 1 and OTA 10: 1 and 10 mg/kg bw ochratoxin A-treated groups. Mean ± S.D. Data were analyzed by one-way ANOVA and Tukey's post hoc test.*p < 0.05, **p < 0.01 vs. vehicle.
In case of repeated daily oral dose (72 h) treatment, markers of the early phase of lipid peroxidation increased as a result of high OTA intake (10 mg/kg bw), which was proven by the significant increase in the level of conjugated dienes (CD) at day 3 (p < 0.01, Figure 4A). However, the level of conjugated trienes (CT) did not show significant alterations during repeated daily oral dose (72 h) treatment (Figure 4B). On the contrary, lipid peroxidation did not reach the terminal phase in repeated daily oral dose (72 h) treatment, as the thiobarbituric reactive substances were measured by the meta-stable end products (MDA) of this process (Figure 4C).
Figure 3.Effect of single oral dose (24 h) OTA exposure on lipid peroxidation parameters and reduced and oxidized glutathione concentration in the kidney cortex. (A) Levels of conjugated dienes (CD) in kidney samples in case of single oral dose (24 h) OTA treatment. The applied OTA doses did not cause significant alterations. (B) Levels of conjugated trienes (CT) in kidney samples in case of single oral dose (24 h) OTA treatment. The applied OTA doses did not cause significant alteration. (C) Malondialdehyde (MDA) concentration in kidney samples in case of single oral dose (24 h) OTA treatment. The applied OTA doses did not cause significant changes. (D) Reduced glutathione (GSH) concentration in kidney samples in case of single oral dose (24 h) OTA treatment. Both applied OTA doses decreased significantly (p<0.01) the GSH concentration. (E) Oxidized glutathione (GSSG) concentration in kidney samples in case of single oral dose (24 h) OTA treatment. Both applied OTA doses decreased (p<0.01 andp<0.05, respectively) the GSSG concentration significantly. Abbreviations: MMS:
methyl-methanesulfonate-treatment. OTA 1 and OTA 10: 1 and 10 mg/kg bw ochratoxin A-treated groups. Mean±S.D. Data were analyzed by one-way ANOVA and Tukey’s post hoc test. *p<0.05,
**p<0.01 vs. vehicle.
In case of repeated daily oral dose (72 h) treatment, markers of the early phase of lipid peroxidation increased as a result of high OTA intake (10 mg/kg bw), which was proven by the significant increase in the level of conjugated dienes (CD) at day 3 (p<0.01, Figure4A). However, the level of conjugated trienes (CT) did not show significant alterations during repeated daily oral dose (72 h) treatment (Figure4B). On the contrary, lipid peroxidation did not reach the terminal phase in repeated daily oral dose (72 h) treatment, as the thiobarbituric reactive substances were measured by the meta-stable end products (MDA) of this process (Figure4C).
Toxins2020,12, 732 6 of 25
Toxins 2020, 12, x FOR PEER REVIEW 6 of 25
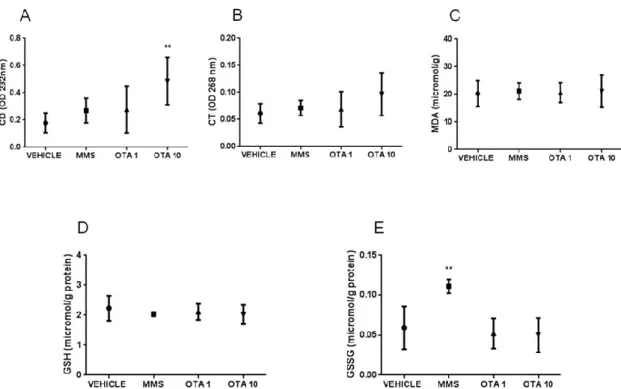
Figure 4. The effect of repeated daily oral dose (72 h) OTA exposition on some lipid peroxidation parameters and reduced and oxidized glutathione concentration in the kidney cortex. A: Levels of conjugated dienes (CD) in kidney samples in case of repeated daily oral dose (72 h) OTA treatment.
The highest OTA dose increased significantly (p < 0.01) the level of conjugated dienes in the kidney.
B: Levels of conjugated trienes (CT) in kidney samples in case of repeated daily oral dose (72 h) OTA treatment. The applied OTA doses did not cause significant alterations. C: Malondialdehyde (MDA) concentration in kidney samples in case of repeated daily oral dose (72 h) OTA treatment. The applied OTA doses did not cause significant changes. D: Reduced glutathione (GSH) concentration in kidney samples in case of repeated daily oral dose (72 h) OTA treatment. The applied OTA doses did not cause significant alterations. E: Oxidized glutathione (GSSG) concentration in kidney samples in case of repeated daily oral dose (72 h) OTA treatment. The applied OTA doses did not significantly alter, while the MMS treatment increased the GSSG concentration significantly (p < 0.01). Abbreviations:
MMS: methyl-methanesulfonate-treated group; OTA 1 and OTA 10: 1 and 10 mg/kg bw ochratoxin- A-treated groups. Mean ± S.D. Data were analyzed by one-way ANOVA and Tukey's post hoc test.**p
< 0.01 vs. vehicle.
At the end of the repeated daily oral dose (21 days) treatment, no significant changes were measured in the level of CDs and CTs (Figure 5A,B), but the concentration of thiobarbituric acid reactive substances (MDA) was significantly (p < 0.001, Figure 5C) higher in the kidney of OTA- treated animals than the controls.
Figure 4. The effect of repeated daily oral dose (72 h) OTA exposition on some lipid peroxidation parameters and reduced and oxidized glutathione concentration in the kidney cortex. A: Levels of conjugated dienes (CD) in kidney samples in case of repeated daily oral dose (72 h) OTA treatment.
The highest OTA dose increased significantly (p<0.01) the level of conjugated dienes in the kidney.
B: Levels of conjugated trienes (CT) in kidney samples in case of repeated daily oral dose (72 h) OTA treatment. The applied OTA doses did not cause significant alterations. C: Malondialdehyde (MDA) concentration in kidney samples in case of repeated daily oral dose (72 h) OTA treatment.
The applied OTA doses did not cause significant changes.D: Reduced glutathione (GSH) concentration in kidney samples in case of repeated daily oral dose (72 h) OTA treatment. The applied OTA doses did not cause significant alterations.E: Oxidized glutathione (GSSG) concentration in kidney samples in case of repeated daily oral dose (72 h) OTA treatment. The applied OTA doses did not significantly alter, while the MMS treatment increased the GSSG concentration significantly (p<0.01).
Abbreviations: MMS: methyl-methanesulfonate-treated group; OTA 1 and OTA 10: 1 and 10 mg/kg bw ochratoxin-A-treated groups. Mean±S.D. Data were analyzed by one-way ANOVA and Tukey’s post hoc test. **p<0.01 vs. vehicle.
At the end of the repeated daily oral dose (21 days) treatment, no significant changes were measured in the level of CDs and CTs (Figure5A,B), but the concentration of thiobarbituric acid reactive substances (MDA) was significantly (p<0.001, Figure5C) higher in the kidney of OTA-treated animals than the controls.
The non-enzymatic components of the glutathione redox system, GSH, and its oxidized form glutathione disulfide (GSSG) concentrations were significantly changed as the effect of both single oral dose (24 h) and repeated daily oral dose (21 days) exposures. GSH concentration in the kidney was lower at day 1 of single oral dose (24 h) OTA exposure in both (1 and 10 mg/kg bw) treated groups (Figure3D,p<0.01), while at day 3, no significant differences were found (Figure4D). Repeated daily oral dose (21 days) OTA exposure for 21 days resulted in significantly lower GSH concentration than control (Figure5D,p<0.05). GSSG concentrations in the kidney were also significantly lower on day 1 (Figure5E,p<0.01 andp<0.05), but not on day 3 of repeated daily oral dose (72 h) OTA exposure at both doses (Figure4E). On the contrary, it was significantly higher at the end of the repeated daily oral dose (21 days) OTA exposure (day 21) (Figure5E,p<0.05). However, on day 3 of the repeated daily oral dose (72 h) experiment, and also at the end (day 21) of the repeated daily oral dose (21 days) treatment,
Toxins2020,12, 732 7 of 25
the concentration of GSSG was significantly higher in the MMS group than control (Figures4E and5E, p<Toxins 2020, 12, x FOR PEER REVIEW 0.01 andp<0.001, respectively). 7 of 25
Figure 5. Effect of repeated daily oral dose (21 days) OTA exposition on lipid peroxidation parameters and reduced and oxidized glutathione concentration in the kidney cortex. A: Levels of conjugated dienes (CD) in kidney samples in case of repeated daily oral dose (21 days) OTA treatment. The applied OTA dose did not cause significant alteration. B: Levels of conjugated trienes (CT) in kidney samples in case of repeated daily oral dose (21 days) OTA treatment. The applied OTA dose did not cause significant alteration. C: Malondialdehyde (MDA) concentration in kidney samples in case of repeated daily oral dose (21 days) (21 days) OTA treatment. The applied OTA dose increased the MDA concentration in the kidney significantly (***p < 0.001). D: Reduced glutathione (GSH) concentration in kidney samples in case of repeated daily oral dose (21 days) OTA treatment. The applied OTA dose decreased significantly (*p < 0.05), the GSH concentration in the kidney. E:
Oxidized glutathione (GSSG) concentration in the case of kidney samples in repeated daily oral dose (21 days) OTA treatment. The MMS treatment and the applied OTA dose increased significantly (***p
< 0.001 and *p < 0.05, respectively) the GSSG concentration in the kidney. Abbreviations: MMS:
methyl-methanesulfonate-treated group; OTA 0.5: 0.5 mg/kg bw ochratoxin-A-treated group. Mean
± S.D. Data were analyzed by one-way ANOVA and Tukey's post hoc test.*p < 0.05, ***p < 0.001 vs.
vehicle.
The non-enzymatic components of the glutathione redox system, GSH, and its oxidized form glutathione disulfide (GSSG) concentrations were significantly changed as the effect of both single oral dose (24 h) and repeated daily oral dose (21 days) exposures. GSH concentration in the kidney was lower at day 1 of single oral dose (24 h) OTA exposure in both (1 and 10 mg/kg bw) treated groups (Figure 3D, p < 0.01), while at day 3, no significant differences were found (Figure 4D).
Repeated daily oral dose (21 days) OTA exposure for 21 days resulted in significantly lower GSH concentration than control (Figure 5D, p < 0.05). GSSG concentrations in the kidney were also significantly lower on day 1 (Figure 5E, p < 0.01 and p < 0.05), but not on day 3 of repeated daily oral dose (72 h) OTA exposure at both doses (Figure 4E). On the contrary, it was significantly higher at the end of the repeated daily oral dose (21 days) OTA exposure (day 21) (Figure 5E, p < 0.05).
However, on day 3 of the repeated daily oral dose (72 h) experiment, and also at the end (day 21) of the repeated daily oral dose (21 days) treatment, the concentration of GSSG was significantly higher in the MMS group than control (Figure 4E and Figure 5E, p < 0.01 and p < 0.001, respectively).
2.6. Gene Expression of Some Parameters of the Glutathione Redox System
Figure 5.Effect of repeated daily oral dose (21 days) OTA exposition on lipid peroxidation parameters and reduced and oxidized glutathione concentration in the kidney cortex. A:Levels of conjugated dienes (CD) in kidney samples in case of repeated daily oral dose (21 days) OTA treatment. The applied OTA dose did not cause significant alteration. B: Levels of conjugated trienes (CT) in kidney samples in case of repeated daily oral dose (21 days) OTA treatment. The applied OTA dose did not cause significant alteration. C: Malondialdehyde (MDA) concentration in kidney samples in case of repeated daily oral dose (21 days) (21 days) OTA treatment. The applied OTA dose increased the MDA concentration in the kidney significantly (***p<0.001).D: Reduced glutathione (GSH) concentration in kidney samples in case of repeated daily oral dose (21 days) OTA treatment.
The applied OTA dose decreased significantly (*p< 0.05), the GSH concentration in the kidney.
E: Oxidized glutathione (GSSG) concentration in the case of kidney samples in repeated daily oral dose (21 days) OTA treatment. The MMS treatment and the applied OTA dose increased significantly (***p< 0.001 and *p<0.05, respectively) the GSSG concentration in the kidney. Abbreviations:
MMS: methyl-methanesulfonate-treated group; OTA 0.5: 0.5 mg/kg bw ochratoxin-A-treated group.
Mean±S.D. Data were analyzed by one-way ANOVA and Tukey’s post hoc test. *p<0.05, ***p<0.001 vs. vehicle.
2.6. Gene Expression of Some Parameters of the Glutathione Redox System
In the case of the single oral dose (24 h) and repeated daily oral dose (72 h) treatments, the applied higher dose of OTA decreased the expression of glutathione S- transferase (Gsta) on day 1 and also at day 3 of the experiment significantly (Figure6A,B,p<0.01), and the lower dose of OTA resulted in significantly lower expression ofGstaat day 3 of the experiment (p<0.01) (Figure6B). In the case of the single oral dose (24 h) OTA treatment, theGstaexpression was significantly lower than control (Figure6Ap<0.01). However, repeated daily oral dose (21 days) OTA treatment did not cause significant alteration inGstaexpression (Figure6C). In the case of MMS treatment, at day 3 of the repeated daily oral dose (72 h) experiment, significantly (p<0.01) elevatedGstaexpression was found than in the control group (vehicle) (Figure6B).
Toxins2020,12, 732 8 of 25
Toxins 2020, 12, x FOR PEER REVIEW 8 of 25
In the case of the single oral dose (24 h) and repeated daily oral dose (72 h) treatments, the applied higher dose of OTA decreased the expression of glutathione S- transferase (Gsta) on day 1 and also at day 3 of the experiment significantly (Figure 6A,B, p < 0.01), and the lower dose of OTA resulted in significantly lower expression of Gsta at day 3 of the experiment (p < 0.01) (Figure 6B). In the case of the single oral dose (24 h) OTA treatment, the Gsta expression was significantly lower than control (Figure 6A p < 0.01). However, repeated daily oral dose (21 days) OTA treatment did not cause significant alteration in Gsta expression (Figure 6C). In the case of MMS treatment, at day 3 of the repeated daily oral dose (72 h) experiment, significantly (p < 0.01) elevated Gsta expression was found than in the control group (vehicle) (Figure 6B).
Figure 6. Effect of OTA expositions on the Gsta gene expression in the kidney cortex. A: Gsta gene expression alterations of the single oral dose (24 h) OTA-treated kidney samples. The highest OTA dose decreased the Gsta mRNA level (p < 0.01). B: Gsta gene expression alterations of the repeated daily oral dose (72 h) OTA-treated kidney samples. Both applied OTA doses decreased the Gsta mRNA levels (p < 0.01). C: Gsta gene expression alterations of the repeated daily oral dose (21 days) OTA-treated kidney samples. OTA treatment did not influence the Gsta mRNA level. Abbreviations:
MMS: methyl-methanesulfonate-treated group; OTA 1 and OTA 10: 1 and 10 mg/kg bw ochratoxin- A-treated groups in the single oral dose (24 h) and repeated daily oral dose (72 h) experiment; OTA 0.5: 0.5 mg/kg bw ochratoxin-A-treated group in the repeated daily oral dose (21 days) experiment.
Mean ± S.D. Data were analyzed by one-way ANOVA and Tukey's post hoc test.*p < 0.05, **p < 0.01,
***p < 0.001 vs. vehicle.
Glutathione peroxidase 1 (Gpx1) expression in case of single oral dose (24 h) treatment did not change at day 1, but at day 3, both applied doses caused significantly lower expression (p < 0.0001) than the control (vehicle) (Figure 7A,B), and at day 21 (p 0.01) of the repeated oral dose (Figure 7C).
As regards glutathione peroxidase 2 (Gpx2) expression, significant (p < 0.05) elevation was found in both treated groups on day 1, while a significant (p < 0.0001) decrease was observed thereafter, at day 3, of OTA treatment (Figure 7D,E).
Figure 6.Effect of OTA expositions on theGstagene expression in the kidney cortex. A:Gstagene expression alterations of the single oral dose (24 h) OTA-treated kidney samples. The highest OTA dose decreased theGstamRNA level (p<0.01).B:Gstagene expression alterations of the repeated daily oral dose (72 h) OTA-treated kidney samples. Both applied OTA doses decreased theGstamRNA levels (p<0.01).C:Gstagene expression alterations of the repeated daily oral dose (21 days) OTA-treated kidney samples. OTA treatment did not influence theGstamRNA level. Abbreviations: MMS:
methyl-methanesulfonate-treated group; OTA 1 and OTA 10: 1 and 10 mg/kg bw ochratoxin-A-treated groups in the single oral dose (24 h) and repeated daily oral dose (72 h) experiment; OTA 0.5: 0.5 mg/kg bw ochratoxin-A-treated group in the repeated daily oral dose (21 days) experiment. Mean±S.D. Data were analyzed by one-way ANOVA and Tukey’s post hoc test. *p<0.05, **p<0.01, ***p<0.001 vs. vehicle.
Glutathione peroxidase 1 (Gpx1) expression in case of single oral dose (24 h) treatment did not change at day 1, but at day 3, both applied doses caused significantly lower expression (p<0.0001) than the control (vehicle) (Figure7A,B), and at day 21 (p<0.01) of the repeated oral dose (Figure7C).
As regards glutathione peroxidase 2 (Gpx2) expression, significant (p<0.05) elevation was found in both treated groups on day 1, while a significant (p<0.0001) decrease was observed thereafter, at day 3, of OTA treatment (Figure7D,E).
2.7. Expression Alteration at mRNA and Protein Level of Nrf2 and Keap1
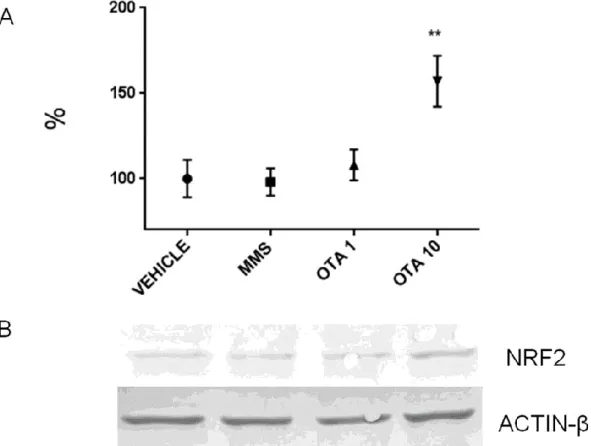
Single oral dose (24 h) OTA treatment significantly increased theNrf2expression at mRNA level at both OTA doses (Figure8A,p<0.01 andp<0.001, respectively). However, the NRF2 protein level was robustly decreased at both OTA doses introduced (p<0.05 in the OTA 1 group andp<0.01 in the OTA 10 group) (Figure9). However, the phosphorylated NRF2 (at Ser40 amino acid) protein level was not changed due to OTA administration (Figure S6 in Supplementary Materials). The NRF2 protein level was increased at the higher OTA-treated group (p<0.01) (Figure10). On the other hand, the Ser40 phosphorylated NRF2 expressions remained stable at the protein level (Figure S7 in Supplementary Materials). The expression of the Keap1 significantly decreased at mRNA level by dose-dependent manner to single oral dose (24 h) OTA administration on day 1 (Figure11,p<0.01 at the highest OTA-dose-treated group). On day 3, the repeated daily oral dose (72 h) OTA administration elevated theNrf2mRNA level at both applied doses (p<0.01 in the OTA 1 group andp<0.001 in the OTA 10 group) (Figure8B). On day 3 of OTA exposure, theKeap1mRNA level decreased significantly, but independently of the OTA dose applied (Figure11B,p<0.05). The repeated daily oral dose (21 days) OTA treatment significantly elevated theNrf2mRNA level (Figure8C,p<0.01), but the protein levels of NRF2 and its Ser40 phosphorylated form were not altered (Figures S8 and S9 in Supplementary Materials). The repeated daily oral dose (21 days) administration of the MMS as a positive control caused an increase in the NRF2 and NRF2 (Ser40) phosphorylated protein levels (Figures S8 and S9,p<0.01). However, the repeated daily oral dose (21 days) OTA treatment did not influence theKeap1mRNA expression (Figure11C).
Toxins2020,12, 732 9 of 25
Toxins 2020, 12, x FOR PEER REVIEW 9 of 25
Figure 7. Effect of OTA expositions on the Gpx1 and Gpx2 mRNA expression levels in the kidney cortex. A: Gpx1 gene mRNA expressions of the single oral dose (24 h) OTA-treated kidney samples.
OTA treatment did not influence the Gpx1 mRNA level. B: Gpx1 gene expression levels of the repeated daily oral dose (72 h) OTA-treated kidney samples. Both applied OTA doses decreased the Gpx1 mRNA levels (p < 0.001). C: Gpx1 gene expression alterations of the repeated daily oral dose (21 days) OTA-treated kidney samples. The applied OTA dose decreased the Gpx1 mRNA level (p < 0.01). D:
Gpx2 gene expression of the single oral dose (24 h) OTA-treated kidney samples. Both applied OTA doses increased the Gpx2 mRNA levels (p < 0.05). E: Gpx2 gene expression alterations of the repeated daily oral dose (72 h) OTA-treated kidney samples. Both applied OTA doses decreased the Gpx1 mRNA levels (p < 0.001). F: Gpx2 gene expression levels of the repeated daily oral dose (21 days) OTA- treated kidney samples. OTA treatment did not significantly influence the Gpx2 mRNA level.
Abbreviations: MMS: methyl-methanesulfonate-treated group; OTA 1 and OTA 10: 1 and 10 mg/kg bw ochratoxin-A-treated groups in the single oral dose (24 h) and repeated daily oral dose (72 h) experiment; OTA 0.5: 0.5 mg/kg bw ochratoxin-A-treated group in the repeated daily oral dose (21 days) experiment. Mean ± S.D. Data were analyzed by one-way ANOVA and Tukey's post hoc test.
*p < 0.05, **p < 0.01, ****p < 0.0001 vs. vehicle.
2.7. Expression Alteration at mRNA and Protein Level of Nrf2 and Keap1
Single oral dose (24 h) OTA treatment significantly increased the Nrf2 expression at mRNA level at both OTA doses (Figure 8A, p < 0.01 and p < 0.001, respectively). However, the NRF2 protein level was robustly decreased at both OTA doses introduced (p < 0.05 in the OTA 1 group and p < 0.01 in the OTA 10 group) (Figure 9). However, the phosphorylated NRF2 (at Ser40 amino acid) protein level was not changed due to OTA administration (Figure S6 in Supplementary Materials). The NRF2 protein level was increased at the higher OTA-treated group (p < 0.01) (Figure 10). On the other hand, the Ser40 phosphorylated NRF2 expressions remained stable at the protein level (Figure S7 in Supplementary Materials). The expression of the Keap1 significantly decreased at mRNA level by dose-dependent manner to single oral dose (24 h) OTA administration on day 1 (Figure 11, p < 0.01 at the highest OTA-dose-treated group). On day 3, the repeated daily oral dose (72 h) OTA administration elevated the Nrf2 mRNA level at both applied doses (p < 0.01 in the OTA 1 group and p < 0.001 in the OTA 10 group) (Figure 8B). On day 3 of OTA exposure, the Keap1 mRNA level decreased significantly, but independently of the OTA dose applied (Figure 11B, p < 0.05). The repeated daily oral dose (21 days) OTA treatment significantly elevated the Nrf2 mRNA level (Figure 8C, p < 0.01), but the protein levels of NRF2 and its Ser40 phosphorylated form were not altered
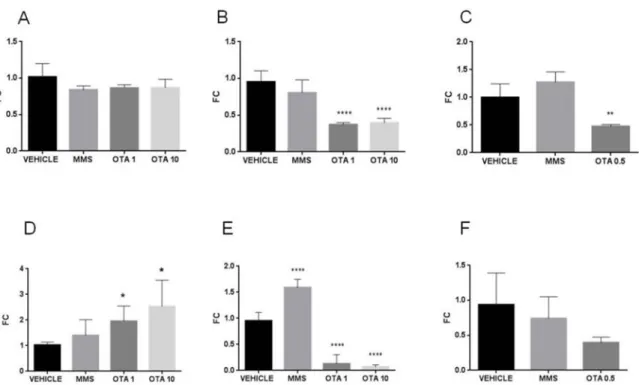
Figure 7.Effect of OTA expositions on theGpx1andGpx2mRNA expression levels in the kidney cortex.
A: Gpx1 gene mRNA expressions of the single oral dose (24 h) OTA-treated kidney samples.
OTA treatment did not influence theGpx1 mRNA level. B: Gpx1 gene expression levels of the repeated daily oral dose (72 h) OTA-treated kidney samples. Both applied OTA doses decreased theGpx1mRNA levels (p<0.001). C:Gpx1gene expression alterations of the repeated daily oral dose (21 days) OTA-treated kidney samples. The applied OTA dose decreased theGpx1mRNA level (p<0.01).D:Gpx2gene expression of the single oral dose (24 h) OTA-treated kidney samples.
Both applied OTA doses increased theGpx2mRNA levels (p<0.05).E:Gpx2gene expression alterations of the repeated daily oral dose (72 h) OTA-treated kidney samples. Both applied OTA doses decreased theGpx1mRNA levels (p<0.001).F:Gpx2gene expression levels of the repeated daily oral dose (21 days) OTA-treated kidney samples. OTA treatment did not significantly influence theGpx2mRNA level.
Abbreviations: MMS: methyl-methanesulfonate-treated group; OTA 1 and OTA 10: 1 and 10 mg/kg bw ochratoxin-A-treated groups in the single oral dose (24 h) and repeated daily oral dose (72 h) experiment;
OTA 0.5: 0.5 mg/kg bw ochratoxin-A-treated group in the repeated daily oral dose (21 days) experiment.
Mean±S.D. Data were analyzed by one-way ANOVA and Tukey’s post hoc test. *p<0.05, **p<0.01,
****p<0.0001 vs. vehicle.
2.8. Gene Expression Alteration of the Antioxidant Response Element (ARE) Responsive Genes
The heme oxygenase 1 (Ho-1) mRNA level increased significantly in repeated daily oral dose (72 h) toxicity at the highest dose of mycotoxin exposure exclusively (Figure12B,p<0.05), but did not change as effect of repeated oral dose for 21 days (Figure12C). The NAD(p)H dehydrogenase (quinone) (Nqo1) mRNA levels reduced significantly in the single oral dose (24 h) and repeated daily oral dose (72 h) OTA-treated animals, independently of the applied OTA dose (Figure13A,B,p<0.01,p<0.001 andp<0.01,p<0.05, respectively). However, repeated daily oral dose (21 days) OTA exposure did not affectNqo1gene expression (Figure13C). The glutathione synthetase (Gss) mRNA expression was reduced exclusively in a single oral dose (24 h) and repeated daily oral dose (72 h) experiments in a dose-dependent manner (Figure14A,B,p<0.001, andp<0.01, respectively), but no significant changes were found as effect of repeated oral dose for 21 days (Figure14C).
Toxins2020,12, 732 10 of 25
Toxins 2020, 12, x FOR PEER REVIEW 10 of 25
(Figure S8 and Figure S9 in Supplementary Materials). The repeated daily oral dose (21 days) administration of the MMS as a positive control caused an increase in the NRF2 and NRF2 (Ser40) phosphorylated protein levels (Figure S8, Figure S9, p < 0.01). However, the repeated daily oral dose (21 days) OTA treatment did not influence the Keap1 mRNA expression (Figure 11C).
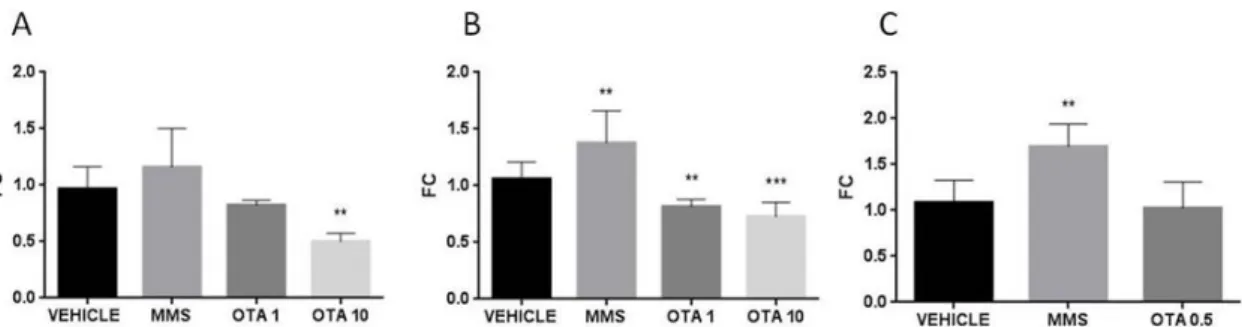
Figure 8. Effect of OTA expositions on the Nrf2 mRNA expression levels in the kidney. (A) Nrf2 gene mRNA expressions of the single oral dose (24 h) OTA-treated kidney samples. Both applied OTA doses increased the Nrf2 mRNA levels (p < 0.01 and 0.0001, respectively). (B) Nrf2 gene expression levels of the repeated daily oral dose (72 h) OTA-treated kidney samples. Both applied OTA doses increased the Nrf2 mRNA levels (p < 0.01 and 0.0001, respectively). (C) Nrf2 gene expression alterations of the repeated daily oral dose (21 days) OTA-treated kidney samples. The applied OTA dose increased the Nrf2 mRNA level (**p < 0.01). Abbreviations: MMS: methyl-methanesulfonate- treated group; OTA 1 and OTA 10: 1 and 10 mg/kg bw ochratoxin-A-treated groups in the single oral dose (24 h) and repeated daily oral dose (72 h) experiment; OTA 0.5: 0.5 mg/kg bw ochratoxin-A- treated group in the repeated daily oral dose (21 days) experiment. Mean± S.D. Data were analyzed by one-way ANOVA and Tukey's post hoc test. **p < 0.01, ****p < 0.0001 vs. vehicle.
Figure 9. Effect of single oral dose (24 h) OTA expositions on the NRF2 protein expression levels in the kidney. (A) Quantification of protein expression normalized to vehicle-treated controls by densitometry. Significant differences were found in the OTA-treated animals. (B) Representative examples of Western blots using kidney homogenates from mice. Abbreviations: MMS: methyl- methanesulfonate-treated group; OTA 1 and OTA 10: 1 and 10 mg/kg bw ochratoxin-A-treated groups in the single oral dose (24 h) experiment. Mean ± S.D. Data were analyzed by one-way ANOVA and Tukey's post hoc test. *p < 0.05, **p < 0.01 vs. vehicle.
Figure 8.Effect of OTA expositions on theNrf2mRNA expression levels in the kidney. (A)Nrf2gene mRNA expressions of the single oral dose (24 h) OTA-treated kidney samples. Both applied OTA doses increased theNrf2mRNA levels (p<0.01 and 0.0001, respectively). (B)Nrf2gene expression levels of the repeated daily oral dose (72 h) OTA-treated kidney samples. Both applied OTA doses increased theNrf2mRNA levels (p<0.01 and 0.0001, respectively). (C)Nrf2gene expression alterations of the repeated daily oral dose (21 days) OTA-treated kidney samples. The applied OTA dose increased the Nrf2mRNA level (**p<0.01). Abbreviations: MMS: methyl-methanesulfonate-treated group; OTA 1 and OTA 10: 1 and 10 mg/kg bw ochratoxin-A-treated groups in the single oral dose (24 h) and repeated daily oral dose (72 h) experiment; OTA 0.5: 0.5 mg/kg bw ochratoxin-A-treated group in the repeated daily oral dose (21 days) experiment. Mean±S.D. Data were analyzed by one-way ANOVA and Tukey’s post hoc test. **p<0.01, ****p<0.0001 vs. vehicle.
Toxins 2020, 12, x FOR PEER REVIEW 10 of 25
(Figure S8 and Figure S9 in Supplementary Materials). The repeated daily oral dose (21 days) administration of the MMS as a positive control caused an increase in the NRF2 and NRF2 (Ser40) phosphorylated protein levels (Figure S8, Figure S9, p < 0.01). However, the repeated daily oral dose (21 days) OTA treatment did not influence the Keap1 mRNA expression (Figure 11C).
Figure 8. Effect of OTA expositions on the Nrf2 mRNA expression levels in the kidney. (A) Nrf2 gene mRNA expressions of the single oral dose (24 h) OTA-treated kidney samples. Both applied OTA doses increased the Nrf2 mRNA levels (p < 0.01 and 0.0001, respectively). (B) Nrf2 gene expression levels of the repeated daily oral dose (72 h) OTA-treated kidney samples. Both applied OTA doses increased the Nrf2 mRNA levels (p < 0.01 and 0.0001, respectively). (C) Nrf2 gene expression alterations of the repeated daily oral dose (21 days) OTA-treated kidney samples. The applied OTA dose increased the Nrf2 mRNA level (**p < 0.01). Abbreviations: MMS: methyl-methanesulfonate- treated group; OTA 1 and OTA 10: 1 and 10 mg/kg bw ochratoxin-A-treated groups in the single oral dose (24 h) and repeated daily oral dose (72 h) experiment; OTA 0.5: 0.5 mg/kg bw ochratoxin-A- treated group in the repeated daily oral dose (21 days) experiment. Mean± S.D. Data were analyzed by one-way ANOVA and Tukey's post hoc test. **p < 0.01, ****p < 0.0001 vs. vehicle.
Figure 9. Effect of single oral dose (24 h) OTA expositions on the NRF2 protein expression levels in the kidney. (A) Quantification of protein expression normalized to vehicle-treated controls by densitometry. Significant differences were found in the OTA-treated animals. (B) Representative examples of Western blots using kidney homogenates from mice. Abbreviations: MMS: methyl- methanesulfonate-treated group; OTA 1 and OTA 10: 1 and 10 mg/kg bw ochratoxin-A-treated groups in the single oral dose (24 h) experiment. Mean ± S.D. Data were analyzed by one-way ANOVA and Tukey's post hoc test. *p < 0.05, **p < 0.01 vs. vehicle.
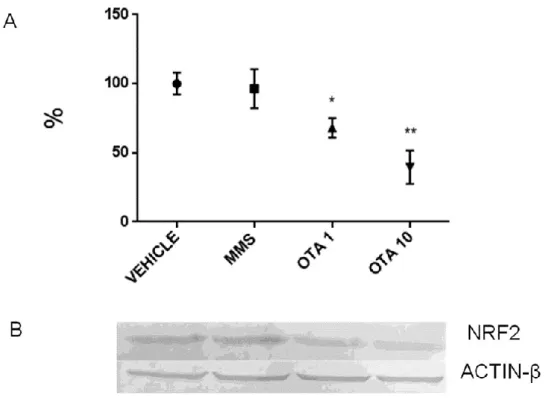
Figure 9. Effect of single oral dose (24 h) OTA expositions on the NRF2 protein expression levels in the kidney. (A) Quantification of protein expression normalized to vehicle-treated controls by densitometry.
Significant differences were found in the OTA-treated animals. (B) Representative examples of Western blots using kidney homogenates from mice. Abbreviations: MMS: methyl-methanesulfonate-treated group; OTA 1 and OTA 10: 1 and 10 mg/kg bw ochratoxin-A-treated groups in the single oral dose (24 h) experiment. Mean±S.D. Data were analyzed by one-way ANOVA and Tukey’s post hoc test. *p<0.05,
**p<0.01 vs. vehicle.
Toxins2020,12, 732 11 of 25
Toxins 2020, 12, x FOR PEER REVIEW 11 of 25
Figure 10. Effect of repeated daily oral dose (72 h) OTA expositions on the expression of NRF2 protein in the kidney. (A) Protein expression normalized to vehicle-treated controls by densitometry.
Significant protein expression elevation was found in the high dose of OTA-treated animals. (B) Representative examples of Western blots from kidney homogenates mice. Abbreviations: MMS:
methyl-methanesulfonate-treated group; OTA 1 and OTA 10: 1 and 10 mg/kg bw ochratoxin-A- treated groups in the repeated daily oral dose (72 h) experiment. Mean ± S.D. Data were analyzed by one-way ANOVA and Tukey's post hoc test. **p < 0.01 vs. vehicle.
Figure 11. Effect of OTA expositions on the Keap1 mRNA expression levels in the kidney. A: Keap1 gene mRNA expressions of the single oral dose (24 h) OTA-treated kidney samples. The highest OTA dose decreased the Keap1 mRNA level (p < 0.01). B: Keap1 gene expression levels of the repeated daily oral dose (72 h) OTA-treated kidney samples. Both applied OTA doses decreased the Keap1 mRNA levels (p < 0.05)., C: Keap1 gene expression alterations of the repeated daily oral dose (21 days) OTA- treated kidney samples. The OTA treatment did not influence the Keap1 mRNA level significantly.
Abbreviations: MMS: methyl-methanesulfonate-treated group, OTA 1; and OTA 10: 1 and 10 mg/kg bw ochratoxin-A-treated groups in the single oral dose (24 h) and repeated daily oral dose (72 h) experiment; OTA 0.5: 0.5 mg/kg bw ochratoxin-A-treated group in the repeated daily oral dose (21 days) experiment. Mean ± S.D. Data were analyzed by one-way ANOVA and Tukey's post hoc test.*p
< 0.05, **p < 0.01 vs. vehicle.
Figure 10. Effect of repeated daily oral dose (72 h) OTA expositions on the expression of NRF2 protein in the kidney. (A) Protein expression normalized to vehicle-treated controls by densitometry.
Significant protein expression elevation was found in the high dose of OTA-treated animals.
(B) Representative examples of Western blots from kidney homogenates mice. Abbreviations: MMS:
methyl-methanesulfonate-treated group; OTA 1 and OTA 10: 1 and 10 mg/kg bw ochratoxin-A-treated groups in the repeated daily oral dose (72 h) experiment. Mean±S.D. Data were analyzed by one-way ANOVA and Tukey’s post hoc test. **p<0.01 vs. vehicle.
Toxins 2020, 12, x FOR PEER REVIEW 11 of 25
Figure 10. Effect of repeated daily oral dose (72 h) OTA expositions on the expression of NRF2 protein in the kidney. (A) Protein expression normalized to vehicle-treated controls by densitometry.
Significant protein expression elevation was found in the high dose of OTA-treated animals. (B) Representative examples of Western blots from kidney homogenates mice. Abbreviations: MMS:
methyl-methanesulfonate-treated group; OTA 1 and OTA 10: 1 and 10 mg/kg bw ochratoxin-A- treated groups in the repeated daily oral dose (72 h) experiment. Mean ± S.D. Data were analyzed by one-way ANOVA and Tukey's post hoc test. **p < 0.01 vs. vehicle.
Figure 11. Effect of OTA expositions on the Keap1 mRNA expression levels in the kidney. A: Keap1 gene mRNA expressions of the single oral dose (24 h) OTA-treated kidney samples. The highest OTA dose decreased the Keap1 mRNA level (p < 0.01). B: Keap1 gene expression levels of the repeated daily oral dose (72 h) OTA-treated kidney samples. Both applied OTA doses decreased the Keap1 mRNA levels (p < 0.05)., C: Keap1 gene expression alterations of the repeated daily oral dose (21 days) OTA- treated kidney samples. The OTA treatment did not influence the Keap1 mRNA level significantly.
Abbreviations: MMS: methyl-methanesulfonate-treated group, OTA 1; and OTA 10: 1 and 10 mg/kg bw ochratoxin-A-treated groups in the single oral dose (24 h) and repeated daily oral dose (72 h) experiment; OTA 0.5: 0.5 mg/kg bw ochratoxin-A-treated group in the repeated daily oral dose (21 days) experiment. Mean ± S.D. Data were analyzed by one-way ANOVA and Tukey's post hoc test.*p
< 0.05, **p < 0.01 vs. vehicle.
Figure 11. Effect of OTA expositions on theKeap1mRNA expression levels in the kidney.A:Keap1 gene mRNA expressions of the single oral dose (24 h) OTA-treated kidney samples. The highest OTA dose decreased theKeap1mRNA level (p<0.01). B:Keap1gene expression levels of the repeated daily oral dose (72 h) OTA-treated kidney samples. Both applied OTA doses decreased theKeap1 mRNA levels (p<0.05).C:Keap1gene expression alterations of the repeated daily oral dose (21 days) OTA-treated kidney samples. The OTA treatment did not influence theKeap1mRNA level significantly.
Abbreviations: MMS: methyl-methanesulfonate-treated group, OTA 1; and OTA 10: 1 and 10 mg/kg bw ochratoxin-A-treated groups in the single oral dose (24 h) and repeated daily oral dose (72 h) experiment; OTA 0.5: 0.5 mg/kg bw ochratoxin-A-treated group in the repeated daily oral dose (21 days) experiment. Mean±S.D. Data were analyzed by one-way ANOVA and Tukey’s post hoc test.*p<0.05,
**p<0.01 vs. vehicle.
Toxins2020,12, 732 12 of 25
Toxins 2020, 12, x FOR PEER REVIEW 12 of 25
2.8. Gene Expression Alteration of the Antioxidant Response Element (ARE) Responsive Genes
The heme oxygenase 1 (Ho-1) mRNA level increased significantly in repeated daily oral dose (72 h) toxicity at the highest dose of mycotoxin exposure exclusively (Figure 12B, p < 0.05), but did not change as effect of repeated oral dose for 21 days (Figure 12C). The NAD(p)H dehydrogenase (quinone) (Nqo1) mRNA levels reduced significantly in the single oral dose (24 h) and repeated daily oral dose (72 h) OTA-treated animals, independently of the applied OTA dose (Figure 13A,B, p < 0.01, p < 0.001 and p < 0.01, p < 0.05, respectively). However, repeated daily oral dose (21 days) OTA exposure did not affect Nqo1 gene expression (Figure 13C). The glutathione synthetase (Gss) mRNA expression was reduced exclusively in a single oral dose (24 h) and repeated daily oral dose (72 h) experiments in a dose-dependent manner (Figure 14A,B, p < 0.001, and p < 0.01, respectively), but no significant changes were found as effect of repeated oral dose for 21 days (Figure 14C).
Figure 12. Effect of OTA expositions on the hem-oxygenase (Ho-1) gene expression levels in the kidney. A: Ho-1 gene mRNA expressions of the single oral dose (24 h) OTA-treated kidney samples.
The OTA treatment had no significant effect on the Ho-1 mRNA level. B: Ho-1 gene expression levels of the repeated daily oral dose (72 h) OTA-treated kidney samples. The high dose of OTA treatment increased the Ho-1 mRNA level significantly (p < 0.05). C: Ho-1 gene expression alterations of the repeated daily oral dose (21 days) OTA-treated kidney samples. The OTA treatment did not influence significantly the Ho-1 mRNA level. Abbreviations: MMS: Group treated with methyl- methanesulfonate; OTA 1 and OTA 10: groups treated with 1 and 10 mg/kg bw ochratoxin A in the single oral dose (24 h) and repeated daily oral dose (72 h) experiment; OTA 0.5: group treated with 0.5 mg/kg bw ochratoxin A in the repeated daily oral dose (21 days) experiment. Values are expressed as the mean ± SD. Data were analyzed by one-way ANOVA followed by Tukey's post hoc test.*p <
0.05 vs. vehicle.
Figure 13. Effect of OTA expositions on the Nqo1 mRNA expression levels in the kidney. A: Nqo1 gene mRNA expressions of the single oral dose (24 h) OTA-treated kidney samples. Both applied OTA doses decreased the Nqo1 mRNA levels (p < 0.01 and p < 0.001, respectively). B: Nqo1 gene expression levels of the repeated daily oral dose (72 h) OTA-treated kidney samples. Both applied OTA doses decreased the Nqo1 mRNA levels (p < 0.01, and p < 0.05, respectively). C: Nqo1 gene expression alterations of the repeated daily oral dose (21 days) OTA-treated kidney samples. The OTA treatment did not have a significant effect on the Nqo1 mRNA level. Abbreviations: MMS: methyl- methanesulfonate-treated treated group; OTA 1 and OTA 10: 1 and 10 mg/kg bw ochratoxin-A-treated groups in the single oral dose (24 h) and repeated daily oral dose (72 h) experiment; OTA 0.5: 0.5 Figure 12.Effect of OTA expositions on the hem-oxygenase (Ho-1) gene expression levels in the kidney.
A:Ho-1gene mRNA expressions of the single oral dose (24 h) OTA-treated kidney samples. The OTA treatment had no significant effect on theHo-1mRNA level. B:Ho-1gene expression levels of the repeated daily oral dose (72 h) OTA-treated kidney samples. The high dose of OTA treatment increased theHo-1mRNA level significantly (p<0.05).C:Ho-1gene expression alterations of the repeated daily oral dose (21 days) OTA-treated kidney samples. The OTA treatment did not influence significantly theHo-1mRNA level. Abbreviations: MMS: Group treated with methyl-methanesulfonate; OTA 1 and OTA 10: groups treated with 1 and 10 mg/kg bw ochratoxin A in the single oral dose (24 h) and repeated daily oral dose (72 h) experiment; OTA 0.5: group treated with 0.5 mg/kg bw ochratoxin A in the repeated daily oral dose (21 days) experiment. Values are expressed as the mean±SD. Data were analyzed by one-way ANOVA followed by Tukey’s post hoc test.*p<0.05 vs. vehicle.
Toxins 2020, 12, x FOR PEER REVIEW 12 of 25
2.8. Gene Expression Alteration of the Antioxidant Response Element (ARE) Responsive Genes
The heme oxygenase 1 (Ho-1) mRNA level increased significantly in repeated daily oral dose (72 h) toxicity at the highest dose of mycotoxin exposure exclusively (Figure 12B, p < 0.05), but did not change as effect of repeated oral dose for 21 days (Figure 12C). The NAD(p)H dehydrogenase (quinone) (Nqo1) mRNA levels reduced significantly in the single oral dose (24 h) and repeated daily oral dose (72 h) OTA-treated animals, independently of the applied OTA dose (Figure 13A,B, p < 0.01, p < 0.001 and p < 0.01, p < 0.05, respectively). However, repeated daily oral dose (21 days) OTA exposure did not affect Nqo1 gene expression (Figure 13C). The glutathione synthetase (Gss) mRNA expression was reduced exclusively in a single oral dose (24 h) and repeated daily oral dose (72 h) experiments in a dose-dependent manner (Figure 14A,B, p < 0.001, and p < 0.01, respectively), but no significant changes were found as effect of repeated oral dose for 21 days (Figure 14C).
Figure 12. Effect of OTA expositions on the hem-oxygenase (Ho-1) gene expression levels in the kidney. A: Ho-1 gene mRNA expressions of the single oral dose (24 h) OTA-treated kidney samples.
The OTA treatment had no significant effect on the Ho-1 mRNA level. B: Ho-1 gene expression levels of the repeated daily oral dose (72 h) OTA-treated kidney samples. The high dose of OTA treatment increased the Ho-1 mRNA level significantly (p < 0.05). C: Ho-1 gene expression alterations of the repeated daily oral dose (21 days) OTA-treated kidney samples. The OTA treatment did not influence significantly the Ho-1 mRNA level. Abbreviations: MMS: Group treated with methyl- methanesulfonate; OTA 1 and OTA 10: groups treated with 1 and 10 mg/kg bw ochratoxin A in the single oral dose (24 h) and repeated daily oral dose (72 h) experiment; OTA 0.5: group treated with 0.5 mg/kg bw ochratoxin A in the repeated daily oral dose (21 days) experiment. Values are expressed as the mean ± SD. Data were analyzed by one-way ANOVA followed by Tukey's post hoc test.*p <
0.05 vs. vehicle.
Figure 13. Effect of OTA expositions on the Nqo1 mRNA expression levels in the kidney. A: Nqo1 gene mRNA expressions of the single oral dose (24 h) OTA-treated kidney samples. Both applied OTA doses decreased the Nqo1 mRNA levels (p < 0.01 and p < 0.001, respectively). B: Nqo1 gene expression levels of the repeated daily oral dose (72 h) OTA-treated kidney samples. Both applied OTA doses decreased the Nqo1 mRNA levels (p < 0.01, and p < 0.05, respectively). C: Nqo1 gene expression alterations of the repeated daily oral dose (21 days) OTA-treated kidney samples. The OTA treatment did not have a significant effect on the Nqo1 mRNA level. Abbreviations: MMS: methyl- methanesulfonate-treated treated group; OTA 1 and OTA 10: 1 and 10 mg/kg bw ochratoxin-A-treated groups in the single oral dose (24 h) and repeated daily oral dose (72 h) experiment; OTA 0.5: 0.5 Figure 13.Effect of OTA expositions on theNqo1mRNA expression levels in the kidney.A:Nqo1gene mRNA expressions of the single oral dose (24 h) OTA-treated kidney samples. Both applied OTA doses decreased theNqo1mRNA levels (p<0.01 andp<0.001, respectively).B:Nqo1gene expression levels of the repeated daily oral dose (72 h) OTA-treated kidney samples. Both applied OTA doses decreased theNqo1mRNA levels (p<0.01, andp<0.05, respectively).C:Nqo1gene expression alterations of the repeated daily oral dose (21 days) OTA-treated kidney samples. The OTA treatment did not have asignificant effect on theNqo1mRNA level. Abbreviations: MMS: methyl-methanesulfonate-treated treated group; OTA 1 and OTA 10: 1 and 10 mg/kg bw ochratoxin-A-treated groups in the single oral dose (24 h) and repeated daily oral dose (72 h) experiment; OTA 0.5: 0.5 mg/kg bw ochratoxin-A-treated group in the repeated daily oral dose (21 days) experiment. Mean±S.D. Data were analyzed by one-way ANOVA and Tukey’s post hoc test.*p<0.05, **p<0.01, ***p<0.001, ****p<0.0001 vs. vehicle.
Toxins2020,12, 732 13 of 25
Toxins 2020, 12, x FOR PEER REVIEW 13 of 25
mg/kg bw ochratoxin-A-treated group in the repeated daily oral dose (21 days) experiment. Mean ± S.D. Data were analyzed by one-way ANOVA and Tukey's post hoc test.*p < 0.05, **p < 0.01, ***p <
0.001, ****p < 0.0001 vs. vehicle.
Figure 14. Effect of OTA expositions on the Gss mRNA expression levels in the kidney. A: Gss gene mRNA expressions of the single oral dose (24 h) OTA-treated kidney samples. The highest OTA dose decreased the Gss mRNA levels (p < 0.001). B: Gss gene expression levels of the repeated daily oral dose (72 h) OTA-treated kidney samples. The highest OTA dose decreased the Gss mRNA levels (p <
0.01). C: Gss gene expression alterations of the repeated daily oral dose (21 days) OTA-treated kidney samples. The applied OTA dose did not cause significant alteration. Abbreviations: MMS: methyl- methanesulfonate-treated group; OTA 1 and OTA 10: 1 and 10 mg/kg bw ochratoxin-A-treated groups in the single oral dose (24 h) and repeated daily oral dose (72 h) experiment; OTA 0.5: 0.5 mg/kg bw ochratoxin-A-treated group in the repeated daily oral dose (21 days) experiment. Mean ± S.D. Data were analyzed by one-way ANOVA and Tukey's post hoc test. **p < 0.01, ***p < 0.001 vs.
vehicle.
2.9. Expression Changes of the Duperoxide Dismutase (Sod) Enzymes in the Kidney
Single OTA administration significantly increased Sod1 mRNA expression at the highest dose treated group (Figure 15A, p < 0.05), but not significant difference was found in Sod2 mRNA expression (Figure 15D). However, at day 3, after repeated daily oral dose (72 h), OTA exposure in both enzyme Sod1 and Sod2 expressions at mRNA level decreased significantly (Figure 15B, p < 0.01 and p < 0.001 in OTA 1 and OTA 10 groups, respectively) (Figure 15E, p < 0.001 in OTA 10 group).
Repeated daily oral dose (21 days) mycotoxin treatment did not influence the Sod enzymes at the mRNA level significantly (Figure 15 C,F).
Figure 14.Effect of OTA expositions on theGssmRNA expression levels in the kidney.A:Gssgene mRNA expressions of the single oral dose (24 h) OTA-treated kidney samples. The highest OTA dose decreased theGssmRNA levels (p<0.001).B:Gssgene expression levels of the repeated daily oral dose (72 h) OTA-treated kidney samples. The highest OTA dose decreased theGssmRNA levels (p<0.01). C:Gssgene expression alterations of the repeated daily oral dose (21 days) OTA-treated kidney samples. The applied OTA dose did not cause significant alteration. Abbreviations: MMS:
methyl-methanesulfonate-treated group; OTA 1 and OTA 10: 1 and 10 mg/kg bw ochratoxin-A-treated groups in the single oral dose (24 h) and repeated daily oral dose (72 h) experiment; OTA 0.5: 0.5 mg/kg bw ochratoxin-A-treated group in the repeated daily oral dose (21 days) experiment. Mean±S.D. Data were analyzed by one-way ANOVA and Tukey’s post hoc test. **p<0.01, ***p<0.001 vs. vehicle.
2.9. Expression Changes of the Duperoxide Dismutase (Sod) Enzymes in the Kidney
Single OTA administration significantly increasedSod1mRNA expression at the highest dose treated group (Figure15A,p<0.05), but not significant difference was found inSod2mRNA expression (Figure15D). However, at day 3, after repeated daily oral dose (72 h), OTA exposure in both enzyme Sod1andSod2expressions at mRNA level decreased significantly (Figure15B,p<0.01 andp<0.001 in OTA 1 and OTA 10 groups, respectively) (Figure15E,p<0.001 in OTA 10 group). Repeated daily oral dose (21 days) mycotoxin treatment did not influence the Sod enzymes at the mRNA level significantly (Figure15C,F).
2.10. Hace1 and Rac1 mRNA Expression Changes by OTA Administration in the Kidney
Single high-dose OTA administration increased the HECT domain. The mRNA expression of the ankyrin repeat-containing E3 ubiquitin-protein ligase 1 (Hace1) also increased significantly (Figure16A, p<0.01). On the other hand, the repeated daily oral dose (72 h) OTA exposition significantly decreased theHace1expression at the mRNA level in both applied dose (Figure16B,p<0.001). On the contrary, the repeated daily oral dose (21 days) OTA exposition significantly increased theHace1mRNA level (Figure16C,p<0.05). The Rac family small GTPase 1 (Rac1) mRNA expression significantly elevated at day 3 in kidney samples of the highest OTA-exposed group (Figure16E,p<0.001). The other treatments did not alter the Rac1 expressions (Figure16D,F).