Cohesion and Development Policy in Europe
Ákos Bodor – Zoltán Grünhut (eds.)
Cohesion and Development Policy in Europe
Editors
Ákos Bodor Zoltán Grünhut
Institute for Regional Studies Centre for Economic and Regional Studies Hungarian Academy of Sciences Pécs, 2015
ISBN 978 963 9899 87 2
© Institute for Regional Studies,
Centre for Economic and Regional Studies, Hungarian Academy of Sciences
Revised by: Péter Tamási
Technical editor: Ilona Strasserné Csapó Figures: Valéria Fonyódi
CONTENTS
Has the Economic and Financial Crisis Reversed Regional Convergence in the European Union? An Analysis of the New Data
Robert Leonardi ... 5 Regional Development in the Course of Economic Integration: The Case
of German Unification, Development Path and Policy Experiences
Gerhard Heimpold ... 33 Spatial Structure and Spillover Effects
Gábor Balás – Klára Major ... 42 Building Institutions for the Structural Funds in the Visegrad Countries
Cecília Mezei ... 60 A Study of Rural Development Sustainability in Harghita County, Romania
Andrea Csata ... 72 Territorial Processes and their Implementation in the Practice of Regional
Planning – on the Example of Hajdú–Bihar County
Zsolt Radics – Ernő Molnár – János Pénzes ... 87 Social Responsibility and Territorial Development
Adrienn Reisinger ... 99 The spatial Structure of Financial Services in the South Pannonian Region
Sándor Zsolt Kovács ... 109 Theoretical Comments on the Concept of Territorial Capital
Ákos Bodor – Zoltán Grünhut ... 119 LIST OF AUTHORS ... 133
HAS THE ECONOMIC AND FINANCIAL CRISIS REVERSED REGIONAL CONVERGENCE IN THE EUROPEAN UNION?
AN ANALYSIS OF THE NEW DATA
Robert Leonardi
Introduction
One of the most significant trends of the past thirty years in regional development has been the reduction in socioeconomic disparities between the developed and the less developed regions of the European Union (EU). At the beginning of 1989 when the Cohesion Policy was launched and the first cycle of Structural Funds resources allocated (1989–1993) to pursue the aim of bridging regional disparities, vast sections of the European ‘periphery’ that included the regions in southern Europe but also Ireland and the north and west of the UK, were below the EU mean of 75%
in terms of the average GDP per capita as measured by PPS (Purchasing Power Standard). Yet, by the end of the third programmatic cycle (2000–2006) of the Structural Funds most of the less developed regions had moved beyond that 75%
threshold. Ireland existed completely from Objective 1 or the Convergence objective in 2000; Spain’s original thirteen less developed regions were cut to one for the new planning cycle of 2014–2020; Portugal’s original seven regions requiring special assistance have been reduced to three; in 1989 Italy had eight regions in Objective 1 and now that number has been whittled down to four; Greece began participating in the Cohesion Policy with the entire country (i.e., thirteen regions) eligible for socioeconomic assistance and in the 2014–2020 cycle the total of eligible regions will have been cut by nine leaving four with special assistance; and in the UK only western part of Wales continues to receive special consideration by the Cohesion Policy. A similar trend emerged in the eastern part of Germany and in the new Member States in Central and Eastern Europe during and immediately after their accession to the EU in 2004.
However, after 2008 the socioeconomic crisis that has hit most of Europe places into question this convergence trend in Southern Europe and in many of the new Member States in Eastern Europe. As Member States struggle to balance budgets;
re-establish confidence in the viability of their economies; and return their economies to a process of growth – the prospect on the horizon for the near future seems to be the opposite of what we have seen up to 2007 – that is, divergence – and
6 Robert Leonardi the emergence of a new centre-periphery dynamics in which the growth rates registered in the periphery have difficulty in keeping up with the growth trends in the core areas of Europe.
This paper investigates the theoretical issues and empirical trends that emerged with the creation of the Single Market and the associated Cohesion Policy. What in effect happened after 1989 when the Cohesion Policy was initiated and when the Single Market programme was implemented? In addition, we will look at the impact of the Single Currency during the period 2000–2007.
These results will be contrasted with what has happened after 2008 to the prospects for growth following the financial and economic crisis and how the crisis has or has not been taken into account in the formulation of the next cycle of Cohe- sion Policy for 2014–2020. The three research questions which are addressedhere deal with: (1) what were the expectations in the creation of the Single Market and Single Currency and have these expectations been supported by the empirical re- sults; (2) how has the new Cohesion Policy taken into account the economic and financial crisis of 2009–2013; and (3) what needs to be done to make the new Cohe- sion Policy more respondent to the crisis?
The Literature on the Impact of the Single Market on Peripheral Economies
Most of the literature before 1993 when the Single Market came into effect, dealt primarily with the ‘projected’ results (e.g. Padoa-Schioppa Report 1987, Cecchini Report 1988, Baldwin 1989) or the impact of the Single Market based on a set of contradictory assumptions. Few empirical studies existed on the overall impact of market liberalisation and integration in Europe as a result of European integration under the Common Market programme or the general post-WWII trend of opening up European markets. The major exception was the work of Molle et al. (1980) and Barrow and Sala-i-Martin (1991).
It was only after 1993 that the focus of attention changed to take into account what had actually happened in response to the creation of the Single Market. After 1993 more focused empirical studies emerged on how the Single Market was impacting growth, employment, competition and regional disparities. The question posed by most observers was whether the Single Market represented a further stage in the opening of markets in Europe after what had happened in the post-war period and the beginning of European integration with the European Coal and Steel Community (1951) and European Common Market (1957) or whether the Single Market represented a radical departure from what had happened before.
Though the thinking behind the creation of the Single Market broke new ground in terms of European politics and polices, for many of the leading figures in the
Has the Economic and Financial Crisis Reversed Regional Convergence… 7 European Community it represented instead the logical next step in building on the achievements of the Common Market and the Customs Union. The Single Market proposed to go beyond the elimination of customs duties and tariffs on goods and to move on to the elimination of all of the ‘non-tariff’ barriers to the free flow of the factors of production: capital, labour and technology. Thus, in his introduction to the Cecchini Report, Jacques Delors stated that the objective of creating a large and truly unified economic area in Europe by 1992 was formidable but it promised to provide substantial benefits:
“This large market without frontiers, because of its size and because of the possibilities that it offers for scientific, technical and commercial cooperation, gives a unique opportunity to our industry to improve its competitivity. It will also increase growth and employment and contribute to a better balance in the world economy” (1988: xi).
Aside from the economic objectives, Delors argued that attention also had to be placed on improving the Community’s economic and social ‘dimension’ in providing an increase in resources to combat long-term and youth unemployment, spur rural development, help underdeveloped regional economies, and ameliorate industrial restructuring problems. Concern for economic and social cohesion had been a con- stant feature in the process of European integration, but with the creation of the Single Market it was transformed into a vital issue of concern for the political, eco- nomic and social stability of the post 1992 period. While the formation of the Single Market offered the promise of a significant increase in the output of the Community as a whole, the political viability of the project also required that the distribution of its benefits be perceived as fair by the constituent states and regions (Leonardi 1993a, De la Fuente and Vives 1995).
In 1989 the Delors Report on economic and monetary union provided the theoretical and political underpinning of the Single Market and Single Currency programmes. The Report pointed out both the positive as well as negative impacts of the Single Market on core versus peripheral areas.
“Historical experience suggests... that in the absence of countervailing policies, the overall impact on peripheral regions could be negative. Transport costs and economies of scale would tend to favour a shift in economic activity away from less developed regions, especially if they were at the periphery of the Community, to the highly developed areas at its centre. The economic and monetary union would have to encourage and guide structural adjustment which would help poorer regions to catch up with the wealthier ones” (CEC 1989, p. 22).
It is historically significant to note that the Community’s initial view on the im- pact on the less developed areas on the part of the Single Market and Single Currency was not completely optimistic. In fact, the prevailing view in the Commission was
8 Robert Leonardi that the impact would be negative in nature. Paul Krugman (1987) in his contribu- tion to the Padoa-Schioppa Report pointed out some of the negative consequences that might emerge from further market integration: increases in unemployment, agglomeration effects in particular industries, national competition/conflict over the rescue of national champions, uneven distribution of the gains from trade, management of migration flows, and lack in coordination of monetary policies. Thus, the expectation was that through market integration there would be a significant divergence of economic performance and wellbeing of the core vis-a-vis the peripheral areas. In other words, the fear was that the convergence of national and regional economies documented by Molle et al. (1980) during the 1950–70 period would be sacrificed to the strengthening of the core areas. It was feared that market integration: economic growth and job creation would take place in the core areas to the detriment of the peripheral ones. According to the Delors Report (1988) the Single Market was not viable from a political and social point of view without a parallel policy capable of absorbing the expected negative shocks of market integra- tion on peripheral underdeveloped areas.
To avoid such an outcome it was felt that a pro-active regional policy could serve to alleviate the negative impact of opening the market on less developed areas and help to restructure regional economies so that the least developed and peripheral regions could participate in the beneficial aspects of economic integration. In this manner, the Community would help to promote the forces of convergence against those pushing toward divergence. This approach to cohesion policy has been consistently reconfirmed from 1989 to the present (e.g. Monti 2010).
Lord Cockfield, the coordinator of the Commission’s White Paper on the Single Market (1985) admitted that in 1985 the 1992 Single Market programme repre- sented “an act of faith – confidence in the present and faith in the future – that we – the Community – embarked on this task”, but with the publication of the Cecchini Report:
“...we are able for the first time to see the precise measure of what we are going to achieve. Now we have the hard evidence, the confirmation of what those who are engaged in building Europe have always known: that the failure to achieve a single market has been costing European industry millions in unnecessary costs and lost opportunities; that the completion of the Internal Market will provide the economic context for the regeneration of European industry in both goods and services; and that it will give a permanent boost to the prosperity of the people of Europe and indeed of the world as a whole” (Cecchini1988, xiii).
Aside from the official expressions of optimism on the Commission’s 1992 pro- gramme, there was not a broad consensus among policy makers or scholars on what would be the concrete benefits for all Member States and regions. As illustrated by
Has the Economic and Financial Crisis Reversed Regional Convergence… 9 the analyses contained in the Padoa-Schioppa (1987)1; Cecchini (1988) and Emerson (1990) reports, the expectation was that the realisation of the Single Market would have a negative impact on employment and competition and, espe- cially, on the prospects for development of the less developed and peripheral areas.
Much of the optimistic prediction on the overall impact of the Single Market generated by the official reports was based on classical general equilibrium theories, such as those developed by Solow (1956) that foresaw a gradual trickledown effect originating in the core areas and gradually extending itself to the peripheral regions.
However, since the mid-1950s there was an expanding body of literature based on centre-periphery theory (e.g. Myrdal 1957, Holland 1976) that produced much more pessimistic scenarios on the impact of integrating markets. The tenants of centre- periphery theory were negative in their predictions of the consequences for less developed areas produced by market integration.
Thus, the expectations associated with core-periphery theory were that the relative position of the periphery would erode over time to the benefit of the core areas. The basic theoretical foundation in predicting what would happen to under- developed areas in an integrating market were spelled out by Gunnar Myrdal in 1957 in his widely read Economic Theory and the Underdeveloped Regions. The con- cept of ‘backwash effects’ was further elaborated by Stuart Holland in 1976 and 1980. Based on this approach, a number of books appearing at the end of the 1970s and beginning of the 1980s – that is, at the time that Greece, Portugal and Spain were preparing to enter into the Community – warned of the dire consequences of further enlargement and greater economic integration for the new members from southern Europe. These scholars argued that further integration would prove to be funda- mentally damaging to the growth potentials of the peripheral economies (Seers, Schaffer and Kiljunen 1979, Williams 1984; Hudson – Lewis 1985, Hadjimichalis 1987). Italy’s Mezzogiorno regions were also added to the list of ‘net losers’ in the prospect of further European economic integration (Carello 1989).
The few dissenting voices to this cacophony of pessimism were provided by the authors of two empirical studies of how regional disparities had fared between 1950 and 1970 – that is, by Molle, van Holst and Smit (1980) and by Barrow and Sala-i- Martin (1991). Barro and Sala-i-Martin analyzed the empirical results over the period between 1970 and 1990, and therefore built upon the data previously analyzed by Molle et al. in their 1980 publication. The latter argued that the data for
1 See Annex E (p. 162
–
164) that reports an increased divergence of national GDP/p.c. scores in Europe after the impact of the initial 1973 oil crisis: The Report went on to state that “In the 1960s there was relative convergence in real GDP per capita between countries, but since the first energy crisis in 1973, this trend seems to have come to a stop and the gaps have been stabilized or slightly increased” (p. 162).10 Robert Leonardi the first nine Member States – the original six plus Denmark, Ireland and the UK – showed that the gap between rich and poor regions had not increased during the course of the reintegration of the European economies in the post-war period. In fact, the authors found that disparities had instead decreased in a consistent manner at both the national and regional levels:
“We have examined whether regions with similar growth rates also had other characteristics in common, such as their type of location within the EC. From the centre-periphery theory it might have been expected, for example, that integration would have the effect of making regions along the inner borders of the Community of the Six grow faster, and peripheral regions slower than average in the period 1960–70. The outcome of the analysis shows no such thing” (p. 161).2
In a similar manner the Barro and Sala-i-Martin study concerned itself with what happened in large, integrating economies – such as those in the U.S., Japan, and EC – in terms of trends in socio-economic convergence or divergence. Their findings were surprising to both the academic and policy making communities given that they went against the prevailing views on what was happening in terms of the direction taken by regional disparities. The authors concluded in their report to the Brookings Institution that between 1970 and 1990 regions in the EC had converged at a rate of approximately 2% per annum. The conclusions reached by Barro and Sala-i-Martin conflicted significantly with what was being written on the Commis- sion’s behalf in the Periodic Reports on the trend in regional disparities. The Third and Fourth Periodic Reports stated that: “As a result of the first oil shock and the major worldwide disequilibrium of the last fifteen years the process of real convergence was interrupted and partly reversed” (CEC 1987, p. 52) and “During the 1980s disparities in incomes per head in the Community increased slightly up to 1986, since when they have remained at around the same level” (CEC 1991, p. 11).
The implications of the results reported by the Periodic Reports were that the EC needed a regional policy capable of easing the pain of market integration and in slowing down the increase in disparities. Very little consideration was reflected in the Periodic Reports regarding the objective outlined in the Single European Act of reducing regional disparities over time. That shift in expectations had to wait until after 1993 when evidence began to accumulate that regional, socio-economic disparities were not increasing but rather decreasing under the combined impact of the Single Market and Cohesion Policy.3
2 In 2007 (p. 90) Molle reiterated his previous conclusion that “since the 1950s a continuous process of long-term convergence between the core and the periphery has taken place”.
3 See the Cohesion Reports produced by the Commission (i.e. 1996, 2001, 2004 and 2010). There is still a lot of debate on how much of the convergence process is fuelled by the Single Market and/or by the Cohesion Policy. With regard to the impact of EMU, Christodoulakis (2009) argues that regional divergences began to grow once again after the introduction of the Single Currency
Has the Economic and Financial Crisis Reversed Regional Convergence… 11 The Impact of EMU
EMU was the other policy that was supposed to underpin the success of the Single Market. Operating within a common currency, the uncertainties attached to individual national currencies and the free circulation of capital would be eliminated. Dyson (2002, 2006 and 2008) has argued that EMU has set out to institutionalise a paradigm of ‘sound money’ and finance, the retrenchment of welfare state provisions and the rejection of inflationary wage bargaining regimes.
The Commission (1996) argued that EMU would make the Single Market more effective by “constraints which now result from exchange rate risk and by generally increasing transparency and competition” (CEC 1996, p. 6). However, the exact impact of EMU on peripheral and core economies has been debated in the academic literature from the very beginning (Martin 2001). From 1999 to 2007 the main beneficiaries of the policy seemed to be the peripheral areas due to the stabilization effect of the fall of interest rates in the transition from traditionally weak national currencies to the euro (CEC 2008d). A telling example of this change was provided by Greece where the interest rate went from 7.7% for the drachma in 2000 to 4.3%
in 2001 when the country entered the euro (Featherstone 2008). The same trend had been witnessed in Spain and Italy during the previous decade (Quaglia – Furlong 2008). For the latter, the lower interest rates generated by membership in the euro significantly benefitted the country’s ability to finance its accumulated debt and keep its annual deficit under control (Nanetti 2010). For the four cohesion countries of the EU-15 and Italy the requirements for nominal convergence imposed by the Maastricht criteria had already begun to produce benefits in terms of reduced inflation and management of fiscal matters during the second half of the 1990s.
Aside from the nominal aspects of convergence in terms of inflation, interest rates, and deficit and debt levels, there was a real expectation that EMU would be- come a powerful instrument in producing real economic convergence. Expectations were that EMU would have a significant impact on levels of economic growth by eliminating the need to use devaluations to regain competitiveness and the intro- duction of other reforms. Frank Barry (2003) observed that during the run-up to EMU:
“Monetary and fiscal policies were reined in, competition policy strengthened, state ownership reduced and EU aid increased considerably. Substantial improve- ments in labour market performance were recorded in Ireland and Spain. Wage moderation was promoted in Ireland by the tax-cutting ‘social partnership’
agreements, and in Spain by the labour-market reforms of the 1994–97 period” (p.
910).
but does not argue that the growth in regional disparities is necessarily due to EMU. We will discuss further the impact of EMU at greater length below.
12 Robert Leonardi The association of EMU with the Stability and Growth Pact added increased credence to the new currency in becoming a stabilizing factor for the domestic economy in that national governments would be discouraged in succumbing to the lure of borrowing to pay for social welfare schemes or extensive infrastructure projects (Brunila et al. 2001, Grauwe 2005). Thus, EMU was expected to produce low inflation and low interest rates, exchange stability and sound public finances.
Three of the four expected results were achieved, but the fourth – sound public finances – did not materialise as expected.
EMU also worked to encourage increased flows of FDI to countries in the euro zone. The flow of FDI into the EU was initially associated with the creation of the Single Market at the beginning of the 1990s, and a decade latter it underwent another significant surge. Little attention was paid during the initial years of EMU to whether the FD flowing into the participating countries was funnelled into produc- tive sectors such as R&D and the construction of new facilities for the production of exportable goods or to finance the consumption of capital goods – e.g., for the pur- chase of second homes – that remained within the country. Ardy et al. (2003) reported that already in 2001 the deficit in the balance of payments for Ireland was 0.6% of GDP, for Spain 3.0%, for Greece 4.2% and for Portugal 9.6%, and they observed at the time that “whether this is a problem is a matter of argument” (p. 7).
At the beginning of the decade the most important considerations in underwriting the stability of the Euro were fiscal stability and capital flows. Oversight of the for- mer was allocated to the procedures foreseen in the Stability and Growth Pact (SGP).
In 2004 France and Germany overran the established deficit limits, but it was diffi- cult for the Member States to agree on a common approach to the issue. As a result, the March 2005 reform of the SGP introduced more flexible criteria for its enforce- ment (Chang 2009, Talani 2009, Farina – Tamborini 2007).
In the CEECs the prospect of adopting the euro has raised a number of con- siderations. For some the possible adoption of the euro will help the participating countries to reap the benefits of closer integration with other euro Member States in terms of gains from trade, growth, employment, and FDI flows, but it was argued that these gains would be made at the ‘cost’ of giving up the use of monetary policy as a stabilization instrument for the internal economy (Beblavy 2007, Dyson 2006).
The evidence cited confirms that the formation of EMU stimulated trade between its member states. Estimates of likely gains for growth of trade and incomes from joining the euro area differ from 85% of increase in trade (Rose 2002) to a more modest trade gain of 6–15% after five years of EMU (Faruqee 2004). Maliszewska (2005) finds that members of EMU trade on average between 6% and 26% more than otherwise would have been the case. Trade increases are presumably caused by lower transaction costs, greater competition and transparency of prices (Schadler 2005). Studies report that the adoption of the euro would add 0.6–0.9%
Has the Economic and Financial Crisis Reversed Regional Convergence… 13 to average GDP growth in Hungary for 20 years and about half this range for Poland (Schadler et al. 2005).
In addition to gains for trade and growth, the adoption of the euro by the CEECs would eliminateexchange rate risk. Rostowski (2005) points to higher exchange rate risks in CEECs as these countries have built up high current account deficits due to expectations of rapid economic growth.
Joining EMU would pose the challenge of the costs of meeting the Maastricht criteria and giving up the supposed shock-absorbing role of the exchange rate (Zubek 2006 and 2008, Greskovits 2006). Dabrowski (2005) argues that the costs of giving up sovereign monetary policy for small open economies are not large as discretionary currency devaluation aimed at boosting external competitiveness will most likely end with higher internal inflation that will eventually eat up the real effects of the nominal devaluation and, in the end, lower the credibility of the central bank. Empirical work presented in Schadler (2005) concludes that the largest share of shocks in the CEECs has been monetary or financial in origin; thus, losing the exchange rate instrument may not be particularly costly if other more efficient adjustment mechanisms are put into place.
Dabrowski (2005) concludes that EMU entry will likely accelerate the catch-up process for CEECs in the long run and help real convergence or economic cohesion.
The IMF study (Schadler et al. 2005, Schadler 2005) also suggests a positive balance in the adoption of the euro for the CEECs, provided that they adopt structural and fiscal policies strongly geared toward minimizing overall economic volatility.
The financial and economic crisis of 2008–2009 helped to expose some of the basic weaknesses of the SGP operating at the European level and the support mechanisms foreseen by the rules of EMU. First of all, the financial crisis emphasized the existing imbalance in two vital areas: (1) fiscal balance of Member States and (2) the balance in current accounts. The first was highlighted recently by the situation in Greece and the second by the most recent Irish crisis. However, an important element in highlighting both crises was the on-going financial difficulties of Member States on the periphery that, on the one hand, called into question the sustainability of their national fiscal policies and, on the other, placed into question their ability to respond to the lack of confidence in financial markets. The sovereign debt crisis affecting a number of EU and non-EU countries has helped to instil a ‘risk avoidance’
strategy among international investors that has already heavily compromised the economic and financial stability of the peripheral countries participating in EMU.
The reform of the SGP in 2005 (Farina – Tamborini 2007) to a certain extent allowed Greece to continue with ignoring the need to balance its budget. By 2010 this approach by the Greek government threatened to bring the country out of EMU and required a countervailing policy on the part of the EU for more stringent measures to monitor and react to fiscal imbalances (CEC 2010c), The EU also had to
14 Robert Leonardi put together rescue packages to buttress investor confidence in national govern- ment bonds. The first to bring attention to the potential role that could be played by the dual deficits (fiscal as well as current account) were authors, such as Blanchard (2006) and Arghyrou and Chortareas (2008), who studied the current account defi- cits that were afflicting the southern tier of EU Member States. However, the most detailed paper on the topic appeared in 2009 by Nikos Christodoulakis (2009) who reported increasing current account and trade deficits within the Euro area between
‘northern’ (e.g. Germany, Finland, Austria, etc.) vis-à-vis ‘southern’ (e.g. France, Italy, Spain, etc.). The author does not argue that the twin deficits originated from EMU, but he notes that the common currency, if anything, encouraged increased differen- tiation between the two groups of countries. What seems to be important in explaining these trends is the relationship between traded and non-traded goods that are attracting FDI into the country. In the former case, FDI expands traded out- puts, increases productivity, and improves competitiveness. In the latter, FDI flows into a non-traded domestic economy (i.e. housing) that reduces traded output and increases domestic demand. It is in this manner that property bubbles arise with a potentially devastating impact when they burst on the viability of banks and confi- dence in their ability to ensure deposits.
The impact that the Euro crisis has had on the growth prospects of Greece and Ireland (but also Portugal and Spain) has been dramatic. At the present time, both countries need to concentrate more on mending their fiscal policies rather than focussing on policies to promote growth. Greece, Ireland and Spain are expected to still remain in recession in 2013. The financial crisis in Portugal may also have the impact of leaving the country in recession and abandoning any growth-oriented internal macroeconomic policy. In other words, is it possible for the Member States hit by the sovereign debt crisis to keep paying double or triple the rate of interest on Euro bonds in comparison to other EMU countries and maintain a focus on the Lisbon objectives of increased growth and job creation?
The Contribution of Cohesion Policy
The results reported by studies in the abundant literature available on the impact of Cohesion Policy have varied a lot. Some have found evidence of the Cohesion Policy having a positive effect on economic growth; others have found no significant or even a negative impact. The results of the analysis do not necessarily vary with the data selected or the time period to be covered by the policy but rather with how one defines the policy. Does one include under the rubric of ‘cohesion policy’ [as is the case with Boldrin – Canova (2001)], the ‘regional policy’ of the EC from the creation of the ERDF in 1975 to the reform of the Structural Funds (1988) or the policy as implemented by the reform of the Structural Funds from 1989 onward? Given the
Has the Economic and Financial Crisis Reversed Regional Convergence… 15 difference in the operation of the Structural Funds during these two periods (i.e. pre- and post-1989), the emphasis on the pre-1989 analysis cannot be labelled as an evaluation of EU cohesion policy but rather of the early EC regional policy. Such a choice emphasises the fact that the Boldrin and Canova study is not a study of a pro- active policy but rather of a quite limited EC financial allocations to Member States for the purpose of financing a regional policy monopolised to a great extent by them, which used a quota system to allocate contributions, which lacked any specific programmatic approach and where no monitoring and evaluation of investments was ever undertaken. A second question is associated with the definition of
‘convergence’. The Single European Act that launched the Cohesion Policy spoke of
“the convergence of the less developed regions” toward the European average rather than the convergence of all regions (both wealthy and poor) toward a European or a national average. In studies that focus on the latter version of the definition, the analysis of convergence is carried out within Member States rather than within the EU. As we have seen in the literature cited above on convergence and divergence, most studies do conclude that disparities have decreased across Europe but in many cases they have increased within Member States (De la Fuente and Vives 1995, CEC 1999, Midelfart-Knarvik – Overman 2002, Monfort 2008, Farole et al. 2009).
Leonardi (1998: 165–172) was one of the first to point out that it is possible for initially poor countries, such as Ireland, to converge dramatically toward the EU average, while at the same time undergoing a significant intra-state divergence pro- cess as one or more regions (e.g. Dublin or Cork) develop dramatically and thereby outstrip the increases made by the other Irish regions vis-à-vis the European average. In other words, the Northern and Western regions in Ireland have not grown as fast as other Irish regions. Therefore, this has produced increased dis- parities within Ireland. The same has been the case in Portugal and Spain to say nothing of what has happened in the new Member States in the creation of the ‘do- nut’ phenomenon where national capitals have outstripped the rest of the country in the rate of growth and prosperity.
If, however, attention is paid to how the poorer regions and major beneficiaries of EU cohesion policy have performed vis-à-vis the European average the empirical evidence is clear: the convergence targeted by the SEA and cohesion policy has, in fact, taken place (Cappelen et al. 2003, Leonardi 2005, CEC 2009 and 2010).
The Sapir Report (2004) noted that one of the expectations associated with the original Single Market programme seems to have been confirmed: “European re- gions do appear to have become more specialized in the aftermath of economic integration, reflecting both their comparative advantages (especially in terms of the population’s skill endowment, a key regional characteristic in a low-mobility envi- ronment) and incipient agglomeration effects due to local economies of scale”. In
16 Robert Leonardi analyzing the six macro regions targeted by the cohesion policy – Greece, Ireland, Portugal, Spain, the Italian Mezzogiorno and the East German Laender – “the six macro-regions displayed annual growth of 3.3% between 1991 and 2000, while the rest of the EU produced annual growth of 1.9%”. Convergence was definitely taking place between member states but not necessarily within member states. The Sapir Report also produced interesting data with regard to the level of inequality across EU countries which fell by one-half between 1970 and 2000. However, inequalities within countries climbed back to where they were in 1970 by the late 1990s. Sapir concluded that “inequalities within countries seem to be directly linked to growth:
inequality is reduced during periods of high growth but remains stagnant during periods of sluggish growth.”
Ramajo et al. (2008) analysed the period 1981–1996. Their finding was that regions covered by the Cohesion Policy were converging faster than was the case with the regions in other Member States. Puigcerver-Peñalver (2007) analysed the impact of Structural Funds during two first programming periods (1989–1993 and 1994–1999), and his findings indicated that the positive impact of Structural Funds on growth was more significant during the first programming period than during the second. Beugelsdijk and Eijffinger (2005) investigated the effects of Structural Policy in 1995–2001. Their results suggested that more ‘corrupt’ countries gain as much economic growth from Structural Funds as others, so that countries with looser controls were not more ineffective in the use of funds than others.
According to Cappelenet al. (2003), the effect of EU regional support on economic growth is stronger in more developed regions, which indicates that receiving region’s responsiveness affects the impact of support. The results of Mohl and Hagen (2010) find exactly the opposite results. They suggest that the impact depends on the nature of the operational programmes on whether Structural Funds have had a significant impact on growth or not. They found along with Leonardi (2005) that payments in the Objective 1 regions have improved regional economic growth, but payments in Objective 2 and 3 regions have not had any appreciable effects on growth rates. This finding should not be surprising given the different levels of financing for Objective 1 versus non-Objective 1 regions. Leonardi (2005) found that from 1988 to 1999 the beta convergence rate in Objective 1 regions was 3.9% per annum while in non-Objective 1 regions it was 0.2%. Overall, the convergence rate for the 189 regions studied by Leonardi was 1.4%. In a previous study Armstrong and Taylor (2000) found that the general rate of convergence in Europe had been 1.5%.
Another finding discussed in the literature with regard to Cohesion Policy is that the impact of the policy on growth does not necessarily emerge immediately; it can take more than three years to appear. The expectation of immediate results and the growing economic and financial crisis have placed significant strain on regions and
Has the Economic and Financial Crisis Reversed Regional Convergence… 17 countries in maintaining the original focus of the policy on growth and employment.
According to Mancha-Navarro and Garrido-Yserte (2008), there is a risk that future cohesion policy will begin to diverge from its original objectives of restructuring un- derdeveloped economies due to the expansion of overall objectives as a result of the emphasis on the Lisbon and Gothenburg strategies. They suggest that since 2007 the main objective has become competitiveness rather than growth, given that the latter seems to be an automatic by-product of joining the EU and participating in the Single Market. According to this view, joining the EU has had the effect of reducing the ‘risk factor’ associated with doing business in Central and Eastern European countries, thereby increasing the inflow of foreign direct investment and speeding up privati- sation that has characterised the CEECs from the mid-1990s to the first part of the decade. As a result, it was felt that the Cohesion Policy in the CEECs could focus on other objectives – the environment and clean energy – given that economic growth and job creation were being delivered ‘automatically’ by market forces.
Martin and Tyler’s (2006) analysis of the impact of Structural Funds in the Objective 1 regions up to 2002 has shown that Structural Funds expenditures accounted for the creation of approximately one million new jobs. According to their analysis the major turnaround in the employment data took place in the 1994–1996 period when the Structural Funds expenditure become steady and sustained. Prior to that period, Objective 1 regions continued to shed employment. To a certain extent the data demonstrate that some of the predictions of job losses attributed to the rationalisation effect of the Single Market (Begg 1992) did take place in the immediate aftermath of the implementation of the policy but that the statistics quickly turned around as European and foreign capital was quickly attracted to the less developed areas and the Cohesion Policy began to make significant strides in the restructuring of the peripheral economies.
Cieślik and Rokicki (2009) studied the effect of Cohesion Policy programmes between 2004 and 2006 on income and employment in Poland as the country gained gradual access to Structural Funds during the transition. Their finding was that Structural Funds expenditures probably did not impact on economic growth in the most developed regions but did have an impact on the growth potential in less de- veloped regions. The other result was that in the short run Cohesion Policy appears to contribute to production and employment increases in the least developed versus the most developed regions. Cardenete and Lima (2005) investigated the impact of Structural Funds on Andalusia in Spain. Their results indicated that the funds did not significantly change the structure of the regional economy in Andalusia. A com- pletely different result was suggested by the SOCCOH Report (2008 Chapter 3 pp.
55–86) for the Spanish regions of Murcia and Galicia. In a similar manner, Yuill et al.
(2009) concluded that Cohesion Policy has improved significantly the relative posi- tion of Spain’s regions in general when set against other regions in Europe. In the
18 Robert Leonardi cases of Portugal and Greece (Konsolas et al. 2002) the results for selected regions were quite positive. After 2005 the national governments began to over-reach what was permissible on the basis of their economic base in terms of providing social sup- port for their citizens.
According to Ederveen et al. (2006), Structural Funds, as such, did not generally enhance economic growth in all Member States, but in countries with the right kind of institutions, rules and conditions Structural Funds did have an impact. Their conclusion is that Cohesion Policy is only conditionally effective in contributing to economic growth. Bradley and Untiedt (2008) do not agree with these results. On the contrary, their analysis indicates the opposite to be the case. They write that the recommendations of Ederveen et al. are unconsidered and off the mark.
Such contrasting conclusions are normal when it comes to the evaluation of Cohesion Policy. What is important to keep in mind in analyzing such studies is, first of all, the period of time that is covered and, second, the regions that are considered.
Given the constant expansion of the EU over the last fifteen years it is important that the analysis of disparities not fall prey to the incorporation of increasingly poorer countries and regions in the analysis without controlling for the comparison of the economic performance of the same countries and regions across time. The latest ex- post evaluation of Cohesion Policy Programmes 2000–2006 (CEC 2009 and 2010b) focused on Objective 1 and 2 regions and the ERDF interventions. The results indi- cate that the Cohesion Policy or Structural Funds interventions have positively influenced the socio-economic development of particularly Objective 1 regions.
Ramajoa et al. (2008) find that regions in the EU cohesion countries (i.e. Ireland, Greece, Portugal and Spain) receiving the largest amount of funding between 1989 and 2006 have converged separately – i.e. more significantly than the rest of the EU regions. Estimates indicate that in 1981–1996, there was a faster conditional con- vergence in terms of relative income levels of the regions belonging to these coun- tries (5.3%) than in the rest of the regions of the EU (3.3%). They conclude that these results support the idea of a positive effect of the EU cohesion policies in fostering economic growth and convergence in the poorest EU Member States. Similar results seemed to be taking place in the CEECs prior to the onslaught of the 2008–2009 financial and economic crisis that threw national budgets out of balance and dried up FDI flows.
Mohl and Hagen (2010) extend the empirical analysis of the impact of Cohesion Policy to 2000–2006. They find that Objective 1 payments promote regional eco- nomic growth, whereas for the other Objectives (i.e. 2 and 3) no positive and sig- nificant impact on the EU regional growth is found. The results are robust when controlling for spatial correlation. They also show that the growth impact does not appear immediately, but that it occurs with a time lag of approximately two to three years. The Fifth Cohesion Report (2010c p. 205) also provides empirical evidence of
Has the Economic and Financial Crisis Reversed Regional Convergence… 19 the higher growth rates among Objective 1 regions vis-à-vis non-Objective 1 regions during the 1995–2006 period.
The advantage of econometric evaluations is that they can be appraised with standard statistical criteria. Their drawback is that they cannot capture the interplay of effects which may be important for massive policy changes such as the Single Market. The net result is that it is not possible to establish conclusively what the relative performance of these regions would have been in the absence of EU cohe- sion and other EU policies (Sapir 2004). Attempts have however been made, such as Busillo et al. (2009) to test the effect of regional policy compared to a counterfactual’
situation in order to isolate the effects of the policy from the shadowing effect of other factors. They identify the presence of a, albeit slow, convergence process across EU regions in the last twenty years which they ascribe to the impact of Cohe- sion Policy.
The use of macroeconomic models allows for more interactions among endoge- nous variables, but neither the models nor their results can be judged as statistically satisfactory or consistent (Baldwin – Venables 1995). Bradley (2006) writes that the Hermin model demonstrates that the impacts of Structural Funds in isolation are modest due to the fact that their long term benefit depends on a country’s ability to respond to external opportunities arising in Europe and the rest of the world. Veld (2007) uses the QUEST II model to evaluate the potential impact of the Cohesion Policy programmes for the 2007–2013 Convergence objective. He finds that trans- fers have a positive impact on GDP, employment and productivity, but that the mag- nitude of the effect depends on the productivity assumption of interventions.
Further, the ex-ante impact analysis of Structural Funds produced by the Commis- sion (2007) is based on HERMIN2, EcoMod3 and QUEST models. The HERMIN2 model shows cohesion policy as having a significantly positive effect, with absolute GDP being 5 to 10% higher in most of the new Member States than would have been the case in the absence of intervention. EcoMod3 predicts significant positive effects of policy intervention in all 15 Cohesion countries, especially in the new Member States, where funding is relatively high. The boost to demand in the Cohesion coun- tries from spending from the Structural Funds predicted by the QUEST model is relatively modest. Substantial differences in the estimated impact of the Cohesion Policy between the models are due to different assumptions discussed in Bradley and Untiedt (2007).
According to recent estimates (Gakova et al. 2009), European Cohesion Policy is expected to create about 1.9 million additional jobs by 2015 in Cohesion countries, while average GDP gains are expected to range from 1% in Spain to around 3% in Poland, Slovakia and Romania and to more than 5% in the Baltic states. Allard et al.
(2008) find that new Member States stand to benefit greatly from the inflow of EU funds. These funds could boost GDP per capita by as much as 5 percentage points
20 Robert Leonardi between the years 2010 to 2020. However, the size of the benefits will depend on the right institutional and policy framework. The authors stress that the EU funds need to be directed predominantly to investment purposes rather than distributed evenly over the national territory.
Concern for economic cohesion has been a constant feature of the process of European integration. While the formation of the Single Market offered the promise of a significant increase in the output of the Community as a whole, the political viability of the project also required that the distribution of benefits be perceived as fair by the constituent states and regions (De la Fuente – Vives 1995).
Numerous studies do find both β-convergence and δ-convergence across Euro- pean countries4. However, most studies find a small convergence rate across EU countries (Eckey – Turk 2006). It should be noted that the results are not only sen- sitive on the choice of countries being considered and the level of NUTS regions employed, but convergence estimates are also sensitive to the choice of the addi- tional explanatory variables (Magrini 2004). While the four remaining regions of southern Italy have shown no recent signs of convergence, the other four southern Italian regions have exited from the Objective 1/Convergence objective (Leonardi 2005). Three (Abruzzo, Molise and Sardinia) have exited due to economic growth which has brought their GDP/p.c. scores above the 75% threshold while only one, Basilicata, has exited from the convergence criteria for 2007–2013 due to the statis- tical effect of the entry of ten new Member States after 2004.5 Spain, Portugal and Greece have grown faster than the EU average over a number of years, while Ireland and the East German länders have significantly driven the convergence trend in the EU during the last two decades. The impressive performance of Ireland is such that in only 15 years it has moved from the bottom group of the poorest four EU coun- tries to become one of the top four (in terms of GDP per capita). For Ireland it will important to see whether the country will be capable of holding on during the next few years to the development levels it achieved before the collapse of its banking sector.
At the same time that the above cited studies have discussed the ongoing process of convergence of the less developed regions toward the European average, there are still a number of studies (Farole 2009) that report the exact opposite or at least that divergence is taking place at least within Member States. The argument is that Member States with large metropolitan areas – usually the regions containing the national capital – are growing at a faster rate than the more peripheral areas. The argument goes that while the EU is experiencing a process of convergence across
4 See e.g. Eckey and Turk (2006), Monfort (2008) for a survey of the literature.
5 See Leonardi and Nanetti (2010) for a detailed analysis of the development of Basilicata from 1987–2007.
Has the Economic and Financial Crisis Reversed Regional Convergence… 21 countries, there is evidence of divergence across regions within individual countries (see e.g. De la Fuente – Vives 1995, Sapir 2004, Monfort 2008). Gianetti (2002) argues that the differences in the pattern of convergence and divergence across EU regions can be explained by the international knowledge spillovers. Stronger knowledge spillovers due to economic integration bring convergence across regions that can competitively produce the high-tech goods. On the other hand, disparities are amplified within countries where there are regions specialized in the traditional sectors that do not benefit from the exchange of knowledge.
What is the role of Cohesion policies in explaining these convergence patterns?
On the grounds of limited evidence of convergence the effectiveness of EU Cohesion Policy has been criticized by some (e.g. Eckey – Turk 2006) and supported by others (e.g. Batchler – Mendez 2007). Boldrin and Canova (2001) have argued that Euro- pean Structural Funds have had no observable impact on regional growth and eco- nomic convergence. In contrast to other scholars, they did not find any β-conver- gence and δ-convergence across NUTS-2 regions attributable to Cohesion Policy. As for convergence across countries (2003), they attribute the observed increases in growth in the CEECs to national policies and not to regional transfers. Here again, we can agree with them due to the fact that they were trying to measure the impact of the policy when the policy did not exist. Prior to 2004 the candidate states had access to limited pre-accession funds rather than the full budgetary allocation pro- vided after accession took place.
Turning to the effects of the various implementation areas of Cohesion Policy, Rodriguez-Pose and Fratesi (2004) assess the effect of the policy axes and find that despite the concentration of development funds on infrastructure and, to a lesser extent, on business support, the returns to commitments on these axes are not significant. Support to agriculture has short-term positive effects on growth, but these wane quickly. According to the authors, only investments in education and human capital – which represent about one-eighth of the total commitments – have medium-term positive and significant returns. Based on the empirical results they argue for the need to rethink the nature of regional policy, prioritise innovative and locally tailored investments, and improving the capabilities of local institutions in managing development strategies. Martin (1998) finds that transfers spent on infrastructure investment may increase aggregate attractiveness of a country but do not lead to convergence between regions in that same country. The strengthening of national infrastructure grids has invariably the tendency to favour the richest and more politically connected regions in the country, and it gives firms the incentive to locate near the largest market/s (the rich region). The proximity to larger markets enables the local firms to reap the benefits of increasing returns to scale in the larger market while facilitating sales to the poor regions. Fagerberg and Verspagen (1996) also find that EU investment support to poor, peripheral regions is inefficient. They
22 Robert Leonardi find that EU support for R&D and investment only impacts positively on growth in regions for which the rate of unemployment is below important threshold levels.
Midelfart-Knarvik and Overman (2002), in turn, find evidence of polarization i.e.
increased inequality between core and periphery at the regional level, but there is no evidence of polarization at the national level. Therefore, they conclude that structural spending is justifiable only at the regional level. However, their empirical analysis suggests that Structural Fund expenditures during the years 1989–1996 did not prevent regional polarization within Member States from taking place.
In addition to pure economic contributions, Bachtler and Taylor (2003) argue that the concept of added value is a key consideration in analyzing the contribution of Cohesion Policy spending. Added value is however a disputed concept, and Bachtler and Taylor suggest that it can be identified in the following areas; ‘cohesion added value’ – enabling additional economic activity to take place and becoming a catalyst for socio-economic regeneration; ‘political added value’ – making the EU more visible and generating greater support among citizens for the EU integration process; ‘policy added value’ – promoting the creation of a strategic dimension in regional development policy making (the existence of Cohesion Policy helps to promote a more integrated regional development process on the basis of a complete multi-sectoral and integrated approach); ‘operational added value’ – the creation of public-private partnerships in the delivery of the policy and the creation of a more transparent and coherent policy process; and finally ‘learning added value’ – learning is an integral part of structural fund programming from the beginning to the end and therefore the continuing policy process that characterizes Cohesion Policy creates the premise for learning new and more efficient approaches to the planning and implementation process.
The Cohesion Policy for 2014–2020
With the June 2013 agreement reached between the European Council and the European Parliament on the Multiannual Financial Framework (MFF) it will be possible to finalize in short order the Regulations providing the legal base for the Partnership Agreements between the Commission and the Member States and in formulating the operational programmes at the national and regional level. Unless it is changed during the subsequent months, the Regulation for the Cohesion Policy (Article 82) foresees the use of the regional level data in GDP/per capita expressed in for the years 2006–2008 to identify the regions qualifying for ‘convergence’ vis- à-vis those that will receive support for the ‘competitiveness/employment’
objectives. However, given that the new cycle of Cohesion Policy begins in 2014 and covers the seven years up to 2020, the economic status of many countries and regions has radically changed from the one reflected in the Commission’s projection
Has the Economic and Financial Crisis Reversed Regional Convergence… 23 on the basis of the 2006–2008 data. Therefore, is the Cohesion Policy ‘fit for purpose’? In order words, does it provide the basis for responding to the economic crisis, and can it really achieve the objectives outlined for the Policy in the Europe 2020 programme given that the situation has changed so radically in many regions and Member States?
The result of the analysis of the 2006–2008 data is presented in Figure 1. As is evident from the distinctions made in the Figure between ‘convergence’ and ‘non- convergence’ or competitiveness regions there has been a further reduction of regions covered by the convergence objective vis-à-vis those covered during the 2007–2013 period. We need to remember that 2006–2008 represented the culmi- nation and highest level of the convergence process that we have discussed above.
What the new data show is that the recession hit Europe hard in 2009and has con- tinued to hit Member States and regions hard also in 2010, 2011, 2012 and even in 2013.
Table 1 reports the GDP performance among the 27 Member States for from 2009 to 2012. During the first full year of the recession, 2009, there was a severe loss of GDP across the EU in both southern and eastern European countries. Growth returned positive in 2010 but weakened in 2011. In 2012 a number of countries fall back into recession. The most important examples of continued economic down- turns were registered in Greece, Spain, Portugal, Italy and Slovenia.
The question that needs to be posed is: whether the simulation carried out by the Commission fits any longer the empirical reality existing at the regional and national level across the EU? Some preliminary indications on the lack of congruence between the simulation carried out by the Commission on the basis of 2006–2008 data vis-à-vis the reality in 2009 and 2010 is already provided by the regional data provided by Eurostat for 2009 and 2010. Of particular concern are the data for all of Greece (Table 2) and for selected regions in Spain, Italy, Portugal and the UK (Table 3).
If we were to factor in the potential regional level data for 2011 we would find that almost all of the regions on our ‘critical list’ will have fallen back below the 75%
of the EU average and therefore qualify once again for the ‘convergence’ objective.
The issues highlighted by the data in Tables 2 and 3 point out the danger of basing a seven–year development policy on the basis of data that has been superseded by events and in not building into the policy the necessary corrective mechanisms necessary to respond to the current distortions present in the market. Among the major distortions that need to be corrected is the difficulty if accessing the credit market on the part of small and medium sized enterprises (SMEs) and in the attraction of the foreign investment that had flowed out of the peripheral economies during the height of the crisis.
24 Robert Leonardi
Figure 1. Eligibility simulation2014–2020 [GDP/head (PPS), index EU27=100]
Source: Cohesion Policy 2014–2020 – Investing in growth and jobs. Luxembourg, Publications Office of the European Union, 2011. doi:10.2776/43732
Has the Economic and Financial Crisis Reversed Regional Convergence… 25 Table 1. Change in GDP 2009–2012 in EU 27
Contry 2009 2010 2011 2012
EU 27 –4.3 2.1 1.6 –0.3
Belgium –2.8 2.4 1.8 –0.3
Czech Republic –4.5 2.5 1.9 –1.3
Denmark –5.7 1.6 1.1 –0.5
Germany –5.1 4.2 3.0 0.7
Estonia –14.1 3.3 8.3 3.2
Ireland –5.5 –0.8 1.4 0.9
Greece –3.1 –4.9 –7.1 –6.4
Spain –3.7 –0.3 0.4 –1.4
France –3.1 1.7 2.0 0.0
Italy –5.5 1.7 0.4 –2.4
Cyprus –1.9 1.3 0.5 –2.4
Latvia –17.7 –0.9 5.5 5.6
Lithuania –14.8 1.5 5.9 3.7
Luxembourg –4.1 2.9 1.7 0.3
Hungary –6.8 1.3 1.6 1.7
Malta –2.8 3.2 1.8 1.0
Netherlands –3.7 1.6 1.0 –1.0
Austria –2.1 2.1 2.7 0.8
Poland 1.6 3.9 4.5 1.9
Portugal –2.9 1.9 –1.6 –3.2
Romania –6.6 –1.1 2.2 0.7
Slovenia –7.8 1.2 0.6 –2.3
Slovakia –4.9 4.4 3.2 2.0
Finland –8.5 3.3 2.8 –0.2
Sweden –5.0 6.6 3.7 0.7
United Kingdom –4.0 1.8 1.0 0.3
Bulgaria –5.5 0.4 1.8 0.8
Source: Eurostat.
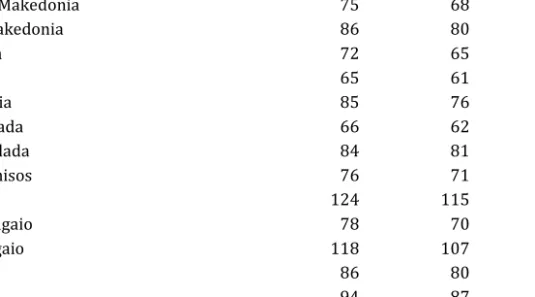
26 Robert Leonardi Table 2. Greek Regional GDP/PPS 2009–2010
Region 2009 2010 Difference
Anatoliki Mkedonia, Thraki 70 66 –4
Kentriki Makedonia 75 68 –7
Dytiki Makedonia 86 80 –8
Thessalia 72 65 –7
Ipeiros 65 61 –4
Ionia Nisia 85 76 –9
Dikiti Ellada 66 62 –4
Sterea Ellada 84 81 –3
Peloponnisos 76 71 –5
Attiki 124 115 –9
Voreio Aigaio 78 70 –8
Notio Aigaio 118 107 –9
Kriti 86 80 –6
Greece 94 87 –7
Table 3. Regions on the“Critical List” for 2011–2012: Spain, Italy, Portugal and the UK
2009 2010 2011
Spain 103 99
Castilla La Mancia 83 79
Andalucia 79 75
(Galicia 92 90)
Italy 104 103 100
Basilicata 74 70
Sardinia 80 78
Portugal 80 80 77
Azores 75 75
United Kingdom 111 111 109
Lincolnshire 78 78
Tees Valley and Durham 77 77
Convergence regions: >75%; Transition regions <75->90%
Has the Economic and Financial Crisis Reversed Regional Convergence… 27 What are the Potential Responses to the Current Impasse?
In the preparation for the initiation of the fifth cycle (2014–2020) of the Cohesion Policy there are a number of decisions that need to be taken and transformed into policy initiatives. The first is to take into considerations the change that have impacted the regional economies since 2008 through either a recalibration of the list of regions eligible for the convergence objective or the setting aside of special funds for those who have entered into crisis – i.e. fallen below the 75% GDP/p.c.
barrier as a result of the economic crisis. A step in this direction has already been taken through the creation of a third category of regions – ‘those in transition’ – whose GDP/p.c. falls between 75% and 90% of the EU average. The Cohesion Policy budget has already provided for financial support up to 75% of their 2007–2013 budget. In addition, extra funds should be provided for those regions where the GDP/p.c. falls below the 75% barrier in the three years prior to the initiation of the 2014–2020 Cohesion Policy.
A second need was identified clearly by the President of the Commission, Jose Manuel Baroso, in his speech to the European Parliament on the 12th of June 2013.
On that occasion Baroso spoke of the difficulties incurred by investors in the peripheral countries as a result of the differentiated interest rates being applied to loans in the peripheral vis-à-vis the core countries. Baroso stated that: “These spreads seem to relate less to the intrinsic credit quality of the borrower and more to their geographic location! This is an absurd situation in an economic and mone- tary union. SMEs are particularly affected by these constraints in the credit supply.”
Provisions need to be taken to lower the interest rates incurred by investors in the peripheral economies. Otherwise, the Cohesion Policy will not be in a position to leverage private initiatives in support of the development goals identified by the operational programmes, thereby blocking the generation of a multiplier effect that in the past has expanded the impact of public programmes and investments. Steps in this direction have been proposed through programmes supported by the Euro- pean Investment Bank through the creation of instruments for the sharing of private equity, risk-sharing, targeted investments, and the supply of credit by the EIB to SMEs undertaking investments as part of the Cohesion Policy.
A third provision that is under discussion is the ‘front-loading’ of the Cohesion Policy expenditures – in other words, taking special provisions to spend a larger proportion of the budget during the first three years – rather than gradually building up expenditures over the seven years as has been the case previously. The result was that the largest expenditures took place at the end of the Policy cycle. This change in orientation would provide a kick-start to the policy process and be in a position to mobilize an important part of the available resources at the beginning of the policy cycle rather than at the end. Accordingly, the implementation of the
28 Robert Leonardi Cohesion Policy could be in a position to accelerate the economic upturn that is expected in the post-2013 period.
A final point of concern is to provide a response to the deepening employment problem that has generally affected working people in the EU but especially youth unemployment (Table 4).
Table 4. Unemployment rate for youth under 25 years of age, 2007–2012
GEO/TIME 2012 2011 2010 2009 2008 2007
Austria 8,7 8,3 8,8 10,0 8,0 8,7
Belgium 19,8 18,7 22,4 21,9 18,0 18,8
Bulgaria 28,1 25,0 21,8 15,1 11,9 14,1
Cyprus 27,8 22,4 16,6 13,8 9,0 10,2
Czech Republic 19,5 18,1 18,3 16,6 9,9 10,7
Germany (until 1990 former
territory of the FRG) 8,1 8,6 9,9 11,2 10,6 11,9
Denmark 14,1 14,2 14,0 11,8 8,0 7,5
Estonia 20,9 22,3 32,9 27,5 12,1 10,1
Greece 55,3 44,4 32,9 25,8 22,1 22,9
Spain 53,2 46,4 41,6 37,8 24,6 18,2
European Union (27 countries) 22,8 21,4 21,1 20,1 15,8 15,7
Finland 19,0 20,1 21,4 21,5 16,5 16,5
France 24,3 22,8 23,6 24,0 19,3 19,8
Croatia 43,0 36,1 32,6 25,1 21,9 24,0
Hungary 28,1 26,1 26,6 26,5 19,9 18,1
Ireland 30,4 29,1 27,6 24,0 13,3 9,1
Italy 35,3 29,1 27,8 25,4 21,3 20,3
Lithuania 26,4 32,2 35,3 29,0 12,2 6,8
Luxembourg 18,1 16,4 15,8 16,5 17,3 15,6
Latvia 28,4 31,0 37,2 36,2 14,5 11,9
Malta 14,2 13,8 13,1 14,4 12,2 13,9
Netherlands 9,5 7,6 8,7 7,7 6,3 7,0
Poland 26,5 25,8 23,7 20,6 17,2 21,6
Portugal 37,7 30,1 27,7 24,8 20,2 20,4
Romania 22,7 23,7 22,1 20,8 18,6 20,1
Sweden 23,7 22,8 24,8 25,0 20,2 19,2
Slovenia 20,6 15,7 14,7 13,6 10,4 10,1
Slovakia 34,0 33,5 33,9 27,6 19,3 20,6
United Kingdom 21,0 21,1 19,6 19,1 15,0 14,3
Source: Eurostat.
![Figure 1. Eligibility simulation2014–2020 [GDP/head (PPS), index EU27=100]](https://thumb-eu.123doks.com/thumbv2/9dokorg/834450.43043/25.892.179.711.173.760/figure-eligibility-simulation-gdp-head-pps-index-eu.webp)