NMR-based metabonomics in experimental exocrine pancreatitis
Theses of doctoral (PhD) dissertation
Eszter Bohus
Semmelweis University
Doctoral School of Pharmaceutical and Pharmacological Sciences
Supervisor: Prof. Dr. Béla Noszál, D. Sc.
Opponents: Dr. Attila Ambrus, Ph. D.
Dr. Zoltán Berente, Ph. D.
Head of examination committee: Prof. Dr. György Bagdy, D. Sc.
Szigorlati bizottság tagjai: Dr. Miklós Idei, D. Sc.
Prof. Dr. Gábor Tóth, D. Sc.
Semmelweis University, Department of Pharmaceutical Chemistry
Budapest, 2011
1. Introduction
1.1. Metabonomics
Metabonomics, a member of the „omics” or ’systems biology’ branch of biomolecular research fields focuses on perturbation patterns in concentrations of low molecular weight chemical entities that are intermediates or products of metabolism in biofluids or tissues.
Main analytical platforms employed for data collection are typically NMR spectroscopy or chromatography coupled mass spectrometry, and multivariate statistics and pattern recognition tools are utilized for analysis of the complex spectral data sets obtained. Since its born in the early-1980s metabonomics found application in drug toxicity screening, disease diagnostics, functional genomics, nutritional sciences, individualized and population healthcare etc., but also extensively employed in areas as diverse as plant or environmental sciences.
1.2. COMET studies
One of the first major projects where potentials of metabonomics were comprehensively explored was a broad toxicity screening program, the COMET project. The Consortium for Metabonomic Toxicology (COMET) was formed between six major pharmaceutical companies and Imperial Collage in 1999. The main objective was to develop a predictive expert system based on metabonomic and conventional investigations for the detection of toxic side- effects of candidate drug molecules at the earliest possible stage of development, the preclinical animal studies.
147 model toxins with known toxic effects and more or less understood mechanism of toxicity were investigated first in order to get reference points for the expert system. Special emphasis was put on hepato and renal toxins because these organs are the most frequent targets of drug side effects, but toxins for pancreas, bladder or general physiological stressors can also be found in the list. All studies followed a carefully standardised experimental design in order to keep unwanted biological variation to a minimum.
2. Objectives
2.1. Investigation of exocrine pancreatic toxins in the COMET project
The time-related metabolic responses to L-arginine and 1-cyano-2-hydroxy-3- butene (CHB, crambene) model exocrine pancreatic toxins were investigated over a 7 day experimental period in male Sprague-Dawley rats.
Sequential timed urine and plasma samples were analysed using high resolution
1H NMR spectroscopy together with complementary clinical chemistry assays and terminal histopathology.
Special focus was put on:
- providing detailed metabolic reports on specific and general consequences of administration of the model toxins
- integrated biological interpretation of the results deriving from histology, clinical chemistry and metabonomic analysis
- exploring specific mechanistic information, extraction and identification of candidate biomarkers
- characterization of main metabolites of the parent compound and considering their potential roles in toxicity
- exploring diversity of responses to treatment in experimental animals - considering the applicability of the model to investigate human disease
2.2. Validation of Cluster Analysis Statistical Spectroscopy (CLASSY).
The aim of this work was to develop a new method for data analysis, information recovery, and display of biological 1H NMR spectral data. Special emphasis was put on presenting spectral information in a novel graphical format to increase throughput of data analysis and aid visualization of dynamic temporal variation in metabolite concentrations to increase interpretability of the results.
3. Methods
3.1. Experimental design
Animals, dosing and sample handling. Male Sprague-Dawley rats were randomly selected to three dose groups as control (C), low dose (LD) and high dose (HD), and received a single 10 ml/kg injection as indicated in table 1.
Toxin L-arginine CHB (crambene)
Dosing Intraperitoneal subcutan
Dose group HD LD C HD LD C
Number of
animals 20 10 10 10 10 10
Dose (mg/kg) 4000 1000 Vehic. 150 15 Vehic.
In all dose groups, half of the animals were euthanized 48 h after dosing and the remaining animals at 168 h after dosing. Urine samples were collected 16 h predose and then continuously fractioned at 0, 8, 24, 48, 72, 96, 120, 144, and 168 h post dosing. Serum was isolated from blood samples collected at necropsy. Liver, kidney and pancreas tissue samples for histology were also obtained from each animal.
Clinical chemistry and histopathology analysis. Serum was analyzed for creatinine, urea nitrogen, ALT, AST, ALP, glucose, sodium, potassium, calcium, phosphorus, albumin, total protein, and total bilirubin. Urine parameters collected included total volume, osmolality, pH, protein and glucose concentration. Histological samples were fixed in 10% buffered formalin, embedded in paraffin, sectioned, and stained with hematoxylin and eosin.
1D NMR spectroscopic analysis. Urine samples were prepared for 1H NMR spectroscopy by mixing 400 µL urine with 200 µL of sodium phosphate buffer containing D2O and TSP. 1H NMR spectra were acquired at 600 MHz with suppression of the water resonance using a standard presaturation pulse sequence (90°- 3 µs - 90° - 100 ms - 90°- acquire). Serum samples were thawed, vortexed, and allowed to stand for 10 min. 200 µL aliquots were mixed with 400 µL saline containing 20% D2O, then samples were spun at 10000 rpm for 10 min. and 500 µL of supernatant were placed in NMR tubes for analysis.
NMR spectra were acquired using the Carr-Purcell-Meiboom-Gill spin-echo pulse sequence with a fixed total spin-spin relaxation delay, 2nτ, of 64 ms (n = 80 / loops, τ = 400 µs).
3.2. Statistical analysis of NMR spectra
Full-resolution NMR data were imported into MATLAB (R2006b, and R2008a), and regions corresponding to water/HDO (δ 4.7-4.9), TSP (δ -0.2 to 0.2) and urea (δ 5.6-6) were removed. Spectra were normalized using probabilistic quotient normalization and aligned by a recursive segment-wise peak alignment (RSPA) algorithm. An additional set of data was also generated with the signals of the parent compound and its metabolites excluded, and subsequently normalized to total spectral area.
Orthogonal projection on latent structure discriminant analysis. (O-PLS- DA) O-PLS-DA is a supervised pattern recognition algorithm that filters variation which is orthogonal and hence unrelated to sample classification. As metabolic information that is not correlated to the pre-defined classes is removed, the predictive ability and interpretability of the models improve. The O-PLS-DA loadings that provide information on which NMR signals are discriminatory and responsible for clustering are further computed and then plotted as a function of their related chemical shifts but with a colour code indicating the weights of the discriminatory variables. A 7-fold cross validation method was used to check model validity.
Statistical Total Correlation Spectroscopy (STOCSY). STOCSY is based on analysis of co-linearity of peak intensities in a set of spectra and takes advantage of the large number of samples available. The one-dimensional application computes the correlation between one selected datapoint and all other datapoints in the spectra. Subsequently a spectrum of a sample is plotted, but with a colour code corresponding to the correlation found between the peak of choice and each datapoint. As the selected peak has the highest correlation to peaks belonging to the same molecule a 1D NMR spectrum of the component of interest will be highlighted in the plot. The combination of STOCSY with O- PLS provides further information on biochemical pathway connectivities.
Principal component analysis (PCA). NMR spectra were bucketed into 0,04 ppm regions with the water/HDO (δ 4.7-4.9), TSP (δ -0.2 to 0.2), urea (δ 5.6-6) and parent compound resonances removed. PCA is an unsupervised pattern recognition method, which summarizes the variation in the data into a smaller number of latent components. The principal components are visualized in two- or three-dimensional scores plots which shows clustering of observations based on similarities of their spectral profiles. A loadings plot provides information on the spectral variables responsible for separation/clustering seen in the scores plot. A trajectory plot is computed for the mean PC scores of the control, LD, and HD animals across the time course of the study.
3.3. Cluster Analysis Statistical Spectroscopy (CLASSY)
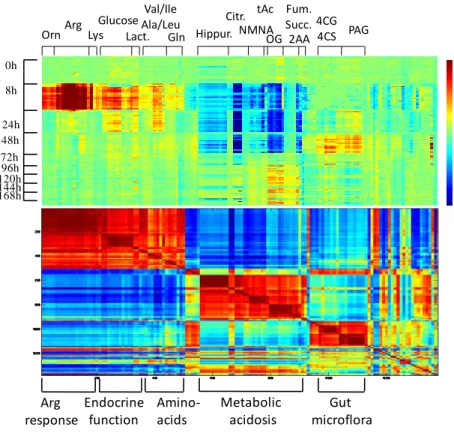
CLASSY profiles quantitative and qualitative changes in biofluid composition by utilizing a novel local-global correlation clustering scheme to identify structurally related spectral peaks and arrange metabolites by similarity of temporal dynamic variation. The mathematical background was developed by Steven L. Robinette and Kirill A. Veselkov. Local structural correlation clusters are identified by using the DemixC algorithm, which in this application takes as an input a binary matrix of peak connectivities. Global (pathway) correlations between all local clusters are then identified by a hierarchical clustering algorithm. Metabolic perturbation profiles are visualized in colour coded heatmaps, where peak fold-change intensities relative to the control are plotted by spectrum.
4. Results
4.1. L-arginine induced exocrine pancreatitis
Low dose animals showed marked uniformity in the outcome determined by histopathology, clinical chemistry and NMR spectral profiles, whilst in the high dose class two animals died 24 hours after dosing (subgroup of strong
responders) and three animals showed marked resistance to arginine toxicity (subgroup of weak responders ). Clinical chemistry, serum and urine spectra of the two subgroups were handled separately from the rest of the HD group, and normal responders (n=15) will be referred to as the HD group in general in the following sections.
Histopathology. Kidney, liver and pancreatic tissues of the LD class animals showed normal cellular structure. 48 hours post arginine administration many of the HD class animals had marked or severe loss of zymogen granules, moderate to marked acinar atrophy, moderate to marked interstitial edema, and moderate to marked inflammation in pancreas tissues. By 168 hours, the major pancreatic changes were severe atrophy, nearly complete loss of zymogen granules, and the beginning of acinar regeneration.
Clinical chemistry and weight data. The pancreas:brain weight ratio increased for the HD animals at 48h but significant reduction was observed at 168 h corresponding to initial tissue edema followed by atrophy of the necrotic tissue. Arginine salt administration resulted in dose-dependent metabolic acidosis with urinary pH reaching the most acidic values (pH=5.5-6.0) at 24 and 48 h in the HD group. Further observations for the HD class animals: a) elevated protein elimination at 24 and 48 hours which had decreased and
remained lower than control throughout the entire course of the study. b) elevated urinary glucose concentration between 8 and 72 h. c) elevated serum amylase at 24 hours post dosing, which had returned to normal levels at 48 h. d) elevated serum urea nitrogen (BUN) levels 24 h after administration indicative of the direct impact arginine had on the urea cycle. BUN returned back to control levels by 48 h and reduced further by 168 h, which together with low serum protein content at 168 h might be a general consequence of impaired protein digestion.
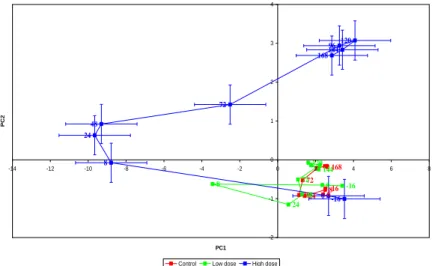
NMR spectroscopic data analysis. The time course and correlation pattern of changes in metabolic profiles of the HD class urine samples indicated that the pathological process involved five major events (figure 1. and 3.): a) direct response to high quantity of L-arginine entering circulation with increased urea-cycle and transamination activity (elevated arginine, ornitine citrulline, lysine, glutamine, glutamate), b) perturbed amino acid catabolism with many of the amino acids excreted directly to urine (elevated valin, leucine, isoleucine, alanine) c) mild and temporal endocrine toxicity (elevated glucose and lactate), d) metabolic acidosis (reduction in concentrations of TCA intermediates), e) and perturbed gut microbial function (elevated phenyacetylglycine and cresol- metabolites in urine). The effect of L-arginine on urinary profiles was dose- dependent, as LD class samples showed discriminating features of a) and d) only and animals regained homeostatic balance by 24 h (figure 1.). Weak responders eliminated unmetabolised arginine with a prolonged excretion profile, and had proportionally lower concentrations of ornitine in urine. Their resistance to arginine-toxicity might therefore at least in part be due to low arginase enzyme activity.
Metabonomic investigation of L-arginine induced pancreatitis has highlighted some of the limitations and advantages of this animal model. It involves little secondary target organ toxicity, but due to arginine playing a central role in fundamental endogenous pathways these are also perturbed at early stage of intoxication. The generalized metabolic acidosis might be the major source of relatively high mortality in these studies. On the other hand the metabolic effects extend to the microbiome activity as it does in man and thus the arginine-model simulates microbiotal activity disruption and regeneration providing a useful model for investigating human pancreatitis.
168 72 4824 8
0-16 144 120 72
48 24
8 0 -16
168144 96120
72 48
24
0 -16 8
-2 -1 0 1 2 3 4
-14 -12 -10 -8 -6 -4 -2 0 2 4 6 8
PC1
PC2
Control Low dose High dose
Figure 1. PC1 vs PC2 scores trajectory plot in the L-arginine study showing the mean points of the control, low dose (LD) and high dose (HD) urinary NMR spectra across the time course from pre-dose to 168h post-dosing. Both LD and HD animals moved away from the control space in the same trajectory direction, with the LD group returning to the control space by 24 hours indicating functional recovery. The HD group, however, entered several other regions of metabolic space due to perturbation in fundamental endogenous biochemical pathways, gut microbial function, and due to compromised pancreatic function. This trajectory remained “open”, indicating that functional recovery was not achieved during the course of this study but it also indicated a stabilized state at late time points.
4.2. 1-cyano-2-hydroxy-3-butene induced exocrine pancreatitis
Histopathology: Changes observed in the exocrine pancreas were consistent with the known effects of CHB in the HD class: mild to moderate diffuse atrophy of the acinar cells at 48 hours, together with mild apoptosis. Moderate to marked depletion of zymogen granules in the remaining acinar cells, interstitial edema and mild pancreatic inflammation could also be seen. Overt cellular necrosis was only observed in one animal and was mild. At 168 h all of the HD class animals had severe, diffuse athrophy of the acinar cells, marked to severe zymogen granule depletion, and mild fibrosis.
Clinical chemistry and weight data. Body weight loss was 17% at 48 h and 18% at 168 h in the HD group compared to controls. The pancreas: brain weight ratio increased at 48 h (interstitial edema) and reduced at 168 h (atrophy). All of the HD animals sampled at 168 h after dosing had markedly distended intestines that contained nearly undigested feed material. Further observations for the HD class: urinary pH was slightly acidic in the first 24 hours only; urinary glucose concentration was highly elevated (but variable) 8h after administration, returning back to normal by 48 h, suggesting a transient effect on insulin secretion and hence some secondary endocrine toxicity. Serum amylase level was elevated at 24 h compared to control, but the difference was not statistically significant and biologically meaningful.
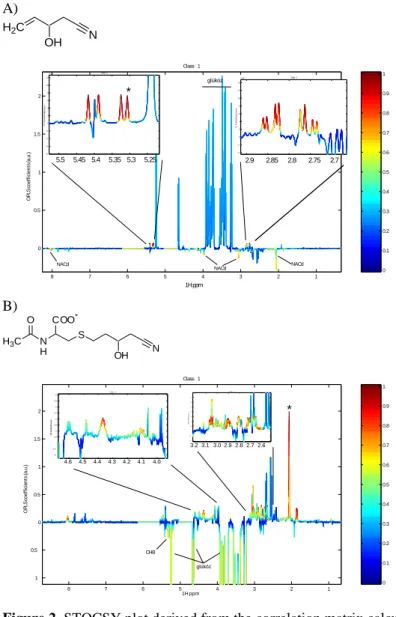
NMR spectroscopic data analysis. STOCSY analysis of CHB metabolites in the NMR spectra of treated animal urines suggested that the parent compound, one major and two minor metabolites appear in the urines at significant levels.
Based on the chemical shift and coupling patterns the CHB and the major metabolite, an N-acetyl-cysteine conjugate of the saturated CHB derivative could be identified (figure 2.).
Body weight data of HD class animals indicated an initial anorexic reaction to treatment followed by impaired digestion due to pancreatic damage, therefore some of the metabolic changes seen in the urine (reduced levels of citrate, 2- oxoglutarate, succinate, fumarate, trans-aconitate, and N-methyl-nicotinic acid) are likely to be related to dietary restriction and convolved with the effects of pancreatic injury. Contrary to the observations in the L-arginie study the urinary metabolite profiles of CHB treated animals did not indicate the possibility for any extensive microbiotal activity disruptions. The consistent elevation of 2’-deoxycytidin, however, might be a marker of mechanism of toxicity.
A)
H2C
OH N
1 2 3 4 5 6 7 8 0 0.5 1 1.5 2
OPLScoefficients (a.u.)
Class 1
0 0.1 0.2 0.3 0.4 0.5 0.6 0.7 0.8 0.9 1
NACd NACd NACd
5.25 5.3 5.35 5.4 5.45 5.5
8 6 4 2 0 2 4 6 8 10 12 x 109
OPLScoefficients (a.u.)
Class 1
*
2.7 2.75 2.8 2.85 2.9
4 2 0 2 4 6 8 10 12 14 x 109
OPLScoefficients (a.u.)
Class 1
glükóz
1H ppm
B)
S
OH N N
H COO- H3C
O
1 2 3 4 5 6 7 8 1 0.5 0 0.5 1 1.5 2
OPLScoefficients (a.u.)
Class 1
0 0.1 0.2 0.3 0.4 0.5 0.6 0.7 0.8 0.9 1
glükóz CHB
1H ppm
*
2.6 2.7 2.8 2.9 3.0 3.1 3.2
0.2 0.1 0 0.1 0.2 0.3 0.4 0.5 0.6 0.7
OPLScoefficients (a.u.)
Class1
4.0 4.1 4.2 4.3 4.4 4.5 4.6
0.1 0.05 0 0.05 0.1 0.15 0.2 0.25 0.3 0.35 0.4
OPLScoefficients (a.u.)
Class 1
Figure 2. STOCSY plot derived from the correlation matrix calculated between the data point maxima of A) the 1-cyano-2-hydroxy-3-butene resonance at δ 5.32 (*) B) N-acetyl-cysteine conjugate resonance at δ 2.07 (*) and all other spectral data points for 1D NMR spectra of the high-dose class urine samples acquired at 8 h post-dosing (n=10).
4.3. Validation of Cluster Analysis Statistical Spectroscopy (CLASSY).
CLASSY provides significant advantages in biological information recovery in terms of increased throughput, interpretability and robustness. It can effectively identify metabolites with role in the response to treatment, and aids elucidation of their chemical structures. Efficiently deconvolutes biochemical and physiological relationships of metabolites in complex disease processes. The novel graphical format increases throughput of data analysis as validity of control can easily be tested, dose dependency can be checked, and all temporal metabolic fluctuations are readily displayed. Variability in individual responses to treatment is also visualized and outliers or subgroups of responders can readily be detected.
The CLASSY figures are directly interpretable without preliminary experience in NMR spectroscopy or multivariate statistical methods, therefore ideal to make metabonomic studies more accessible to a wider research audience (figure 3.).
Lys
Arg response
Endocrine function
Amino- acids
Metabolic acidosis
Gut microflora Orn
Citr. tAc
4CG 4CS Lact. Gln
GlucoseVal/Ile Ala/Leu
Hippur. NMNA Fum.
Succ. PAG
Arg
2AA OG
144h120h 168h 0h 8h
48h 72h 96h 24h
Figure 3. CLASSY figures of the L-arginine dataset based on 1H NMR spectra of urine samples. Above is the fold-change heat map of HD class animals representing metabolic profiles relative to control levels through the experimental time-course. Below is the plot of clustered correlations revealing local clusters of structurally connected peaks and global clusters of coregulated metabolites. Key: Orn, ornithine; Arg, arginine; Lys, lysine; Lact, lactate; Val, valine; Ile, isoleucine; Leu; leucine; Ala, alanine; Gln, glutamine; Hippur, hippurate; Citr, citrate; NMNA, N-methyl-nicotinate; tAc, trans-aconitate; OG, 2-oxoglutarate; Fum, fumarate; Succ, succinate; 2AA, 2-aminoadipate; 4-CG, 4-cresol-glucuronide; 4-CS, 4-cresol-sulfate; PAG, phenylacetylglycine.
5. References
Bohus E, Coen M, Keun HC, Ebbels TMD, Beckonert O, Lindon JC, Holmes EC, Noszal B, Nicholson JK. Temporal Metabonomic Modeling of L-Arginine- Induced Exocrine Pancreatitis. Journal of Proteome Research 2008; 7(10): pp.
4435-4445.
Bohus E, Racz A, Noszal B, Coen M, Beckonert O, Keun HC, Ebbels TMD, Cantor GH, Wijsman JA, Holmes EC, Lindon JC, Nicholson JK. Metabonomic investigations into the global biochemical sequelae of exposure to the pancreatic toxin 1-cyano-2-hydroxy-3-butene in the rat. Magnetic resonance in chemistry 2009; 47 Suppl 1: pp. S26-35.
Robinette SL, Veselkov KA, Bohus E, Coen M, Keun HC, Ebbels TMD, Beckonert O, Holmes EC, Lindon JC, Nicholson JK. Cluster analysis statistical spectroscopy using nuclear magnetic resonance generated metabolic data sets from perturbed biological systems. Analytical Chemistry 2009; 81(16): pp.
6581-6589.