ContentslistsavailableatScienceDirect
Simulation Modelling Practice and Theory
journalhomepage:www.elsevier.com/locate/simpat
Serviceability of large-Scale systems
Zsolt T. Kosztyán
University of Pannonia, Department of Quantitative Methods, Hungary
a rt i c l e i n f o
Article history:
Received 22 November 2017 Revised 5 March 2018 Accepted 7 March 2018 Available online 10 March 2018 Keywords:
Network science System reliability Serviceability
a b s t ra c t
Oneofthemostimportantresearchfieldsofnetworksciencesistherobustnessofnet- works.Arecentlyansweredimportantquestionwasthefollowing:Whichnetworktopolo- giesaremoreresistanttorandommalfunctionsand/ordirectattacks?Nevertheless,until now,“whichsystemtopologycanbemaintainedandhowtomanagemaintenancemore efficiently and effectively” have been openquestions. However, thesequestionsare the keysbothtodesigninglarge-scalesystemsandtoschedulingmaintenancetasks.Thispa- perproposesanewmeanstoanalyzethemaintainabilityofalargesystembycombining twokindsofnetworks,i.e., thereliabilitydiagramofthesystem(1)and thenetworkof scheduledmaintenancetasks(2).Thispapershowshowtoassignmaintenancetask(s)to asystemcomponenttoincreasethereliabilityofthesystem.Withtheproposedmethod, themaintainabilityoflarge-scalesystemscanbeanalyzed.
© 2018TheAuthor.PublishedbyElsevierB.V.
ThisisanopenaccessarticleundertheCCBYlicense.
(http://creativecommons.org/licenses/by/4.0/)
1. Introduction
Therobustnessandresistanceofnetworksarewidelystudiedinnetworkscience(see[1]foranexcellentreview).Schol- ars showedthat so-calledsmall-world1 (hereinafterSW,e.g., (electrical) powergrids, see [3]) andscale-free (SF, e.g.,the Internetandsocialnetworks,see[4])networksaremoreresistanttorandomfailuresthanrandomnetworks[4,5].
SW andSF networkshave commonfeatures (see [6]for a great synthesis).These networks can be measured by the averageshortestpathlength,asthesenetworksallowlimitingthenumberofstops(intermediatenodes)betweentwogiven nodes,onaverage.Inaddition,thesenetworkscontainmanyhubs(bridgenodes)[7].However,SWandSFnetworkscontain only afew large degreenodes (hubs,inthis study,powerplants);therefore,thesenetworks (similartopower grids)are slightlyresistanttodirectattacks[8].The distributiondegreeoftheSF and,usually,SWnetworksfollowsapowerlaw,at leastasymptotically.Thatis,thefractionP(k)ofnodesinthenetworkhavingkconnectionstoothernodesobeysP(k)∼k−γ, where
γ
isaparameterthatistypicallyintherangeof[2,3]forSFnetworks,althoughitmayoccasionallylieoutsidethese bounds.Thestructureofthepowergridcanbecharacterizedusuallyasaplanarnetwork(meaningedgesdonotcrosseach other). Thisnetwork is an SF network instead ofan SWnetwork; however,the degree of distribution can also followa power function, andthe typical parameterγ
∈[1, 2]. A planar network is more physicallyconstrained andthus ismore assortative,withahigherprobabilityofcontaininga giantcomponent(i.e.,aconnectedsubgraphcontaininga majorityof thenodes)[7].SimilartotheSFnetworks,thesenetworksarealsolessvulnerabletorandomfailuresthanrandomnetworks andslightlymoreresistanttoadirectattackthanSFnetworks[9].E-mail addresses: kzst@gtk.uni-pannon.hu , kzst@vision.vein.hu
1SW networks exhibit a small average path length between pairs of nodes. For an excellent classification of small-world networks, see Amaral et al. [2] .
https://doi.org/10.1016/j.simpat.2018.03.002
1569-190X/© 2018 The Author. Published by Elsevier B.V. This is an open access article under the CC BY license.
( http://creativecommons.org/licenses/by/4.0/ )
ononestructure), weneed multi-structuralthinking. Inadditiontonetworktopology,we shouldfocusonthe interaction betweenstructures.Inmaintenancemanagement,weneedatleasttwodifferentkindsofstructures(seeFig.1),whichare variouslyorganized.
1.Thereliabilityblockdiagram(RBD)3 ofaproductionsystemcanbedescribedasasimpleso-calledserial/parallel(here- inafterS/P)network[15],whileapowergrid,theInternetandacommunicationnetworkcanfollowascale-free(SF),a small-world(SW)orothernetworks[5].
2.Small-tolarge-scaleplanscanbecharacterizedastheso-calledrandomnetworks.4
Inamaintenanceplanforall(parts)ofsystemcomponents,weassignatleastoneso-calledcorrective/preventivemain- tenancetask(seeFig.1).Ifthesemaintenanceactivitiesarecompleted,thereliabilityoravailabilityofthemaintainedequip- mentwillbeincreased.Therefore,thesestructureelementsimpacteachother.
Theotherchallengeofusingnetworksinmaintenance managementisthatthemaintenanceplansshouldbecharacter- izedasaflexiblelogicplan(asin[17]).Completingallpossiblemaintenanceactivitieshasrarelyoccurred.Instead,thetask istoselectadequate maintenancetasks toimprovesystemreliabilityand/or systemavailabilitywhilemaintainingbudget anddeadlines.
Amaintenance taskcan be completed by different means, the so-calledcompletion mode. Generally, we can assume thata lowertaskdurationrequires highercost, andhighergrowthofcomponentreliabilitytakesmoretime. Ifthesetof activitiesisfixed, thisproblemisadiscrete versionofatime-quality-costtrade-off problem,wherethequality parameter is the growth of component reliability. The discrete version of the time-cost trade-off problem is currently an NP-hard problem[18];however,inthiscase,thereareadditionalquality(i.e.,growthofcomponentreliability)parametersassigned tomaintenancetasks.Moreover,theproblemisfurthercomplicatedbyaddressingflexibledependenciesanduncertaintask occurrences.Since[19]’salgorithmcanaddressmaintenanceplans,thismethodcanonlybeusedformaintainingproduction systems,whichcanbecharacterizedasserial-parallelnetworks.
Inthispaper,weextendthisalgorithmtoanalyzethemaintainabilityoflarge-scalesystemsandsupportdecision-makers infindingthemostadequatemulti-structure.
2. Analyzingtheserviceabilityofthesystem
Inthispaper,wefocusedontheserviceabilityofthedifferentkindsofsystem.
According to Blanchard et al.[20], Maintainabilitydetermines the probability that a failed equipment, machine (=system component),ora systemcanbe restoredtoitsnormaloperable statewithin a givenmake-span,using theprescribedpractices andprocedures.Itstwomaincomponentsare:
• Serviceability(easeofconductingscheduledinspectionsandservicing)and
• Repairability(easeofrestoringserviceafterafailure).
Thispapermainlyfocusesonserviceability.InaccordancewithLamet. al[12],weconsiderthetime,costandresource constraintsofascheduleofmaintenancetasks.Atthesametime,uponspecifyingresourceavailabilities,budgetsanddead- lines,theminimal growthofsystem reliability5 isalso specified.The targetfunction wastofind theminimal make-span consideringthegivenbudgetofascheduleandtheminimalgrowthofthesystemreliability.
2.1. Calculatingsystemreliability
Toschedulemaintenancetasks, thefirststepis tocharacterizethe system.One ofthemostfrequentlyused modeling techniquesis the reliability block diagram (RBD). To modela simple production system, an RBD is drawn asa series of blocksconnectedinparallelorinsequentialconfiguration.Eachblockrepresentsacomponentofthesystemwithafailure rate.Parallelpathsareredundant,meaningthatalltheparallelpathsmustfailforthenetworktofail.This“redundancy” is importantforcriticalequipment,e.g.,inapowerplant.
2See an excellent review of the specialties of scheduling maintenance tasks in [12] .
3The reliability block diagram (RBD) is a diagrammatic method for showing how component reliability contributes to the success or failure of a system (see, e.g., [13,14] ).
4For further literature about random networks, see [16] .
5In this study, the quality parameter considered is the growth of system reliability.
Fig. 1. The applied matrix-based maintenance management model.
In contrast,any failure along a sequential pathcauses the entireseries path to fail.For example,for equipmentin a productionlinethat insteadcanbecharacterizedasa serial(=sequential)path,ifanyequipmentisdamaged,thiscauses thefailureofproduction(onthatline).
SincemostproductionsystemscanbecharacterizedasanS/Pnetwork,thesystemreliabilitycanbedeterminedbythe networkreductionmethod(NRM)[15].Themethod’sstepsreducethesizeofthenetworkwhilepreservingitsreliability.This methodcanalsobeappliedtoevaluatethereliabilityofaparticularS/Pnetworkwithinthepolynomialcomputationaltime demand.Ifthe systemcanbe reducedto S/Pconfigurations (wecan sayitis an S/Preduciblenetwork), itis arelatively simplemattertodeterminethemathematicaloranalyticalformulathatdescribesthesystem’sreliability[15].
degreecomponent,thencalculatingthereliabilityofthesystemtwice:onceasifthekeycomponentfailedandonceasif thekey componentsucceeded.Thesetwoprobabilitiesarethencombinedtoobtainthereliabilityofthesystem,asatany giventime,thekeycomponentwillfailoroperate.ThiscalculationpropertyofDCMisagreatadvantagewhenevaluating thesystemreliabilityofSFandSWnetworksorothernetworksthatfollowapowerlaw.
SinceinSFandSWnetworks,wehavehighdegreenodes,afterthedecomposition,weobtaincertainindependentsub- networks;therefore, DCMs canbe usedto calculate large-scale scale-free networks’ systemreliability. Although applying DCMissuitable forlow-clustered6 scale-free networks(suchaspowergrids),thismethod isexcessivelyslowwhen used forhigh-clusterednetworks(suchasonionnetworks)orS/Pnetworks.Therefore,acombinationofDCMandNRMisused.
Afterdecomposition,NRMisusedtoreducetheserial/parallelcomponents.Ifasubsystemisaserial/parallelnetwork,itcan becalculatedusingNRM.Nevertheless,NRMcanamasstheserial/parallelcomponentsofthenetwork,andifacomponent cannot bereducedby NRM,DCM candecompose it [15].Repeating thereducing phase(by NRM)andthedecomposition phase(byDCM),thereliabilityofhigh-clusterednetworks(suchascertainkindsofonionnetworks)canalsobecalculated quickly.
Forevaluatingthesystemreliabilityofothernetworks, othermethods,suchasthepathtracingmethod(PTM)andthe eventspacemethod(ESM),canalsobeused.Sincenotonlyserial/parallelbutalsoscale-freeandonionnetworksareused formodelingsystems,thecombinationofDCMandNRMisappliedtocalculatesystemreliability.
Allofthesemethodsfocusonly ontheevaluationofthesystemreliabilitythrough thesystemtopologyandthecom- ponentreliability; however,they do not address howto maintainthe systemandhow to increase thesystemreliability.
Thepossible maintenance activities (ortasks) should be organizedintoa flexible logicplan. Decisionmakers must make decisions,whichnecessitates that maintenance tasksshould be completedto increase thesystemreliability. The selected activitiesshouldbecompletedwithinaspecifiedtimeframeandbudgetandshouldconsidertheresourceavailabilities.
2.2.Modifiedmatrix-basedmaintenancemanagementmodel
Thispapermodifiesthematrix-basedmaintenancemanagementmodel(hereinafterM4)(see[19])andthematrix-based modeltoaddresstwokindsofstructures(reliabilitydiagramofthesystemstructure(1),suchasareliabilitydiagramofa productionlineorapowergridsystem,andamaintenanceplan(2)).TheoriginalversionofM4focusesonlyonproduction lines that could be characterized asan S/P network; therefore,only NRM is used to calculatethe reliability or, inother cases,theavailabilityofasystem.Inthisextensionoftheoriginalapproach,wemustconsiderSF,SWandonionsnetworks;
therefore,themodifiedDCMisappliedinsteadofNRMforthecalculationofthesystemreliability.Theotherproblemwith the original M4 is that the methodwas limited to medium-scale plans (∼75 tasks orequipment) because of the large numberof possible maintenance plans. In our currentstudy, larger plans (∼50000 tasks or equipment) should also be investigated; therefore,atthe simulation phase, the optimizationneeded to be parallelized by using CUDAtechnologies, whichwasimplementedbyMatlab. WiththeParallelComputingToolbox,acluster(containing16computers)isspeedup toacceleratethecalculations.
InM4,toallequipment(or,moregenerally,systemcomponents),atleastonemaintenanceactivitycanbeassigned.Nev- ertheless,fewareselectedforamaintenanceplan.Therefore,weusedaflexiblemodelingtechnique(see[17]).Inthisstudy, the matrix-based method is used instead of applying the traditional network-planning techniques because matrix-based methodscancombinedifferentkindsofstructures ina multiple-domainmatrix(MDM)(see[24])andallow usto distin- guishmandatory andtobedetermined(hereafterundecided)maintenanceactivities(see [17]).Activitiesinthefirstgroup must be completed. Forexample, the system componentreliability is under the specified threshold.These activities are staticcomponentsofapossiblescenarioofamaintenance plan.Atthesametime,ascenariocancontainundecidedmain- tenanceactivitiesifthespecifiedmaintenanceplanbasedonselectedactivitiescanmaintainthetime/cost/quality/resource constraints.
After usingthis (parallelized) M4 algorithm,we will obtain a maintenance plan that containsthe set ofmaintenance tasks.Thesetasksare proposedtobe scheduledtoincrease thesystemreliabilitywithminimal durationandtomaintain thebudget.
Owingto the algorithm,currently not onlythe reliability butalso themaintainability of thesystem canbe explored.
Therefore,the mainquestionof thispaperisthe following: Arethereany maintainability (ormore precisely, serviceability) differencesamongthedifferentkindsofsystemstructures?(RQ1)
6The global clustering coefficient is the number of closed triplets (or 3 × triangles) over the total number of triplets (both open and closed).
Fig. 2. The steps of generating serial/parallel networks.
Sinceforexaminingserviceability,wemustconsidertwokindsof((1)systemand(2)taskschedule)structures,another questionisasfollows:Doesthesystemstructureortheconstraintshavemoreimpactonserviceability?(RQ2)
Owingtotheknowledgeofnetworks, wecanimprovethereliabilityofa system.Forexample,we cancreatean onion (highclustered)networkfromanSF oran SWnetwork (see,e.g.,[10,11]).Therefore,thethirdquestionisasfollows:Does thereliabilityimprovementimprovetheserviceabilityornot?(RQ3)
2.3. Generatingstructures
Twokindsofstructuresweregenerated.Thefirstdescribesthesystemstructure(i.e.,thestructureofaproductionsystem orthestructureofpowergrid),andthesecondcharacterizesthescheduleoftasks.
2.3.1. Generatingsystemstructures
Systemstructures andcomponentreliability valuesarecharacterized bythe reliabilityblock diagram(RBD). Mostpro- ductionsystemscanbecharacterizedbyS/Pnetworks(seeSection2.1).Whengeneratinganetwork,weshouldsettherate oftheserialblocks(S%).Intheinitialstep,we generatea componentwithone connectionpoint(see step0inFig.2). In everystep,wegenerateapurerandomnumber(s)withintheinterval[0,1].Ifs>S%(s≤S%),weconnectaparallel(serial) blocktoconnectionpoints(seestep1inFig.2).Inthelaststep,theblockswillbereflected.
IfS%=1,wewillonlyobtainserialblocks;incontrast,ifS%=0,weobtaintwointerconnectedbinarytrees.
TheInternetandthepowergridinsteadfollowSFandSWnetworks.WhengeneratinganSForSWnetwork,wefollowed Barabásiet.al.[4]networkgrowingmethod.Thenetworkbeginswithaninitialconnectednetworkofn0nodes.Newnodes areaddedtothenetworkoneatatime.Eachnewnodeisconnectedton≤n0existingnodeswithaprobabilityproportional tothenumberoflinksthattheexistingnodescurrentlyhave.
Formally,theprobabilitypithatthenewnodeisconnectedtonodeiispi= ki
jkj,wherekiisthedegreeofnodei,and thesumincludesallpre-existingnodesj(i.e.,thedenominatorresultsintwicethecurrentnumberofedgesinthenetwork).
WegeneratedstructuresusingthepoweRlawpackageoftheRprogram,wherethedesiredparameterwas
γ
∈{1.5,2.0,2.5}.γ
=1.5characterizesanSWnetwork,whereasγ
=2.5characterizesanSFnetwork.Heavily linked nodes(so-called “hubs”, in thissimulation, e.g., power plants) tend to quickly accumulate more links, while nodes with only a few links are unlikely to be chosen asthe destination fora newlink. The new nodeshave a so-called“preference” toattachthemselvestothecurrentlyheavilylinkednodes.
Thisalgorithmcancharacterizedifferentkindsofnetworks[2,4],andthismethodisalsogoodforcharacterizingpower grids[25].Thesenetworksaremoreresistanttorandomfailuresbutlessresistanttoadirectattack[5].
Therefore,oneofthenewdirectionsistoimproveanetworksuchthatitismoreresistant tobothrandomfailuresand directattacks.Themainproblemisthatifahub (ahigh-degreenode)ismalfunctioningorbeingattacked,thesystemcan befragmented[25].Thisfragmentationcancauseasystemfailure.
The ideaof improvingthesystemreliability isto connect highdegreenodes toeach other toobtain amore resistant network.Thisnetworkwillbeaso-calledonionnetwork(see,e.g.,[1,10,11]).WeusedWu&Holmes’algorithm[10],where theinitialnetworkwasageneratedSForSWnetwork,andtheoutputwasthemostrobustonionnetwork.
Inallsimulationcasesandforallstructures,thecomponents’reliabilityfollowedauniformrandomdistributionwithin theinterval[0,1].
2.3.2. Generatingschedules
Mostgenerators(see,e.g.,ProGenbyKolischandSprecher[26]) generatequasi-randomnetworksoflogicplans. Inreal random networks, every node can be connected to another with the same probability; however, in a schedule, we use directed connections (as dependencies). We can specifythe numberof stages(N) andmaximal number ofnodes (ni) in stageI,J=1,2,..,N..Toavoiddirectcycles,onlyarcsbetweenanodefromstageIandanodefromstageJisallowedifI<J. Therefore,thisstructureofscheduledtasksisaso-calledquasi-randomstructure.
only10%.
Alargerplans,suchassystemshutdowns,requiresmoremandatorytasksthansmalleronessuchascontinuouspreven- tivemaintenanceplans.Therefore,tocharacterizethedifferencesbetweenasystemshutdownandcontinuousmaintenance, theratioofnon-mandatorymaintenancetaskswasP%∈{50%,60%,..,90%}.Notalltheactivitieswereconductedintheevent ofsystemshutdown;nevertheless, incontinuousmaintenance,lessrepairactivitywillbe performedina smallermainte- nanceplan.
Afterspecifyingtheflexiblemaintenanceplantime/cost,resourcedemandswererandomlyselectedfromthesetofcom- pletionssimulatedbyProGeninthepreviousstep.
3. Results
After generating schedule and system structures, the minimal/maximal make-span (TPT = total process time)/cost (TPC = total process cost), the vector of maximal values of the resource demands (total process resource TPR) and the minimal/maximalgrowthofsystemreliability(TSR=thegrowthoftotalsystemreliability)canbecalculatedasfollows:
TPTmin occursifevery flexibledependencyisomittedandonlymandatory activitiesare completedwithintheminimal (so-calledcrash)taskduration[17].
TPTmaxoccursifeveryflexibledependencyisrealizedandbothmandatoryandundecidedactivitiesarecompletedwithin themaximal(i.e.,normal)taskduration[17].
TPCmin occursifonlymandatorytasksarecompletedutilizingminimalcosts[17].
TPCmaxoccursifbothmandatoryandundecidedtasksarecompletedutilizingmaximal(so-calledcrash)costs[17]. TPRmin occursifeveryflexibledependencyisrealizedbutonlymandatory activitiesarecompletedwithinthemaximal
taskduration[17].
TPRmax occursifevery flexibledependency isomittedandboth mandatoryandundecidedtasksare completedwithin theminimaltaskduration[17].
TSRmin occursifonlymandatorytasksarecompetedandtheimpactofmaintenanceactivitiesisminimal.
TSRmax occursifbothmandatoryandundecidedtasksandtheimpactofmaintenanceactivitiesismaximal.
Tocompareresults,weuseconstraintratios,whichcanbecalculatedasfollows:
Cx%= Cx
Xmax−Xmin·100 (1)
whereX∈{TPT,TPC,TSR};Cx∈{Xmin,Xmax}istheconstraint.NotethatX∈{TPT,TPC,TSR}specifiesatraditional(so-called iron)triangle(see,e.g., [28]), whereTPT isthemake-span,TPCistherealizedbudget,andTSRcharacterizesthe quality oftheschedule.Inthissimulation,Cx%∈{50%,60%,..,90%}.Differentkindsofconstraintscanbesetforthedifferentkinds ofresources.However,toavoidgeneratingalargenumberofcases,resourceconstraintsaresettobe75%forallresources.
Inadditionto thescheduleparameters, systemstructuralparametersare considered. Thenumberofequipment (n) in thefirstsimulationwasn∈{25,50,75};however,forexploringlarge-scalenetworks, n∈{25000,50000,75000}.Theratio ofnon-mandatoryactivitiesinbothsimulationswasP%∈{50%,60%,..,90%}.
In each simulation, we investigated the maintainability (specifically, the serviceability) of both small-scale andlarge- scale structures. Therefore, the target wasto completemaintenance tasks assoon as possible within a given timeframe andbudget; in addition, the growth of the system reliability must be greater than a specified value. We constructed a maintainabilityratioasfollows:
M%=1−TPTTPTmax−TPT−TPTmin
min ∈[0,1],whereTPTisthemake-spanoftheoptimalsolution.Ifthisvalueis1,itmeansthat we canfindtheminimalmake-spanwithintheconstraints.
Thescopeofthesimulationresultswastoanswertheresearchquestions(RQ1-RQ3).
Aftersimulation,wevalidatedtheanswersofRQ1-RQ3consideringtheHungarianpowergridstructure;seeFig.4.
7Where the coefficient of network complexity (arcs/nodes) is set to be 1.3.
8In this simulation, the number of resources is set to be 3.
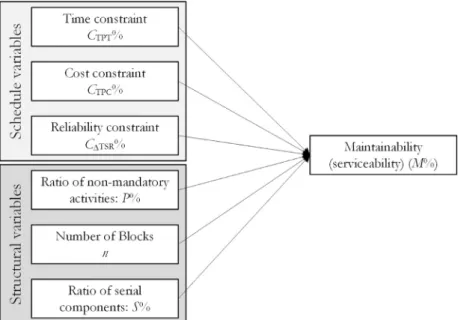
Fig. 3. Dependent and independent variables for simulation.
Fig. 4. Hungarian power grid topology (where the load of electric wires is greater than 10 kV; average path length = 3.74).
3.1. Simulationresults
Threekinds ofsimulations wereperformed. Inthefirstsimulation ofonlyserial/parallelsystems,structures weregen- eratedtocharacterizetheproductionsystem(seetheresearchmodelinFig.3).Inthiscase,theratioofserialcomponents wasS%∈{50%,60%,..,100%}.
Inthesecondsimulation,wecomparedtheresultsbetweenserial/parallel(S/P)andsmall-world/scale-free(SW/SF)net- works.Tocomparethemaintainabilityofthesetwostructures,the coefficientofnetworkcomplexity(CNC)wasthesame forbothS/PandSW/SFnetworks.
In the third simulation, in accordance with Wu & Holmes’algorithm [10], we constructed an onion network from a scale-freenetworkandcomparedthemaintainability.
3.1.1. AnalyzingthemaintainabilityofS/Pnetworks
Table1showsparameterestimatesofthesimulationresult.
The positive significant coefficients show that if we increase these values, we can improve the maintainability.
Table1showsthatstructuralparametersaremoreimportantthantheconstraints(seeRQ3).
C TSR% ∗∗∗ 2.792E-04 −14.909 < 2E-16 −6.910E-02 0.732%
P % ∗∗∗ 2.792E-04 53.523 < 2E-16 2.481E-01 9.436%
n ∗∗∗ 1.934E-06 163.580 < 2E-16 7.582E-01 88.144%
S % ∗∗∗ 2.312E-04 −22.512 < 2E-16 −1.043E-01 1.669%
Table 2
Total system reliability, with equipment reliability following a uniform distribu- tion.
Structure Mean Median Std.dev. Min. Max.
S/P 8.749E-03 3.337E-03 1.579E-02 1.606E-05 1.970E-01 SF/SW 2.698E-01 2.599E-01 1.045E-01 2.742E-02 6.810E-01
Table 3
The results of parameter estimates, ∗∗∗ significance level is less than 0.0 0 01, adj. R 2= 0,5091, N = 5400.
Parameter estimates
Term Std.err. t value Prob > |t| Std.beta Rel.imp.%
Intercept ∗∗∗ 3.182E-03 297.991 <2.0 0 0E-16 0.0 0 0E-01 – C TPT% 1.906E-03 −1.879 6.030E-02 −1.792E-02 0.063%
C TPC% 1.906E-03 −0.260 7.948E-01 −2.481E-03 – C TSR% ∗∗∗ 2.302E-03 −23.874 < 2.0 0 0E-16 −2.277E-01 10.173%
P % ∗∗∗ 2.302E-03 23.874 < 2.0 0 0E-16 2.277E-01 10.177%
n ∗∗∗ 1.595E-06 −4.189 2.850E-05 −3.994E-02 0.313%
’S/P’, ’SW/SF’ ∗∗∗ 6.510E-04 66.643 < 2.0 0 0E-16 6.355E-01 79.274%
Since a higher flexible ratio (P%)9 instead models continuous maintenance, the positive coefficient of P% showsthat continuousmaintenancecanbemoreeffective(seeRQ2).
Itiseasytorealizethatmoreparallelblocks(lessserialblocks)inasystemproducehighersystemreliability;however, consideringthenegativecoefficient ofS%, weobtain aninteresting result. Theeffectivenessofmaintenance ishigherina morereliablesystem,whereS%islower(seeRQ1).
Thenegativecoefficient of theincrease ofthe reliability parameter(CTSR%)is trivial. Ifwe increase theminimal im- provementofthesystemreliability,thedistancebetweenthefeasiblemake-spanandtheideal,whichequalstheminimal make-span,willbeincreased.
3.1.2. Exploringthemaintainabilityofscale-free/small-worldlarge-scalenetworks
Ifthestructureofthesystemcanbecharacterizedasascale-freeorasmall-worldnetwork,thetotalsystemreliability issignificantlyhigherthanthatforthetraditionalserial/parallelsystems(seeTable2).
Ourresultsconfirm theresultsof[29]that scale-free/small-world networksare morereliablethanrandom orS/Pnet- works.SF/SW networks are more resistant against random failures [30]. However, thenovel resultwas that not only the systemreliabilitybutalsothesystemserviceabilitymainlydependsonthesystemstructure(seeRQ3andthegreatestrelative importancevalueforthesystemtopology(‘S/P’vs‘SF/SW’)).
Thedifferentkindsofscheduleandstructurevariablesspecify5400simulations.Table3showsthat onlyoneschedule variableissignificant,andthestructureparametersaremoreimportantthanthescheduleparameters.
Oneofthemostinterestingresultsisthatthechangesofthecostandtimeconstraintsarenotsignificantinthismodel.
Theotherconsiderableresultisthatsystemstructures thatfollowpowerlaw networkscanbemaintained fasterthan tradi- tionalserial/parallelsystemstructures(seeRQ1).
Theresultsshowusthatifamaintenancesplanisflexible,themake-spancanbemoresignificantlyreduced(seeRQ2).
9= the ratio of non-mandatory tasks.
3.1.3. Exploringthemaintainabilityofonionnetworks
In accordancewithWu andHolme’s[10] algorithm,we constructed onionnetworksfromthe formerspecified SF/SW networks,andwecomparedtheirmaintainability.
OurfindingsconsistofParandehgheibiandModiano’s[5]results.Oursimulationshowsthatthemeanofthetransformed onionnetworks’systemreliabilityis82.8%more(nearlytwiceas)reliableastheoriginalSF/SWnetworks,whilethemain- tainabilityoftheonionnetwork(M’O’%)issignificantlybetterthanthemaintainabilityoftheSF/SWnetworks(M’SF/SW’%);in addition,theimprovementratiois MM’O’%
’SF’%=1.08.
Thesimulationresultalsoshowsusthatthemorereliablenetworks’serviceabilityishigher(seeRQ1).
3.2. Applicationofthestudy
Severalscholars showedthat the power gridis a typical exampleof aplanar SW network (see [4]). Most ofthe real networks’ degree distributions followa powerlaw of the formP(k)≈k−γ with the exponent
γ
. In Rosas-Casalset al.’s [25] publication, theaverageexponentγ
=1.8 (wherethe minimalone wasinthe UnitedKingdom,γ
UK=0.91, andthe maximal one wasin Portugal,γ
PT=2.72).Rosas-Casalsetal.[25] showedthat thedifference inthenetwork responseto errorsandattacksappearstoberelatedonlytonetworksizeandnottoothertopologicalmeasuresofnetworkcomplexity suchasthemeandegreeortheexponentγ
ofthedegreedistribution.Therefore,untilnow,weaddressedSW/SFnetworks thatweretreateduniformly.Nevertheless,inthisstudy,weaddressedmaintainabilityinsteadofreliabilityorresistance.Wecomparedthemaintain- abilityofthepowergridsofPortugal,theUnitedKingdomandHungary.Forthefirsttwocountries,we usedRosas-Casals etal.’s[25] publisheddata;however,forHungary,we usedthe2015 powergridstructure (see Fig.4).The exponentwas
γ
HU=1.935.Theaverageweighteddegreewas2.51.Theaveragepathlengthwas5.01.Thenextstudyfocused ontheser- viceabilityanalysisofthecountries’powergrids;however,we foundthattheserviceability isdifferentifweconsiderthe UK’s,Portugal’sorHungary’stopology.Usingtheproposedsimulationframework,weobtainsignificantdifferencesbetween serviceability: MM’UK’%’HU’%=0.972,while MM’PT’%
’HU’%=1.031.
Thisresultshowsusthat,incontrasttothereliability,themaintainabilitymaydependonthestructuralparameters.
According toSection 3.1.3,in additionto the reliability,the maintainability can be improvedifhigh-degree nodesare connectedby usingWu andHolme’s [10]algorithm. Inthiscase,the maintainabilityofthe Hungarianpowergridcan be improvedto5.27%.
4. Summaryandconclusion
Thispaperaddressedmulti-structural networks,wheresystemstructureandthemaintenanceactivitiesareinvestigated separately.This papershowedthat themaintainability mainlyinfluenced the topologyof thesystem. Moreresistant net- works’maintainabilityisgreaterthanthatoflessreliablenetworks.
4.1. Implicationsforscholars
Exploringmaintainabilityisonesuitable exampleofthepowerofmulti-structuralthinking.Withtheproposedmethod, atleasttwo differentkindsofstructures andtheinteractions betweencomponentscan be modeled.The resultsshow us thatthemaintainabilitystronglydependsonthesystemstructures(RQ1)butonlyslightlydependsontheconstraints(RQ3).
Themainmessageofthispaperisthatmorereliablesystemscanbemaintainedmoreeffectively.Ifwewanttoimprovethe effectivenessofthemaintenanceofa(large-scale)system,weshouldfocusonthesystemstructure,andweshouldmakeit morereliable.
Similar to the modeling agile vs traditionalproject management approaches (see [17]), withthe flexibility parameter (rateofnon-mandatorytasks),differentkindsofmaintenancemanagementstrategiescanbemodeled(RQ2).Similarly,with theimprovementoftheeffectivenessofagileapproachesinprojectmanagement,themoreflexiblecontinuousmaintenance planscanbemoreeffective.Therefore,theothermessageisthattheflexibilityofplanningcanimproveitseffectiveness. 4.2. Implicationsfordecisionmakers
Theproposedmulti-domainmatrix-basedmaintenancemanagement(M4)techniquecanbeusedtosimulatetheeffects ofdifferentkindsofmaintenance strategies.Theresultsshow usthat thecontinuouspreventivemaintenance strategycan bemoreeffectivethanperiodicstanddowns(RQ2).Thissimulationresultisanotherargumentforthecontinuouspreventive maintenanceapproaches, whichwerealsoproposedboth inthetotalproductivemaintenance (TPM)andintherisk-based maintenance(RBM)strategies.
Decision makers andplanners can mainly focus on the constraints and the completions. Therefore,in the short run, theseindividuals can improvethe effectiveness ofmaintainability ifthey act inaccordance withthe flexible, continuous maintenance strategies.However, significantimprovements ineffectivenesscanbe achievedifthetopology ofthesystem structurecanbemorereliable.
structureforthesystem, oneforperformingtheactivities,andanotherfortheorganization.Thismulti-structuralthinking can be extended toconnect andmodelinteractions onmore than two differentstructures withdifferenttopologies and different(deterministic/stochastic)natures.
Acknowledgment
ThisresearchissupportedbyaJánosBolyaiFellowship.
Supplementarymaterial
Supplementarymaterialassociatedwiththisarticlecanbe found,intheonlineversion,atdoi:10.1016/j.simpat.2018.03.
002. References
[1] V.H.P. Louzada, F. Daolio, H.J. Herrmann, M. Tomassini, Smart rewiring for network robustness, J. Complex Netw. 1 (2) (2013) 150–159, doi: 10.1093/
comnet/cnt010 .
[2] L.A .N. Amaral, A . Scala, M. Barthélémy, H.E. Stanley, Classes of small-world networks, Proc. Natl. Acad. Sci. 97 (21) (20 0 0) 11149–11152, doi: 10.1073/
pnas.200327197 .
[3] D.J. Watts , S.H. Strogatz , Collective dynamics of’small-world’networks, Nature 393 (6684) (1998) 4 40–4 42 .
[4] A.-L. Barabási, R. Albert, H. Jeong, Mean-field theory for scale-free random networks, Physica A 272 (1–2) (1999) 173–187, doi: 10.1016/S0378-4371(99) 00291-5 .
[5] M. Parandehgheibi, E. Modiano, Robustness of interdependent networks: the case of communication networks and the power grid, in: GLOBE- COM(IEEE), 2013, pp. 2164–2169, doi: 10.1109/GLOCOM.2013.6831395 .
[6] M. Newman , Networks: An Introduction, First, Oxford University Press, Oxford, 2010 .
[7] C. Ducruet, L. Beauguitte, Spatial science and network science: review and outcomes of a complex relationship, Netw. Spatial Econ. 14 (3) (2014) 297–316, doi: 10.1007/s11067- 013- 9222- 6 .
[8] V.H. Louzada, F. Daolio, H.J. Herrmann, M. Tomassini, Generating Robust and Efficient Networks under Targeted Attacks, in: D. Król, D. Fay, B. Gabry ´s (Eds.), Propagation Phenomena in Real World Networks, Intelligent Systems Reference Library, 85, Springer International Publishing, 2015, pp. 215–224, doi: 10.1007/978- 3- 319- 15916- 4 _ 9 .
[9] Y. Hayashi , J. Matsukubo , Geographical effects on the path length and the sobustness in complex networks, Phys. Rev. E 73 (6) (2006) 66–113 . [10] Z.-X. Wu, P. Holme, Onion structure and network robustness, Phys. Rev. E 84 (2011) 026106, doi: 10.1103/PhysRevE.84.026106 .
[11] T. Tanizawa, S. Havlin, H.E. Stanley, Robustness of onionlike correlated networks against targeted attacks, Phys. Rev. E 85 (2012) 046109, doi: 10.1103/
PhysRevE.85.046109 .
[12] E.W. Lam, A.P. Chan, D.W. Chan, Benchmarking success of building maintenance projects, Facilities 28 (5/6) (2010) 290–305, doi: 10.1108/
02632771011031529 .
[13] M. Rausand , A. Hoyland , System Reliability Theory, Models, Statistical Methods and Applications, Second, Wiley New York, 2004 .
[14] D. Bhattacharjya, L. Deleris, From reliability block diagrams to fault tree circuits, Decision Anal. 9 (2) (2012) 128–137, doi: 10.1287/deca.1120.0231 . [15] M. Shiker , Some methods of calculating the reliability of mixed models, J. Babylon University 21 (3) (2013) 770–774 .
[16] A. Rényi , P. Erd ˝os , On random graphs, Publicationes Mathematicae 6 (5) (1959) 290–297 .
[17] Z.T. Kosztyán, Exact algorithm for matrix-based project planning problems, Expert Syst. Appl. 42 (9) (2015) 4 460–4 473, doi: 10.1016/j.eswa.2015.01.066 . [18] P. De, E.J. Dunne, J.B. Ghosh, C.E. Wells, Complexity of the discrete time-cost tradeoff problem for project networks, Oper. Res. 45 (2) (1997) 302–306,
doi: 10.1287/opre.45.2.302 .
[19] Z.T. Kosztyán, C. Heged ˝us, J. Kiss, A. Németh, Handling Maintenance Projects with Matrix-Based Methods, Springer New York, New York, NY, pp.
357–366. 10.1007/978-1-4614-3558-7_29
[20] B.S. Blanchard , D. Verma , E.L. Peterson , Maintainability: A Key to Effective Serviceability and Maintenance Management, 13, John Wiley & Sons, 1995 . [21] Y.-M. Wang, T. Elhag, Evidential reasoning approach for bridge condition assessment, Expert Syst. Appl. 34 (1) (2008) 689–699, doi: 10.1016/j.eswa.
20 06.10.0 06 .
[22] A. Verma, A. Srividya, D. Karanki, Basic Reliability Mathematics, Springer London, 2010, doi: 10.1007/978- 1- 84996- 232- 2 _ 2 . [23] Z. Yuan , C. Zhao , Z. Di , W.-X. Wang , Y.-C. Lai , Exact controllability of complex networks, Nat. Commun. 4 (2013) 2447 .
[24] M. Danilovic, T.R. Browning, Managing complex product development projects with design structure matrices and domain mapping matrices, Int. J.
Project Manage. 25 (3) (20 07) 30 0–314, doi: 10.1016/j.ijproman.20 06.11.0 03 .
[25] M. Rosas-Casals, S. Valverde, R.V. Solé, Topological vulnerability of the european power grid under errors and attacks, Int. J. Bifurcation Chaos 17 (7) (2007) 2465–2475, doi: 10.1142/S0218127407018531 .
[26] R. Kolisch, A. Sprecher, {PSPLIB} - a project scheduling problem library: {OR} software - {ORSEP} operations research software exchange program, Eur.
J. Oper. Res. 96 (1) (1997) 205–216, doi: 10.1016/S0377-2217(96)00170-1 .
[27] H. Wang, A survey of maintenance policies of deteriorating systems, Eur. J. Oper. Res. 139 (3) (2002) 469–489, doi: 10.1016/S0377-2217(01)00197-7 . [28] R. Atkinson, Project management: cost, time and quality, two best guesses and a phenomenon, its time to accept other success criteria, Int. J. Project
Manage. 17 (6) (1999) 337–342, doi: 10.1016/S0263-7863(98)0 0 069-6 .
[29] R. Cohen , K. Erez , D. Ben-Avraham , S. Havlin , Breakdown of the internet under intentional attack, Phys. Rev. Lett. 86 (16) (2001) 3682 .
[30] J.-P. Onnela , J. Saramäki , J. Hyvönen , G. Szabó, D. Lazer , K. Kaski , J. Kertész , A.-L. Barabási , Structure and tie strengths in mobile communication networks, Proc. Natl. Acad. Sci. 104 (18) (2007) 7332–7336 .