Stimulatory effect of insulin on H þ -ATPase in the proximal tubule via the Akt/mTORC2 pathway
M. NAKAMURA
1p, N. SATOH
1, H. TSUKADA
1, T. MIZUNO
1, W. FUJII
1, A. SUZUKI
1,2, S. HORITA
1, M. NANGAKU
1and M. SUZUKI
31Division of Nephrology and Endocrinology, The University of Tokyo, Tokyo, Japan
2Department of Nephrology, Japan Community Health care Organization (JCHO), Tokyo Yamate Medical Center, Tokyo, Japan
3Health Service Center, Tokyo Gakugei University, Tokyo, Japan
Received: August 18, 2019 • Accepted: June 12, 2020 Published online: September 29, 2020
© 2020 Akademiai Kiado, Budapest
ABSTRACT
Purpose:Acid-base transport in renal proximal tubules (PTs) is mainly sodium-dependent and conducted in coordination by the apical Naþ/Hþ exchanger (NHE3), vacuolar Hþ-adenosine triphosphatase (V- ATPase), and the basolateral Naþ/HCO3- cotransporter. V-ATPase on PTs is well-known to play an important role in proton excretion. Recently we reported a stimulatory effect of insulin on these trans- porters. However, it is unclear whether insulin is involved in acid-base balance in PTs. Thus, we assessed the role of insulin in acid-base balance in PTs.Methods:V-ATPase activity was evaluated using freshly isolated PTs obtained from mice, and specific inhibitors were then used to assess the signaling pathways involved in the observed effects.Results:V-ATPase activity in PTs was markedly enhanced by insulin, and its activation was completely inhibited by bafilomycin (a V-ATPase-specific inhibitor), Akt inhibitor VIII, and PP242 (an mTORC1/2 inhibitor), but not by rapamycin (an mTORC1 inhibitor). V-ATPase activity was stimulated by 1 nm insulin by approximately 20% above baseline, which was completely suppressed by Akt1/2 inhibitor VIII. PP242 completely suppressed the insulin-mediated V-ATPase stimulation in mouse PTs, whereas rapamycin failed to influence the effect of insulin. Insulin-induced Akt phosphorylation in the mouse renal cortex was completely suppressed by Akt1/2 inhibitor VIII and PP242, but not by rapamycin.Conclusion: Our results indicate that stimulation of V-ATPase activity by insulin in PTs is mediated via the Akt2/mTORC2 pathway. These results reveal the mechanism underlying the complex signaling in PT acid-base balance, providing treatment targets for renal disease.
*Corresponding author. Division of Nephrology and Endocrinology, The University of Tokyo, 7-3-1 Hongo, Bunkyo- ku, Tokyo 113-8655, Japan. Tel.:þ81 3 3815 5411; fax:þ81 3 5800 9826; E-mail: nakamura-stm@umin.ac.jp
KEYWORDS
V-ATPase, insulin, proximal tubules, mTOR, mTORC2
INTRODUCTION
Sodium transport and acid-base equilibrium play essential roles in the maintenance of ho- meostasis. Renal tubules, especially proximal tubules (PTs), play a central role in the regulation of pH homeostasis (1). Several clinical studies have demonstrated that abnormalities in the acid– base balance are associated with the development of chronic kidney disease, bone disorders, inflammation, and immune response dysregulation (2–4). Most of the bicarbonate and sodium that is filtered by glomeruli are reabsorbed by transport in the PTs. Insulin is implicated in bicarbonate reabsorption in the PTs; furthermore, insulin signaling in the kidneys, particularly within podocytes and tubules, is closely associated with diabetic nephropathy (5, 6).
We have previously reported that stimulation of mouse PT Naþtransport is mediated by the insulin/insulin receptor substrate (IRS)2/PI3K pathway (7). Furthermore, the stimulatory effect of insulin on PT Naþtransport via the insulin/IRS2/PI3K pathway may play an essential role in the pathogenesis of hypertension associated with metabolic syndrome (8, 9). Indeed, insulin enhances Naþtransport through the insulin/Akt pathway in almost all nephron segments (10).
For instance, in PTs, insulin stimulates luminal Naþ-Hþ-exchanger type 3 (NHE3), basolateral Naþ/Kþ-ATPase, and basolateral Naþ-HCO3-cotransporter (NBCe1) (11). In addition, in distal tubules, insulin stimulates the activity of the sodium chloride symporter (NCC) (12). Moreover, in collecting tubules, insulin amplifies the activity of the amiloride-sensitive epithelial Naþ channel (ENaC) and Naþ-Kþ-ATPase (13–16). Thus, tubular Na transport is linked to acid-base transport, with insulin as one of the regulators. Therefore, insulin could regulate vacuolar Hþ- adenosine triphosphatase (V-ATPase), which is related to tubule acid-base transport.
Several recent studies have reported that the mammalian target of rapamycin complex (mTORC) 1 and 2 are downstream of Akt signaling, and that the Akt/mTORC pathway is responsible for regulating insulin signaling in the liver, adipocytes, and muscle (17–19). Recent reports have demonstrated that mTOR and vacuolar-type Hþ-ATPase (V-ATPase) are closely intertwined, and that mTOR and V-ATPase regulate lysosomal metabolism (20). In addition, leucine/glutamine and mTORC1-mediated V-ATPase/lysosomal acidification is essential forfin regeneration in zebrafish (21). In breast cancer, mTORC1 regulates V-ATPase activity, affecting cancer growth (22). A recent study demonstrated that mTORC1 inhibits insulin signaling via phosphorylation of the ribosomal protein S6 kinase (S6K), leading to insulin resistance (23).
Furthermore, in a study on the pathogenesis of Dent’s disease, we recently found that V-ATPase and the 2Cl/Hþexchanger CLC-5 are functionally closely related, not only in endosomes but also on PT cell membranes (24). V-ATPase is not only involved in proton transport, but also has a wide range of biological effects, such as regulation of energy metabolism, cell proliferation, or autophagy by interactions with mTORC1 (25).
Several studies have shown that V-ATPase activation by insulin is involved in the devel- opment of diabetic nephropathy or chronic kidney disease via protein reabsorption on the PT or modulation of the Naþtransporter on the PT (26, 27). Furthermore, several reports suggest that mTOR may contribute to the V-ATPase activity of PTs. However, little is known about the roles
of the insulin/Akt pathway, V-ATPase, and mTORC in PT Naþreabsorption due to various technical and other problems. Accordingly, we examined the effects of insulin on V-ATPase in mouse PTs.
MATERIALS AND METHODS
Animal samples
Male C57BL/6 mice were purchased from CLEA Japan, Inc. (Tokyo, Japan). All animal pro- cedures followed the institutional guidelines (authorization number: H-18–260). C57BL/6 mice were maintained on a 12-h dark/light cycle with standard food and water providedad libitum.
At 4–6 weeks of age, the mice were sacrificed using a high dose of pentobarbital (50 mg/kg), and the PTs and renal cortex tissue were obtained.
Microdissection of the PT
Our experiment used a modified and simplified micro-perfusion method. The PT isolation procedure was performed in a manner similar to that described previously (28). Briefly, using micro-tweezers in a 48C HEPES-buffered solution (127 mM NaCl, 5 mM KCl, 1.5 mM CaCl2, 1 mM MgCl2, 2 mM NaH2PO4, 1 mM Na2SO4, 25 mM HEPES, 5.5 mM glucose, adjusted to pH 7.4) under a microscope, nephrons were roughly collected from 1.5 mm thick slices of freshly isolated renal cortex and the PT S2 segment was then collected based on morphological char- acteristics (29–31).
Measurement of NHE3 and V-ATPase activity in mouse PTs
To measure luminal V-ATPase and NHE3 activities, intracellular pH was monitored using an inverted fluorescence microscope equipped with MetaFluor 7.7 (Molecular Devices, Sunnyvale, CA, USA). The luminal V-ATPase activity and NHE3 activity in freshly isolated, split-open mouse PTs were measured as previously reported (24). Briefly, the freshly isolated PTs (S2 segment) obtained from 6-week-old C57BL/6 mice werefirstly manually micro-dissected on ice without any collagenase treatment, and then attached to a glass coverslip coated with Cell-Tak glue (Corning, Inc., Corning, NY, USA), and a capillary glass was used to expose the luminal surface as described for isolated mouse PTs (24, 32). Next, split-open mouse PTs in the chamber were incubated with an acetoxymethyl ester form of the pH-sensitive fluorescence dye 20,70- bis(carboxyethyl)-5(6)-carboxyfluorescein (BCECF/AM; Dojindo, Kumamoto, Japan) at 37 8C in HEPES-buffered solution for 15 min; then, the split-open isolated PT was perfused at 378C with HEPES-buffered solution for 2 min, and the perfusate was then switched to an isotonic Naþ-free solution (3 mM KCl, 2 mM KH2PO4, 1 mM MgSO4, 1.5 mM CaCl2, 25 mM HEPES, 5.5 mM glucose, 119 mM NMDG-Cl, adjusted to pH 7.4).
Intracellular acidification was achieved primarily by NHE3 activity, therefore, NHE3 activity was determined by the rate of decrease in cellular pH in response to a reduction in the Naþ concentration from 130 to 0 mmol/L (mM) in the solution.
V-ATPase activity was determined by the rate of cellular pH recovery during the perfusion of Naþ-free solutions. For the calculation of V-ATPase activity, the cellular pH change during the initial 30 s was measured. In some experiments, the role of V-ATPase was confirmed by adding
200 nM bafilomycin A1 (Baf) (Wako, Tokyo, Japan) to the bath perfusate. The effect of insulin on V-ATPase or NHE 3 activity was also measured 8 min after adding 1 nM insulin to the bath solution. To investigate signaling, the following specific inhibitors were added to the bath so- lution: 1
m
M Akt inhibitor VIII (Akt-I) (Millipore; Billerica, MA, USA), 20 nM rapamycin (Santa Cruz Biotechnology, Dallas, TX, USA), or 1m
M PP242 (Wako Pure Chemical Industries, Osaka, Japan).Immunoblotting
Immunoblotting was performed as previously described (8, 9, 24). Briefly, after incubation for 5 min with insulin in DMEM at 378C, the renal cortex tissue was homogenized in ice-cold buffer A (25 mM Tris-HCl (pH 7.4), 10 mM sodium orthovanadate, 10 mM sodium pyrophosphate, 100 mM sodiumfluoride, 10 mM EDTA, 10 mM EGTA, and 1 mM PMSF), and centrifuged (48C, 12,0003g, 15 min).
For protein expression analysis, we used a bicinchoninic acid protein assay (FUJIFILM Wako Pure Chemical Corporation, Osaka, Japan) to determine the protein concentration. Afterward, protein samples (30–50
m
g) prepared from the cell lysates were fractionated using sodium dodecyl sulfate–polyacrylamide gel electrophoresis (10% gel), then transferred to a nitrocellulose membrane and probed with a primary antibody diluted with Can Get Signal Solution I (Toyobo, Osaka, Japan). Alpha-tubulin was used as an endogenous control, and all samples were adjusted for tubulin expression levels. Primary antibodies against alpha-tubulin, Akt, phospho-Akt (Ser473), the B2 subunit of V-ATPase, and phospho-70S6K were purchased from Cell Signaling Technology (Danvers, MA, USA). Proteins were detected using the secondary Ab conjugated with horseradish peroxidase (goat anti-rabbit, 1:10,000, Irritant NA934V, Fisher Scientific, G€oteborg, Sweden) diluted with Can Get Signal Solution II (Toyobo, Osaka, Japan) on an ECL Immunoblotting Detection System (ImmunoStar® Zeta, FUJIFILM Wako Pure Chemical Corporation, Osaka, Japan). All images were acquired using a chemiluminescence detection system, LAS 4000 mini (GE Healthcare, Chicago, IL, USA). The density of the bands was analyzed using ImageQuant TL (GE Healthcare, Chicago, IL, USA).Statistical analysis
Data are presented as the mean±standard error of the mean or median. Unpaired Student’s t-tests or ANOVA and Kruskal–Wallis test were used to determine significant differences as appropriate. For post-hoc multiple comparison analyses, we used the Dann–Bonferroni, Tukey’s honestly significant difference (HSD), or Dunnett’s tests. Statistical significance was set atP<
0.05. Statistical analyses were performed using the JMP®15 software (SAS Institute Inc., Cary, NC, USA).
RESULTS
Effects of insulin on V-ATPase and NHE3 activities in mouse PTs
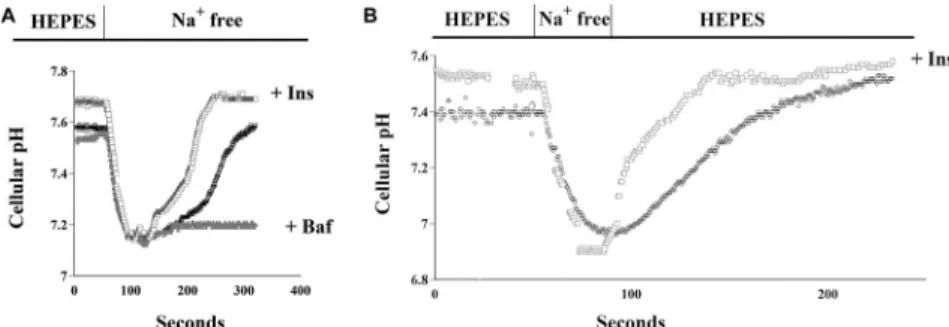
We first measured V-ATPase activity in isolated PTs, according to our previously described methods (24). In the open lumen of freshly isolated mouse PTs, Naþconcentration-dependent and independent pH changes were observed after Naþwas rapidly withdrawn from the perfusate
(Fig. 1A). The Naþconcentration-independent change was entirely reversed by the V-ATPase- specific inhibitor Baf (Fig. 1A), consistent with our previous results (24). The results of Naþ concentration-dependent intracellular pH change (defined as NHE3 activity in this study) were comparable to those of our previous report (Fig. 1B) (24). These results identify the observed intracellular Naþ-independent pH change as a Baf-dependent, V-ATPase-mediated phenomenon.
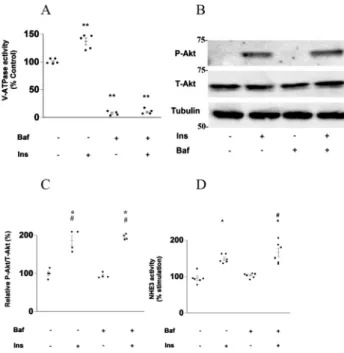
Next, we examined whether V-ATPase and NHE3 activities are insulin-dependent in mouse PTs. As shown inFig. 1A, physiological concentrations of insulin stimulated V-ATPase activity in mouse PTs. Fig. 2A shows that Baf completely blocked the V-ATPase activity. Insulin increased Akt phosphorylation in the renal cortex; this insulin-induced Akt-phosphorylation was not affected by Baf (Fig. 2B and C). Furthermore, we examined whether luminal NHE3 activity was reliably measured in the freshly isolated lumen-open mouse PTs. As shown in Fig. 1B, physiological concentrations of insulin also stimulated NHE3 activity in mouse PTs.
Fig. 2Dshows that physiological concentrations of insulin stimulated NHE3 activity in mouse PTs, and that this insulin-stimulated NHE3 activity was not affected by Baf. We also confirmed that Baf had a negligible effect on NHE3 activity.
Roles of Akt in insulin-stimulated V-ATPase and NHE3 activities in mouse PTs
We next examined whether the stimulatory effects of insulin on V-ATPase and NHE3 in mouse PTs involved the Akt pathway. V-ATPase and NHE3 activities were markedly increased by 1 nM insulin: however, these changes were almost entirely inhibited by Akt-I (Fig. 3A and B). As shown in Fig. 3B, the physiological insulin concentration-stimulated NHE3 activity was Fig. 1.V-ATPase and NHE3 activity in mouse proximal tubules. (A) (left) Luminal V-ATPase acti- vation in open lumen mouse proximal tubules. Black circles indicate a basal trace of intracellular pH.
Gray triangles indicate a trace of intracellular pH when 200 nM Baf was added. White squares indicate a trace when 1 nM Ins was added. (B) (right) Luminal NHE3 activation in lumen-open mouse proximal tubules. Intracellular pH tracings of freshly isolated, split-open mouse proximal tubules in response to Naþremoval. Freshly isolated, split-open mouse proximal tubules showed a rapid and great pH drop due to Naþremoval, thus reflecting high NHE3 activity. Black circles indicate a trace of intracellular pH when 200 nM Baf was added. White squares indicate a trace when 1 nM Ins was
added. Baf: bafilomycin, Ins: insulin.
completely suppressed by Akt-I. These results indicate that the stimulatory effects of insulin on V-ATPase and NHE3 activities were mediated by Akt. We also examined Akt phosphorylation in the kidney cortex. As shown inFig. 3C and D, Akt phosphorylation in the kidney cortex was increased by insulin and was almost entirely suppressed by Akt-I.
Fig. 2.Effects of insulin on V-ATPase and NHE3 activity in mouse proximal tubules. (A) Effects of insulin on V-ATPase activity in isolated mouse proximal tubules; Ins-untreated and Baf-untreated proximal tu- bules (n55), 1 nM Ins-treated proximal tubules (n55), 200 nM Baf-treated proximal tubules (n54), and Baf and Ins-treated proximal tubules (n54). The Kruskal–Wallis test followed by the Dunnett's test was used to estimateP values; ** P < 0.01 vs. Ins-untreated and Baf-untreated proximal tubules. Baf:
bafilomycin, Ins: insulin. (B, C) Effect of Baf on insulin-induced Akt phosphorylation in the mouse kidney cortex. Intensity data for Akt phosphorylation/Total-Akt were quantified by densitometry; Ins-untreated and Baf-untreated kidney cortex (n54), 1 nM Ins-treated kidney cortex (n54), Baf-treated kidney cortex (n55), and 200 nM Baf-treated and 1 nM Ins-treated kidney cortex (n5 4). Tubulin was used as an endogenous control and all samples were adjusted for tubulin expression levels. The Kruskal–Wallis test followed by the Dann–Bonferroni test was used to estimatePvalues; * P< 0.05, vs. Baf-untreated and insulin-untreated renal cortexes. #P < 0.05, vs. Baf-treated and insulin-untreated renal cortexes. Baf:
bafilomycin, Ins: insulin, P-Akt: Akt phosphorylation, (D) Effects of insulin on NHE3 activity in isolated mouse proximal tubules; Ins-untreated and Baf-untreated proximal tubules (n56), 1 nM insulin-treated proximal tubules (n56), Baf-treated proximal tubules (n56), and 200 nM Baf-treated and 1 nM insulin- treated proximal tubules (n56). The Kruskal–Wallis test followed by the Dann–Bonferroni test was used to estimatePvalues; *P< 0.05, vs. Baf-untreated and insulin-untreated proximal tubules; #P< 0.05, vs.
Baf-treated and insulin-untreated proximal tubules. Baf: bafilomycin, Ins: insulin
Roles of mTORCs in the insulin-stimulated V-ATPase and NHE3 activities in mouse PTs
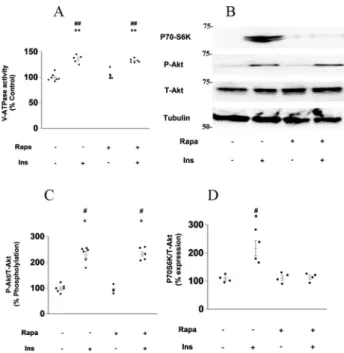
V-ATPase is a component of the mTOR pathway (25). Therefore, we examined the association between V-ATPase activity and the mTOR pathway. The mTORC1 inhibitor rapamycin did not influence the stimulatory effect of insulin on V-ATPase activity in mouse PTs (Fig. 4A) or Fig. 3.Roles of Akt in the insulin-stimulated acid-base balance in the mouse proximal tubules. (A) Effect of 1 mM Akt inhibitor VIII (Akt-I) on insulin-stimulated V-ATPase activity in isolated mouse proximal tubules; Ins-untreated and Akt-I-untreated proximal tubules (n57), 1 nM Ins-treated proximal tubules (n5 7), 1mM Akt-I-treated proximal tubules (n5 6), and 1mM Akt-I-treated and 1 nM Ins-treated proximal tubules (n 55). The Kruskal–Wallis test followed by the Dunnett's test was used to estimate P values; *P< 0.05 vs. Akt-I-untreated and insulin-untreated proximal tubules. Ins: insulin, Akt-I: Akt inhibitor VIII. (B) Effect of 1mM Akt-I on insulin-stimulated NHE3 activity in isolated mouse proximal tubules: Ins-untreated and Akt-I-untreated proximal tubules (n54), 1 nM Ins-treated proximal tubules (n54), 1mM Akt-I-treated proximal tubules (n55), and 1mM Akt-I-treated and 1 nM insulin-treated proximal tubules (n56). Tubulin was used as an endogenous control, and all samples were adjusted for tubulin expression levels. The ANOVA followed by the Tukey's HSD test was used to estimatePvalues;
*P< 0.05 vs. Akt-I-untreated and Ins-untreated proximal tubules. Ins: insulin, Akt-I: Akt inhibitor VIII.
(C, D) Effect of Akt-I on insulin-induced Akt phosphorylation in the mouse renal cortex. Intensity data for Akt phosphorylation/Total-Akt were quantified by densitometry; Ins-untreated and Akt-I-untreated kidney cortex (n56), 1 nM Ins-treated kidney cortex (n56), 1mM Akt-I-treated kidney cortex (n56), and 1mM Akt-I-treated and 1 nM insulin-treated kidney cortex (n56). The Kruskal–Wallis test followed by the Dann–Bonferroni test was used to estimate P values; * P < 0.05 vs. Akt-I-untreated and Ins-untreated kidney cortex. #P < 0.05 vs. Akt-I-treated and Ins-untreated kidney cortex. Ins: insulin,
Akt-I: Akt inhibitor VIII, P-Akt: Akt phosphorylation
insulin-induced Akt phosphorylation in the mouse kidney cortex (Fig. 4B and C). However, rapamycin suppressed insulin-induced S6K phosphorylation in the mouse kidney cortex (Fig. 4B–D).
Fig. 4.Roles of mTORC1 in the insulin-stimulated V-ATPase and NHE3 activities in mouse proximal tubules. (A) Effect of 20 nM rapamycin (Rapa) on insulin-stimulated V-ATPase activity in isolated mouse proximal tubules; Ins-untreated and Rapa-untreated proximal tubules (n 5 7), 1 nM insulin-treated proximal tubules (n55), 20 nM Rapa-treated proximal tubules (n55), and 20 nM Rapa-treated and 1 nM Ins-treated proximal tubules (n56). The ANOVA followed by the Tukey's HSD test was used to estimatePvalues; **P< 0.01 vs. insulin-untreated and Rapa-untreated proximal tubules, ##P< 0.01 vs.
insulin-untreated and 20 nM Rapa-treated proximal tubules. Ins: insulin, Rapa: Rapamycin. (B) Effect of Rapa on insulin-induced Akt phosphorylation and P70S6K in the mouse renal cortex. Tubulin was used as an endogenous control, and all samples were adjusted for tubulin expression levels. Ins: insulin, Rapa:
Rapamycin, P-Akt: Akt phosphorylation. (C) Intensity data for Akt phosphorylation/Total-Akt were quantified by densitometry; Ins-untreated and Rapa-untreated kidney cortex (n56), 1 nM Ins-treated kidney cortex (n56), 20 nM Rapa-treated kidney cortex (n56), and 20 nM Rapa-treated and 1 nM insulin-treated kidney cortex (n56). The Kruskal–Wallis test followed by the Dann–Bonferroni test was used to estimatePvalues; *P< 0.05 vs. Rapa-untreated and Ins-untreated kidney cortex. #P< 0.05 vs. 20 nM Rapa-treated and insulin-untreated kidney cortex. Ins: insulin, Rapa: Rapamycin, P-Akt: Akt phos- phorylation. (D) Intensity data for P70S6K/Total-Akt were quantified by densitometry; Ins-untreated and Rapa-untreated kidney cortex (n54) and 1 nM Ins-treated kidney cortex (n54), 20 nM Rapa-treated kidney cortex (n54), and 20 nM Rapa-treated and 1 nM Ins-treated kidney cortex (n54). The Kruskal–
Wallis test followed by the Dann–Bonferroni test was used to estimatePvalues; *P< 0.05 vs. Rapa-un- treated and Ins-untreated kidney cortex. #P < 0.05 vs. 20 nM Rapa-treated and Ins-untreated kidney
cortex. Ins: insulin, Rapa: Rapamycin
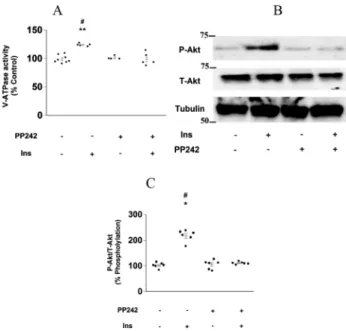
Next, we examined the association between V-ATPase activity and mTORC2. Surprisingly, the mTORC1/2 inhibitor PP242 completely inhibited the stimulatory effect of insulin on V-ATPase activity in mouse PTs (Fig. 5A), whereas PP242 treatment decreased the insulin-induced phosphorylation of Akt in the kidney cortex (Fig. 5B and C). Furthermore, the stimulatory effect of insulin on NHE3 activity was hardly affected by rapamycin (Fig. 6A) but was almost completely inhibited by PP242 (Fig. 6B). These results indicated that mTORC2, but not mTORC1, mediated the stimulatory effects of insulin on V-ATPase and NHE3 activities.
Fig. 5.mTORC2 regulates insulin-stimulated V-ATPase and NHE3 activity in mouse proximal tubules.
(A) Effect of 5 mM PP242 on insulin-stimulated V-ATPase activity in isolated mouse proximal tubules;
Ins-untreated and PP242-untreated proximal tubules (n 58), 1 nM Ins-treated proximal tubules (n5 5), 5 mM PP242-treated proximal tubules (n 5 5), and 5 mM PP242-treated and 1 nM Ins-treated proximal tubules (n 55). The Kruskal–Wallis test followed by the Dann–Bonferroni test was used to estimateP values; **P < 0.01 vs. insulin-untreated and PP242-untreated proximal tubules. #P < 0.05 vs. 5 mM PP242-treated proximal tubules. Ins: insulin. (B) Effect of PP242 on insulin-induced Akt phosphorylation in the mouse renal cortex. Tubulin was used as an endogenous control, and all samples were adjusted for tubulin expression levels. Ins: insulin, P-Akt: Akt phosphorylation. (C) Intensity data for Akt phosphorylation/Total-Akt were quantified by densitometry; insulin-untreated and PP242-untreated kidney cortex (n56), 1 nM insulin-treated kidney cortex (n56), 5mM PP242- treated kidney cortex (n 56), and 5 mM PP242-treated and 1 nM insulin-treated kidney cortex (n5 6). The Kruskal–Wallis test followed by the Dann–Bonferroni test was used to estimatePvalues; *P <
0.05 vs. PP242-untreated and Ins-untreated kidney cortex. #P < 0.05 vs. 5mM PP242-treated and Ins- untreated kidney cortex. Ins: insulin
DISCUSSION
We found that physiological concentrations of insulin markedly stimulate V-ATPase activity in isolated mouse PTs using the split-open method. Furthermore, our results showed that the stimulatory effects of insulin on V-ATPase were not mediated by mTORC1 but by mTORC2 in PTs. The measurement of V-ATPase activity is technically challenging (3); this is, to the best of our knowledge, thefirst study to measure the stimulatory effect of insulin on V-ATPase and NHE3 activities using the split-open method (24). Furthermore, we demonstrated that the stimulation of V-ATPase activity on PTs by insulin is mediated by Akt/mTORC2 signaling pathways.
V-ATPase is implicated in endocytosis (33, 34), and insulin is involved in the regulation of endocytosis (35, 36). Previous studies have suggested that the insulin/Akt pathway is involved in the regulation of proteins, such as cubilin or megalin, expressed on the PT membrane. The expression levels of these proteins are significantly affected by insulin and are associated with endocytosis (37). Furthermore, these studies also indicated that the insulin/Akt pathway might contribute to the onset or development of diabetic nephropathy (35, 36). Based on the results of these previous studies and our current results, the stimulatory effects of insulin on V-ATPase are likely to be involved in the regulation of endocytosis. Thus, insulin plays an important role in endocytosis.
In urine acid-base equilibrium, acid secretion from type A intercalated cells (ICs) on the collecting tubule as well as PTs is important, and acid secretion from type A ICs on the col- lecting tubule is regulated primarily by V-ATPase. Several studies have reported that PKA signaling and AMP-activated protein kinase (AMPK) regulate V-ATPase at the apical mem- brane of type A ICs (38–40). Similarly, these kinases also regulate V-ATPase in the PT and epididymis (41, 42). Because PKA phosphorylation levels are negatively regulated by insulin, insulin is expected to suppress V-ATPase activity. In contrast, our results revealed that Fig. 6.Effects of mTOR inhibitors on insulin-stimulated NHE3 activity in mouse proximal tubules. (A) Effect of 20 nM rapamycin on insulin-stimulated NHE3 activity in isolated mouse proximal tubules (n54) in the absence and presence of 1 nM insulin.Pvalues displayed were estimated by unpaired Student'st-test,
**P< 0.01 vs. insulin-untreated proximal tubules. Rapa: Rapamycin, Ins: insulin. (B) Effect of 5mM PP242 on insulin-stimulated NHE3 activity in isolated mouse proximal tubules (n 54–6) in the absence and presence of 1 nM insulin.Pvalues displayed were estimated by unpaired Student'st-test. Ins: insulin
V-ATPase was stimulated by insulin in the PT, possibly because the complex mTOR pathway can be dominant in the PT.
Several recent studies have reported the association between V-ATPase and mTORC1 (25, 37). For example, V-ATPase/mTOR signaling controls apical endocytosis and regulates megalin activity (37, 43, 44). These studies suggest that V-ATPase and mTOR signaling are strongly involved in PT endocytosis. However, few studies have examined the effects of in- teractions between mTORC2 and V-ATPase, especially in the kidney. Several studies have examined the relationship between mTORC2 and Naþtransport in the kidney. ENaC has a stimulatory effect via the insulin/PI3K/Akt/mTORC2 pathway in the distal nephron, whereas rapamycin does not influence ENaC activation (45). Ourfindings suggest that the stimulatory effects of insulin on V-ATPase activity or Naþtransport in PTs do not involve mTORC1 but involve mTORC2. Thesefindings are reasonable in the context of previous reports.
Our study had the following limitation: PP242, which inhibits both mTORC1 and mTORC2, was used owing to the lack of an mTORC2-specific inhibitor. As a result, we could not confirm the effect of mTORC2 inhibition alone. Furthermore, in order to strictly evaluate protein phosphorylation, we might need to improve stripping and re-probing protocols to use the same blot membranes. However, our physiological experiments support our western blot results. In fact, our protein expression results were not only consistent with the ones obtained with physiological experiments, but also with the ones obtained previously in our lab, which revealed that insulin-stimulated PT sodium transport is mediated via the Akt2/mTORC2 pathway (46).
Lastly, total Akt levels varied widely among samples despite similar tubulin levels, which we believe was due to individual differences among mice (data not shown).
In summary, we found a stimulatory effect of insulin on the PT acid-base balance via V- ATPase. Notably, our results suggest that the insulin-stimulated PT acid-base balance is mediated by the Akt/mTORC2 pathway. This is the first evaluation of V-ATPase activity during insulin-mediated events in PTs. Although further investigations are warranted, our study pro- vides an in-depth insight into the mechanism underlying the complex signaling in acid-base balance and provides potential treatment targets to tackle renal disease.
ACKNOWLEDGMENTS
The authors would like to thank Editage (www.editage.jp) for the English language editing. The study was supported by the Japan Society for the Promotion of Science (JSPS) KAKENHI Grant Number JP17K16071, 15K09284, 16K09640, 18K082011 and 19K08671.
REFERENCES
1. Rajkumar P, Pluznick JL. Acid-base regulation in the renal proximal tubules: using novel pH sensors to maintain homeostasis. Am J Physiol Renal Physiol 2018; 315: F1187–90.
2. Mayor S. Low blood levels of bicarbonate are linked to premature death in healthy older people, study shows.
BMJ 2016; 352: i172.
3. Navaneethan SD, Schold JD, Arrigain S, Jolly SE, Wehbe E, Raina R, et al. Serum bicarbonate and mortality in stage 3 and stage 4 chronic kidney disease. Clin J Am Soc Nephrol 2011; 6: 2395–402.
4. Raphael KL, Murphy RA, Shlipak MG, Satterfield S, Huston HK, Sebastian A, et al. Bicarbonate concen- tration, acid-base status, and mortality in the health, aging, and body composition study. Clin J Am Soc Nephrol 2016; 11: 308–16.
5. Lay AC, Hurcombe JA, Betin VMS, Barrington F, Rollason R, Ni L, et al. Prolonged exposure of mouse and human podocytes to insulin induces insulin resistance through lysosomal and proteasomal degradation of the insulin receptor. Diabetologia 2017; 60: 2299–311.
6. Welsh GI, Hale LJ, Eremina V, Jeansson M, Maezawa Y, Lennon R, et al. Insulin signaling to the glomerular podocyte is critical for normal kidney function. Cell Metab 2010; 12: 329–40.
7. Zheng Y, Yamada H, Sakamoto K, Horita S, Kunimi M, Endo Y, et al. Roles of insulin receptor substrates in insulin-induced stimulation of renal proximal bicarbonate absorption. J Am Soc Nephrol 2005; 16: 2288–95.
8. Nakamura M, Satoh N, Suzuki M, Kume H, Homma Y, Seki G, et al. Stimulatory effect of insulin on renal proximal tubule sodium transport is preserved in type 2 diabetes with nephropathy. Biochem Biophys Res Commun2015; 461: 154–8.
9. Nakamura M, Yamazaki O, Shirai A, Horita S, Satoh N, Suzuki M, et al. Preserved Na/HCO3cotransporter sensitivity to insulin may promote hypertension in metabolic syndrome. Kidney Int 2015; 87: 535–42.
10. Soleimani M. Insulin resistance and hypertension: new insights. Kidney Int 2015; 87: 497–9.
11. Horita S, Nakamura M, Suzuki M, Satoh N, Suzuki A, Seki G. Selective insulin resistance in the kidney.
Biomed Res Int 2016; 2016: 5825170.
12. Nishida H, Sohara E, Nomura N, Chiga M, Alessi DR, Rai T, et al. Phosphatidylinositol 3-kinase/Akt signaling pathway activates the WNK-OSR1/SPAK-NCC phosphorylation cascade in hyperinsulinemic db/db mice. Hypertension 2012; 60: 981–90.
13. Blazer-Yost BL, Liu X, Helman SI. Hormonal regulation of ENaCs: insulin and aldosterone. Am J Physiol 1998; 274: C1373–9.
14. Feraille E, Rousselot M, Rajerison R, Favre H. Effect of insulin on Naþ,K(þ)-ATPase in rat collecting duct. J Physiol 1995; 488(Pt 1): 171–80.
15. Ilatovskaya DV, Levchenko V, Brands MW, Pavlov TS, Staruschenko A. Cross-talk between insulin and IGF- 1 receptors in the cortical collecting duct principal cells: implication for ENaC-mediated Naþreabsorption.
Am J Physiol Renal Physiol 2015; 308: F713–9.
16. Loffing J, Korbmacher C. Regulated sodium transport in the renal connecting tubule (CNT) via the epithelial sodium channel (ENaC). Pflugers Arch 2009; 458: 111–35.
17. Fujii M, Amanso A, Abrah~ao TB, Lassegue B, Griendling KK. Polymerase delta-interacting protein 2 regulates collagen accumulation via activation of the Akt/mTOR pathway in vascular smooth muscle cells. J Mol Cell Cardiol 2016; 92: 21–9.
18. Guo Q, Xu L, Li H, Sun H, Wu S, Zhou B. 4-PBA reverses autophagic dysfunction and improves insulin sensitivity in adipose tissue of obese mice via Akt/mTOR signaling. Biochem Biophys Res Commun 2017;
484: 529–35.
19. Saxton RA, Sabatini DM. mTOR signaling in growth, metabolism, and disease. Cell 2017; 168: 960–76.
20. Abu-Remaileh M, Wyant GA, Kim C, Laqtom NN, Abbasi M, Chan SH, et al. Lysosomal metabolomics reveals V-ATPase- and mTOR-dependent regulation of amino acid efflux from lysosomes. Science 2017; 358:
807–13.
21. Takayama K, Muto A, Kikuchi Y. Leucine/glutamine and v-ATPase/lysosomal acidification via mTORC1 activation are required for position-dependent regeneration. Sci Rep 2018; 8: 8278.
22. McConnell M, Feng S, Chen W, Zhu G, Shen D, Ponnazhagan S, et al. Osteoclast proton pump regulator Atp6v1c1 enhances breast cancer growth by activating the mTORC1 pathway and bone metastasis by increasing V-ATPase activity. Oncotarget 2017; 8: 47675–90.
23. Ardestani A, Lupse B, Kido Y, Leibowitz G, Maedler K. mTORC1 Signaling: A Double-Edged Sword in DiabeticbCells. Cell Metab 2018; 27: 314–31.
24. Satoh N, Yamada H, Yamazaki O, Suzuki M, Nakamura M, Suzuki A, et al. A pure chloride channel mutant of CLC-5 causes Dent’s disease via insufficient V-ATPase activation. Pflugers Arch 2016; 468: 1183–96.
25. Zoncu R, Bar-Peled L, Efeyan A, Wang S, Sancak Y, Sabatini DM. mTORC1 senses lysosomal amino acids through an inside-out mechanism that requires the vacuolar H(þ)-ATPase. Science 2011; 334: 678–83.
26. Kuwagata S, Kume S, Chin-Kanasaki M, Araki H, Araki S, Nakazawa J, et al. MicroRNA148b-3p inhibits mTORC1-dependent apoptosis in diabetes by repressing TNFR2 in proximal tubular cells. Kidney Int 2016;
90: 1211–25.
27. Lee-Kwon W, Kawano K, Choi JW, Kim JH, Donowitz M. Lysophosphatidic acid stimulates brush border Naþ/Hþexchanger 3 (NHE3) activity by increasing its exocytosis by an NHE3 kinase A regulatory protein- dependent mechanism. J Biol Chem 2003; 278: 16494–501.
28. Choi JY, Shah M, Lee MG, Schultheis PJ, Shull GE, Muallem S, et al. Novel amiloride-sensitive sodium- dependent proton secretion in the mouse proximal convoluted tubule. J Clin Invest 2000; 105: 1141–6.
29. Biner HL, Arpin-Bott MP, Loffing J, Wang X, Knepper M, Hebert SC, et al. Human cortical distal nephron:
distribution of electrolyte and water transport pathways. J Am Soc Nephrol 2002; 13: 836–47.
30. Burg M, Grantham J, Abramow M, Orloff J. Preparation and study of fragments of single rabbit nephrons.
Am J Physiol 1966; 210: 1293–8.
31. Burg MB, Grantham J, Abramow M, Orloff J, Schafer JA. Preparation and study of fragments of single rabbit nephrons. J Am Soc Nephrol 1997; 8: 675–83.
32. Sch€odel J, Klanke B, Weidemann A, Buchholz B, Bernhardt W, Bertog M, et al. HIF-prolyl hydroxylases in the rat kidney: physiologic expression patterns and regulation in acute kidney injury. Am J Pathol 2009; 174:
1663–74.
33. Mellman I, Fuchs R, Helenius A. Acidification of the endocytic and exocytic pathways. Annu Rev Biochem 1986; 55: 663–700.
34. Palokangas H, Metsikk€o K, V€a€an€anen K. Active vacuolar HþATPase is required for both endocytic and exocytic processes during viral infection of BHK-21 cells. J Biol Chem 1994; 269: 17577–85.
35. Artunc F, Schleicher E, Weigert C, Fritsche A, Stefan N, H€aring HU. The impact of insulin resistance on the kidney and vasculature. Nat Rev Nephrol 2016; 12: 721–37.
36. Bryniarski MA, Yee BM, Jaffri I, Chaves LD, Yu JA, Guan X, et al. Increased megalin expression in early type 2 diabetes: role of insulin signaling pathways. Am J Physiol Renal Physiol 2018; 315: F1191–207.
37. Gleixner EM, Canaud G, Hermle T, Guida MC, Kretz O, Helmst€adter M, et al. V-ATPase/mTOR signaling regulates megalin-mediated apical endocytosis. Cell Rep 2014; 8: 10–9.
38. Alzamora R, Al-Bataineh MM, Liu W, Gong F, Li H, Thali RF, et al. AMP-activated protein kinase regulates the vacuolar Hþ-ATPase via direct phosphorylation of the A subunit (ATP6V1A) in the kidney. Am J Physiol Renal Physiol 2013; 305: F943–56.
39. Alzamora R, Thali RF, Gong F, Smolak C, Li H, Baty CJ, et al. PKA regulates vacuolar Hþ-ATPase locali- zation and activity via direct phosphorylation of the a subunit in kidney cells. J Biol Chem 2010; 285: 24676– 85.
40. Gong F, Alzamora R, Smolak C, Li H, Naveed S, Neumann D, et al. Vacuolar Hþ-ATPase apical accumu- lation in kidney intercalated cells is regulated by PKA and AMP-activated protein kinase. Am J Physiol Renal Physiol 2010; 298: F1162–9.
41. Al-bataineh MM, Gong F, Marciszyn AL, Myerburg MM, Pastor-Soler NM. Regulation of proximal tubule vacuolar H(þ)-ATPase by PKA and AMP-activated protein kinase. Am J Physiol Renal Physiol 2014; 306: F981–95.
42. Hallows KR, Alzamora R, Li H, Gong F, Smolak C, Neumann D, et al. AMP-activated protein kinase inhibits alkaline pH- and PKA-induced apical vacuolar Hþ-ATPase accumulation in epididymal clear cells. Am J Physiol Cell Physiol 2009; 296: C672–81.
43. Guan X, Qian Y, Shen Y, Zhang L, Du Y, Dai H, et al. Autophagy protects renal tubular cells against ischemia/
reperfusion injury in a time-dependent manner. Cell Physiol Biochem 2015; 36: 285–98.
44. Lin F. Autophagy in renal tubular injury and repair. Acta Physiol (Oxf) 2017; 220: 229–37.
45. Lang F, Pearce D. Regulation of the epithelial Naþchannel by the mTORC2/SGK1 pathway. Nephrol Dial Transplant 2016; 31: 200–5.
46. Nakamura M, Tsukada H, Seki G, Satoh N, Mizuno T, Fujii W, et al. Insulin promotes sodium transport but suppresses gluconeogenesis via distinct cellular pathways in human and rat renal proximal tubules. Kidney Int 2020; 97: 316–26.