5RVND7DPiV'RFWRUDO6FKRRORI6FLHQFHVDQG7HFKQRORJ\
)DFXOW\RI,QIRUPDWLRQ7HFKQRORJ\DQG%LRQLFV 3i]PiQ\3pWHU&DWKROLF8QLYHUVLW\
%DOi]V*iERU'RPERYiUL
,19,929$/,'$7,21$1'62)7:$5(
&21752/2)$&7,9(,175$&257,&$/
0,&52(/(&752'(6
3K'',66(57$7,21
6FLHQWLILFDGYLVRU
,VWYiQ8OEHUW
%XGDSHVW
DOI:10 15
To my loving wife, son, parents and family
Table of Contents
1 List of abbreviations ... 6
2 List of figures ... 8
3 List of tables ... 11
4 Abstract... 12
5 Introduction ... 14
5.1 Preface ... 14
5.2 Recent applications of neural devices ... 15
5.3 Brain stimulation and neural activity recording ... 16
6 Cortical neural circuitry ... 17
6.1 Neuroanatomy of the brain ... 17
6.2 Mechanical properties of brain tissue ... 18
6.3 Brain micromotions ... 19
6.4 Action potential generation ... 19
6.5 Propagation of the action potential ... 21
6.6 Non-invasive recording methods ... 21
6.7 Invasive recording methods ... 22
6.7.1 Extracellular recording techniques ... 23
6.7.2 Intracellular recording techniques ... 23
6.8 Origins of the brain electrical signal ... 24
7 Properties of sleep ... 26
7.1 Sleep – in general ... 26
7.2 Sleep stages ... 27
7.3 Slow wave sleep and slow oscillations ... 28
7.4 Generators of the slow oscillation ... 30
7.5 Reactive properties of sleep ... 32
8 Advances in electrode fabrication ... 33
8.1 From hand assembled electrodes to MEMS based probes ... 33
8.2 Utah Electrode Array ... 33
8.3 Michigan Probe ... 34
8.4 NeuroProbes and Caltech Probes ... 35
8.5 Mechanical adjustment of electrode position ... 35
9 Objectives ... 37
10 Electronic depth control concept ... 38
10.1 Gliosis and biocompatibility ... 38
10.2 Electronic depth control probe ... 39
11 Electronic depth control software – NeuroSelect ... 41
11.1 Graphical user interface ... 41
11.2 Programming environment ... 42
11.3 Programming features... 43
11.4 NeuroSelect Programming Introduction ... 46
11.4.1 Data Structure of NeuroSelect Software ... 46
11.4.2 wxWidgets ... 50
11.4.3 Anthemion DialogBlocks ... 50
11.4.4 Subversion ... 51
11.4.5 Doxygen ... 51
11.5 Data acquisition ... 52
11.6 Electrode selection ... 52
11.6.1 Manual electrode selection mode ... 52
11.6.2 Semi-automatic electrode selection mode ... 53
11.7 Data saving ... 55
11.8 SNR metric for spike quality assessment per channel ... 55
11.9 Perspectives of future developments ... 56
12 Neural signal processing ... 57
12.1 Spike sorting and clustering ... 57
12.1.1 Threshold detection ... 59
12.1.2 Differentiating spikes ... 59
12.1.3 Clustering algorithms ... 60
12.1.3.1 K-means based clustering ... 60
12.1.3.2 Bayesian clustering ... 60
12.1.3.3 Expectation maximimization clustering ... 61
12.1.4 Open problems in spike sorting practice ... 62
12.2 Fourier and wavelet transformations ... 62
12.2.1 Displaying biological signals ... 62
12.2.2 Fast Fourier Transformation ... 63
12.2.3 Wavelet transformation ... 64
12.2.4 Spectogram for state locked changes in EEG ... 65
13 Biological results ... 66
13.1 General remarks ... 66
13.2 Implantation procedures ... 66
13.3 Neural data recording procedures ... 67
13.4 Temporal, spectral, and spatial properties of the SO ... 68
13.5 Detection of up- and down-states ... 69
13.6 Averaged depth profiles of the SO ... 70
13.7 Properties of SUA ... 72
13.7.1 Firing patterns of single unit activities ... 74
14 Conclusions ... 75
15 Novel scientific results ... 77
16 Acknowledgements ... 79
17 Publications ... 80
17.1 Author’s publications related to the dissertation ... 80
17.2 Authors’ other publications not related to the dissertation ... 80
17.3 Authors conference posters ... 81
18 References ... 83
1 List of abbreviations
AASM - American Academy of Sleep Medicine AEP – Auditory Evoked PotentialAP – Action Potential BMI – Brain Machine Interface
BOLD - Blood Oxygenation Level Dependent
CMOS - Complementary Metal-Oxide Semiconductor CT - Computer Tomography
DAQ – Data Aquisition
DFT – Discrete Fourier Transformation DRIE – Deep Reactive Ion Etching DWT – Discrete Wavelet Transformation EDC – Electronic Depth Control
EDF – European Data Format EEG – Electroencephalogram ECoG - Electrocorticographic EM – Expectation Maximization
EPSP – Excitatory Postsynaptic Potential ERP – Event Related Potential
EAP - Extracellular Action Potential FFT - Fast Fourier Transformation fMRI – functional MRI
FT – Fourier Transformation FP – Field Potential
GABA – Gamma-Aminobutyric Acid GUI – Graphical User Interface
IDE – Integrated Development Environment IPSP – Inhibitory Postsynaptic Potential LFP – Local Field Potential
MEG – Magnetoencephalography
MEMS – Microelectromechanical Systems MFC – Microsoft Foundation Classes MRI - Magnetic resonance imaging MUA – Multiunit Activity
NREM – Non-rapid-eye-movement sleep PCA – Principal Component Analysis PCB – Printed Circuit Board
PET - Positron Emitted Tomography RAD – Rapid Application Development REM - Rapid-eye-movement sleep RMS – Root Mean Square
SD – Standard Deviation SMR - Sensorimotor Rhythm SNR – Signal-to-Noise Ratio SO – Slow -Oscillation SUA – Single Unit Activity SWS - Slow Wave Sleep
TMS – Transcranial Magnetic Stimulation UEA – Utah Electrode Array
UI – User Interface
2 List of figures
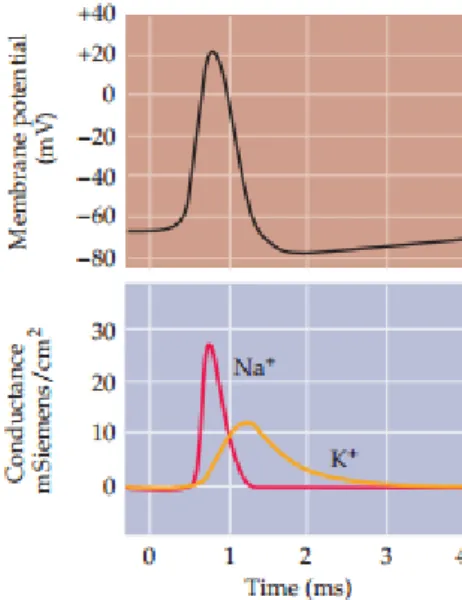
Figure 1: Mathematical reconstruction of the AP. Reconstruction of an AP (black curve) together with the underlying changes in Na+ (red curve) and K+ (yellow curve) conductance.
The size and time course of AP were calculated using only the properties of membrane conductance of Na+ and membrane conductance of K+ measured in voltage clamp experiments.
After [60]
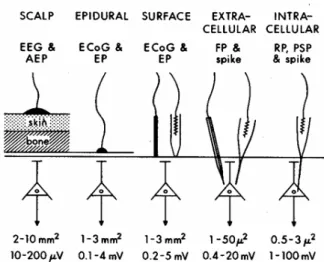
Figure 2: Brain electrode types; the figure shows the place of recording from scalp to intracellular level (from left to right). The 2nd line shows the recorded signal. The second line from the bottom represents the size of the area from which an electrode records the sum of the signals. The last line shows the amplitude of the signal [27].
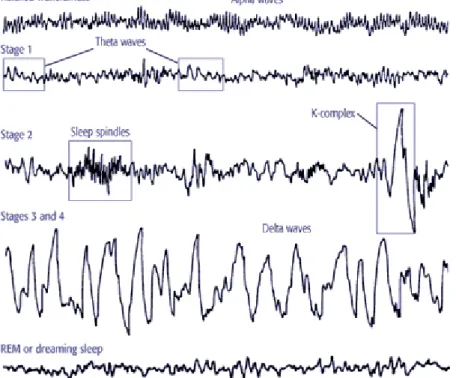
Figure 3: Different stages of NREM and REM sleep (Illustration). Note that in the new nomenclature there is no stage 4. We mentioned NREM (Stage 1 – Stage 4 in the figure) stages as N1-N3.
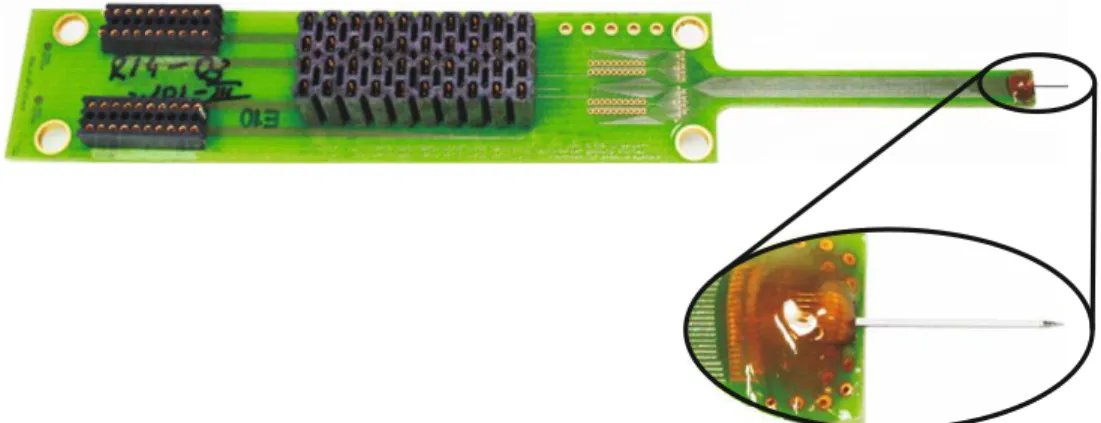
Figure 4: Assembled 4-mm-long active probe shaft and close-up of the probe bonded to a PCB encapsulated by two-component epoxy.
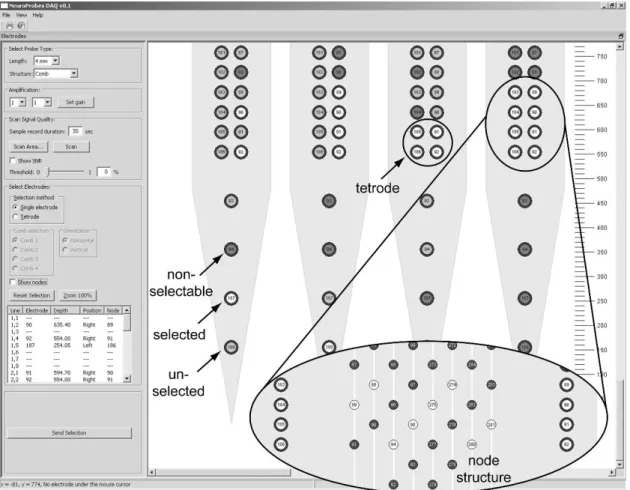
Figure 5: Manual electrode selection: Electrodes can be selected by clicking with the mouse on the electrode. Selected, unselected and non-selectable electrodes are differently color-coded.
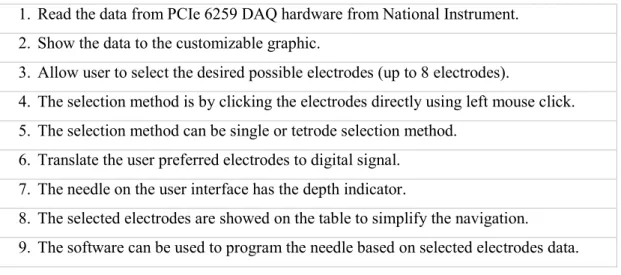
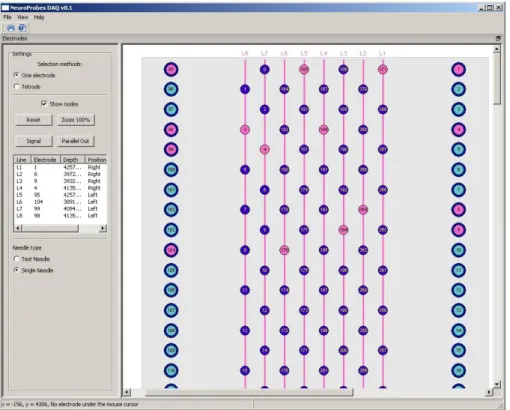
Figure 6: The main User interface from NeuroSelect Sotfware.
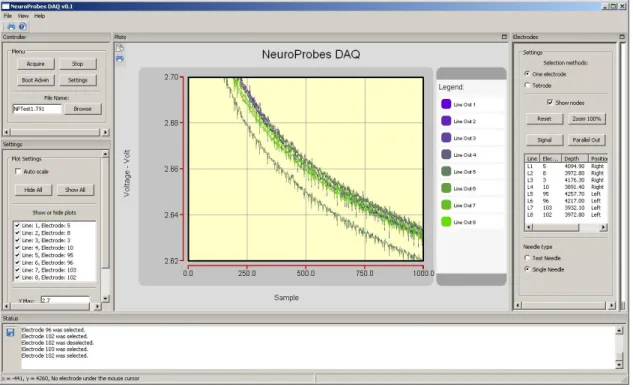
Figure 7: The selection area of the needle where user can select the preferred electrode(s).
Figure 8: The selection area of the needle with the nodes is displayed.
Figure 9: Collaboration diagram of NeuroSelect Software Figure 10: The screenshot of the software and its window objects Figure 11: Screenshot of Anthemion DialogBlocks
Figure 12: Closed-looped system design: (A) Electrode selection is transferred from the host computer via a controller to the microprobe. Neural signals are recorded and visualized. Based on the computed signal quality the electrodes are (re)selected. Selection is achieved via a shift register comprising flip-flops (FF): (B) Elementary cell of switch matrix, (C) single node with switch and FF.
Figure 13: Data visualization and program flow-chart of manual or semi-automatic electrode selection.
Figure 14: Spike detection - Rectangle windows of a width of 1 ms are centred around detected spikes (spikes with negative deflections in this example). Black signal is the underlying ground truth signal, after adding the real noise form the probe the signal in gray is obtained. Spikes need to be detected from this noisy signal, the underlying ground truth signals provides information on the correctness of the detection.
Figure 15: Basic steps of spike sorting. Step i) The continuous raw data is band-pass filtered, e.g. between 300 Hz and 3000 Hz. Step ii) Spikes are detected, usually using an amplitude threshold. Step iii) Relevant features of the spike shapes are extracted, thus giving a dimensionality reduction. Step iv) These features are the input of a clustering algorithm that performs the classification. Adapted from [117]
Figure 16: Implantation procedure; Animals were placed in a stereotaxic frame. Stainless-steel needle ground and reference electrodes were placed on the left and right side of the craniotomy.
The probe was attached to a manual Microdrive through its mounting PCB. The EDC probe was implanted under the surveillance of a surgical microscope, so we were able to verify the depth of the implantation.
Figure 17: (A) Approximate recording position of the 4-mm long, active probe in the cortex.
Close-up of eight roughly equidistant recording locations separated by approximately 300 μ m.
(B) Example LFP traces from the eight recording locations. Rhythmically recurring positive (dark gray) and negative (light gray) half-waves are highlighted. (C) FFT of the LFP spectrum.
(D) Example MUA traces from the eight recording locations. The original raw data were bandpass filtered between 500 and 5000 Hz.
Figure 18: State detection based on MUA. (A) Example MUA trace obtained from raw data by band-pass filtering (500 – 5000 Hz) and rectifying (arbitrary units). (B) Low-pass-filtered (30 Hz) MUA used for state detection. (C) Result of state detection based on the low-pass-filtered MUA in B. (D) Amplitude histogram of MUA envelope.
Figure 19: Up-state locked averages. (A) Up-state locked averaged LFP traces recorded from the eight locations (see close-up in Figure 17A). Amplitude inversion between contacts 2 and 3 corresponding to an approximate recording depth of 600 μ m. (B) Up-state locked averaged MUA traces. Maximal amplitude on contacts 4 – 5 corresponding to an approximate recording depth of 900 – 1200 μm. Light shading indicates downstate; dark shading indicates up-state.
Figure 20: Average time-frequency maps of up-state locked epochs on selected recording channels 1, 3, 5, and 7 separated by approximately 600 μm. See close-up in Figure 17A for distribution of recording channels (1 – 7) along the probe shaft. Increased (light colors) oscillatory activity in the gamma range (30 – 80 Hz) during up-state and decreased (dark colors) spectral activity during down-state in all layers.
Figure 21: (A) Representative SUA traces. (B) Isolated clusters of three units from A. (C) Raster plots of the three isolated units in B. (D) Mean spike waveforms with SD of the three isolated units in B along the eight recording channels (Figure 17A). (E) Autocorrelogram of unit 2 firing.
Inset: burst firing of unit 2. (F) Autocorrelogram of unit 2 firing with longer time scale. (*) marks spindle modulation and (**) marks SO modulation of unit firing. (G) Autocorrelogram of unit 1 firing. (H) Cross-correlogram of unit 1 and unit 2 firing. (***) marks SO modulation in the cross-correlogram.
Figure 22: Phase histograms of three representative unit firings related to the phase of SO. Phase bins are represented on the horizontal axis and normalized firing rates are represented on the vertical axis. Light bars indicate down-state; dark bars indicate up-state. In all three cases, unit firing mostly occurs during up-state, while during down-state only minor unit activity is observed
3 List of tables
Table 1 Main functions of NeuroSelect software Table 2 data structures with brief descriptions
4 Abstract
Despite the rapid advancement of brain imaging techniques offering both high spatial and temporal resolution, recording the electrical activity of the brain with electrophysiological tools is still one of the most widely used methods to investigate the complex spatiotemporal activity patterns of neuronal circuits. Over the past few decades, single-wire electrodes used for in vivo extracellular recording of action potentials (AP) evolved into multielectrode arrays comprising over more than a thousand recording sites [5, 6, 13, 15, 19, 24, 25, 31, 37, 38, 46, 72, 74, 76, 79, 83, 88, 91, 109, 122, 123, 132, 147, 148, 149]. With such a high number of recording sites neuroscientists are able to monitor the activity of hundreds of neurons simultaneously both in anesthetized and in freely moving animals [6, 68, 103, 142], which is fundamental for the understanding of complex neuronal computations and higher-order cognitive functions, such as learning, memory or language [18]. In addition, the reliability and performance of current invasive brain-machine interfaces, aimed to help paralyzed patients to communicate and/or interact with the outside world, significantly depends on the simultaneous recording of the activity of a high number of stable single units [59, 102, 103].
Currently, tetrodes (four closely spaced recording sites) and silicon polytrodes (silicon- based multichannel electrode arrays realized using microelectromechanical systems (MEMS) technologies) are the main workhorses of neuroscience laboratories performing extracellular electrophysiological experiments [6, 13, 15, 31, 83, 92, 101, 130]. Despite the advantage of multiple recording sites, usually these devices need to be physically moved in the brain tissue after implantation to find locations with the best signal-to-noise ratio (SNR). The mechanical positioning of multielectrodes may damage a large number of axons and dendrites and increase the possibility of rupturing blood vessels, which in turn can alter the recorded neuronal activity [154]. Furthermore, recording from multiple brain regions (e.g. investigating the thalamocortical network) may need multiple penetrations from several recording probes, which further increases the severity of brain damage.
This thesis presents the in-vivo validation of an advanced implantable neural probe, i.e., an interface for recording of local field potentials (LFP) and multiple- and / or single-unit neural activity in the brain. It features a significantly increased number of electrodes compared to previous devices, which was achieved by the application of microsystem fabrication technologies and the integration of Complementary Metal-Oxide Semiconductor (CMOS) microelectronic circuitry. The concept of electronic depth control (EDC) enables the electronic selection of individual recording sites from high-density, silicon-based multielectrode arrays with the aid of a dedicated control software [100, 129, 130, 140]. With the recently developed CMOS-based EDC microprobes it is possible to record from a brain region and to fine-tune the
recording position according to the experimental needs without the physical movement of the probe.
The focus of this dissertation is to investigate and implement the configuration, recording, acquisition and basic data analysis infrastructure and evaluate the electrophysiological performance of EDC silicon probes. This brain-implantable probe implements a dynamically reconfigurable voltage-recording device, coordinating large numbers of electronically switchable recording sites. The results show the potential of the EDC devices to record good- quality local field potentials, and single- and multiple-unit activities in cortical regions during pharmacologically induced cortical slow oscillation (SO) in animal models.
5 Introduction
5.1 Preface
At the end of the secondary school I started to think about what is the most important subject to me in the school and which university would be the best to extend my knowledge?
Well, the former was easy: biology. Every part of the living nature is very interesting, from plants to animals, from cells to mammals. I always wanted to know more and more about the mechanisms of life, how the human’s systems work, like blood circulation, digestion, hormonal system and nervous system.
I had another interest that time which started to fill my spare time, called information technology. So, my main problem was that how is it possible to combine my favorite subject with my hobby? The answer was the Faculty of Information Technology and Bionics of Pázmány Péter Catholic University. I was very pleased to admitted to the university and be part of a new community. There were some lectures after the very hard mathematics that enchanted me like neurobiology, electrophysiology or neural prostheses. The university was in a good relationship with some academic institutes and was actively supported almost every scientific work with a help of a scientific advisor. I had a huge opportunity when I was a chance to work at the Institute for Psychology of the Hungarian Academy of Sciences as a scientific student under the supervision of György Karmos and István Ulbert.
The first project I joined was the development of time frequency analysis based software for detailed examination of neural signals. At that time, I felt first the profit of the multidisciplinary approach of electrophysiology. But that was just the beginning, later I had a chance to meet and use cutting edge technologies in the field of neural probes implantation and recording techniques.
Later on, I had the opportunity to work in a project in collaboration with European partners. That time I had a great chance to work at the University of Freiburg, IMTEK, Germany for a few months to participate in a software related study, namely to investigate and implement a control software for a new type of intracortical electrode. That inspired me to continue the work with that specific electrode and associated software through in vivo experiments based on our existing result with other type of electrodes in order to validate the new device and concept.
5.2 Recent applications of neural devices
Neuroscience is a fascinating research field dealing with the complex nervous systems of animals and humans. During the last decades, remarkable progress has been achieved in explaining how the brain processes and stores information. Most of the neuroscientific researches can only be performed by using any technical devices, like brain imaging technique, optogenetics or even electrophysiological devices. Nevertheless, the goal is clear in every case, namely to interface single neurons and neuron ensembles at their different physical domains.
Over the past years, the development of neural devices which were applied in humans in the one hand, have led to increasingly effective treatments and to more precise scientific results, based on neuromodulation through electrical or magnetic stimulation for several neural diseases.
Among many examples, one of the most successful applications of neuromodulation is deep brain stimulation, which reduces the symptoms of different diseases, like Parkinson [93, 146]
or Tourette syndrome [146], not to mention epilepsy [73] and severe depression [146]. On the other hand, some technical devices support the neural restoration of a lost function with an interface to the nervous system, called neural prosthesis. These devices have been developed to restore different sensing disorders, like hearing with cochlear implant, just to mention the best- known one.
Another interesting application of neural prosthesis is brain machine interfaces (BMI).
The fundamentals of BMI are to record neural signals and transform it to a communication form or movement, which helps to keep the patient in contact with the outer world or to be closer to a normal human life. The neural activity can be recorded non-invasively along the scalp using electroencephalogram (EEG). This type of BMI can be useful when a patient suffering from locked-in syndrome (e.g. Amyotrophic Lateral Sclerosis) wants to write a letter on a computer.
There are several methods to apply event related potentials (ERP) for BMI connection. Semantic anomaly (N400), P300 and contingent negative variation (CNV) are the mostly used ERPs [151]. The sensorimotor rhythm (SMR) is another brain wave rhythm, which is used for BMI.
During motor imagery, the deliberate modification of the SMR amplitude can be used to control external applications [102]. However, with these non-invasive methods, the size of the recording area is relatively big which represents an averaged activity of huge number of neurons, resulting in inaccurate and slow control of several activities.
In contrast to non-invasive methods, the electrode sites can be implanted invasively into specific brain regions providing a better spatial and temporal resolution. Implanted BMI using microelectrode arrays in humans have allowed patients to move an artificial limb, i.e., a robotic arm [22, 102, 128]. Because the motor movements are represented in a distributed, highly redundant way in several cortical and subcortical areas, the extraction of different motor-control
parameters can be available with this technology. The question is how many neurons are enough to record for modelling a function (e.g. movement) and where is the location exactly from where we can record the appropriate neural activity and finally, how much the recording will be stable over time?
5.3 Brain stimulation and neural activity recording
In view of the abovementioned technologies, stimulating the brain or recording the activity of the complex nervous system is of supreme importance for neuroscience and clinical applications as well. Communication between neurons is based on electrical and chemical signals, which can be directly recorded or stimulated by neural interfaces. Currently, recording brain electric activity is the best-established interface to the nervous system. Different types of electrodes with different degrees of invasiveness and resulting spatial resolution can be used for this purpose.
Based on recent technologies, there are two possibilities for interfacing the cerebral nervous system: directly or indirectly. Direct and indirect methods can be additionally classified with respect to the interfacing physical domain. Direct interfacing can be a recording or a stimulating technique. The intracerebral interfaces dealt with in this dissertation belong to the direct recording of the cerebral nervous system. The indirect interfaces and direct stimulation of the brain is not part of the thesis even though at least as exciting fields as direct recording of brain electrical activity.
6 Cortical neural circuitry
The first part of this chapter gives an outline of the fundamentals of neurophysiology from the neuroanatomy of the brain to mechanical properties of the brain tissue and the micromotions of the brain. In addition, it gives an outline about the generation and propagation of AP. Then, in the second part of the chapter I will present recent brain electrical activity recording techniques and generation of EEG signal related to the topic of this dissertation.
6.1 Neuroanatomy of the brain
The cognitive functions of the brain are localized primarily in the cerebral cortex. The cerebral cortex is the outer layer of the brain tissue. Among others it plays a major role in consciousness, attention, language, awareness, thought and memory [70]. The nervous system has two classes of cells: nerve cells which are electrically active and glial cells, which are inactive cells. Nerve cells are the main signaling units of the nervous system, they have dedicated, morphologically defined regions with distinct role in the generation of signals and the communication of signals between neurons. These are the cell body, dendrites, the axon and the presynaptic terminals. The electrically inactive glial cells surround the cell bodies, axons and dendrites of neurons. As far as is known they are not directly involved in information processing, nevertheless they support neurons in different ways, such as producing myelin used to insulate neurons or promoting efficient signaling between neurons by taking up chemical transmitters released by neurons [70].
The cell body, or so called soma of the neuron is the metabolic center of the cell, it contains the nucleus, which is the production site of most of the neuronal proteins. The soma in general takes place between several short dendrites and a long, tubular axon. Dendrites usually branch-out in tree-like fashion and they are responsible to receive signals from other nerve cells.
In contrast, the axon extends away from the cell body and at the axonal end the output of the neuron is synaptically connected to the neighboring neuron. Most axons of the central nervous system are very thin: 0, 2 – 20 µm in diameter.
Rats, applied as animal model for in-vivo experiments in this dissertation, have about 21 million neurons in the neocortex [78]. In contrast, humans have impressive average numbers of neocortical neurons: 19 billion in female brains and 23 billion in male brains [111]. Each of these neurons forms thousands of connections with other neurons, building huge neural networks [70]. Despite the big difference in case of number of neurons, the neurons average
densities in rat and humans are quite similar with about 55,000 and 40,000 neurons/mm3, respectively, depending strongly on the neocortex layer and area [1, 82, 118].
Neurons are also commonly classified into three different types by their functions:
sensory, motor, and interneuron. Sensory neurons are responsible for transporting information from the peripheral region of the body into the nervous system for the purpose of both perception and motor coordination. Motor neurons carry commands from the brain or spinal cord to muscles and follicles. Interneurons are the largest class, consisting of all nerve cells that are not classified as sensory or motor types. Interneurons are divided into two subclasses. Relay or projection interneurons have long axons and transport signals over significant distances, from one brain region to another. On the other hand, local interneurons have shorter axons and process information locally [70].
The rat’s neocortex is about 2 mm thick; the top layer of the cerebral hemispheres is slightly thicker in humans with values between 2 and 4mm and made up of six layers with a vertical column structure of neural cells in mammals [1, 61, 96, 114, 127]. While the neocortex is smooth in rats and some other small mammals, it has sulci and gyri in primates and several other mammals. The mammalian brain is intensely folded to increase the area of the cortex and arranged in six layers with a vertical column structure of neuronal cells, called cortical columns.
These cortical columns encode similar features. In case of humans, they have a diameter of 300 - 600 μm with about 105 neurons. Each cortical column is formed by minicolumns bound together by short-range horizontal connections, consists of microcolumns with a diameter between 40 and 60 μm and about 80-100 neurons which form microcircuits [84, 96]. There is a variety of other brain structures which were not relevant in this dissertation. For further study of neuroanatomy, related literature may be consulted [70, 116].
6.2 Mechanical properties of brain tissue
Brain tissue is a structurally and mechanically complex material with a highly nonlinear, strain-rate sensitive viscoelastic behavior [10]. It consists of gray and white matter with a Young’s modulus of E = 66.7 kPa and a Poisson’s ratio of ν = 0.499, i.e., it is nearly incompressible [144]. Young modulus is a substance specific constant, which gives information about the stiffness of the substance. The brain is surrounded by the meninges. The subarachnoid space lies between the arachnoid and the pia mater, which, together with the dura mater, form the three meningeal layers that cover the brain. Within the subarachnoid space, fluid flows down the spinal canal and also upward over the convexity of the brain. The main function of meningeal layers is the mechanical protection of the brain against the skull particularly during head shocks.
The major brain supplying arteries flow through the subarachnoid space where they give rise to branches that penetrate the substance of the hemispheres. The dura mater, which is the outermost
layer of meninges, is attached to the inner surface of the skull. It is a tough and fibrous membrane with a thickness of 0.3 - 0.8mm in humans. The dura mater has the highest Young’s modulus of meninges with E = 31.5MPa [155]. The middle layer of the meninges is called arachnoid because of spiderlike processes and is attached to the dura mater. The innermost layer of the meninges is called pia mater that closely overlies the surface of the brain. The pia mater has the lowest Young’s modulus of meninges with E = 11.5MPa, mainly because it consists of only three cell layers.
6.3 Brain micromotions
The micromotions of the brain can be originate from vital physiological functions and head movements [44]. The intracranial pressure is influenced by physiological functions, i.e., respiratory and beating of the heart. In case of anesthetized rats with performed craniotomy, resulting pulsatile surface micromotions of the brain was observed to be in the order of 10 - 30 μm due to pressure changes during breathing and 2 - 4 μm due to cardiac pulsation [44].
However, when the skull is closed, then the pulsation is reduced. Lateral motions also occur in the brain due to head accelerations, which mainly causes rotational brain movements.
6.4 Action potential generation
In this chapter the reconstruction of AP is derived based on Hodgkin and Huxley’s equation. Neurons can carry signals over long distances because of their ability to generate AP, so the communication of neurons is based on APs, so-called spikes, which are regenerative electrical signals whose amplitudes don’t attenuate as they move down the axons. The Hodgkin - Huxley equation is a mathematical model that describes the mechanism of an AP of a neuron, i.e., how APs are initiated and propagated. From their experiments, they could construct a detailed mathematical model of the sodium (Na+) and potassium (K+) conductance changes. The goal was to determine whether these conductance changes alone are sufficient to produce an AP. Their mathematical reconstruction showed that they could in fact generate the form and time course of the AP with high accuracy (Figure 1). The voltage of a neuron membrane is influenced by the signals of the adjacent neurons contacted via synapses and dendrites. Chemical synapses are based on the secretion of inhibitory and excitatory neurotransmitters in the presynaptic neuron. These neurotransmitters diffuse across the synaptic cleft with a width of 20 nm and bind to the receptor site on the postsynaptic membrane [57]. Synaptic events change the membrane potentials in the postsynaptic dendrites and somata, called postsynaptic potentials.
Depending on the function of the synapse, the potential is called excitatory postsynaptic
potential (EPSP) or inhibitory postsynaptic potential (IPSP). When a threshold input potential of -55mV is exceeded, voltage-gated Na+ channels of the neurons open. The Hodgkin – Huxley model showed that the selected increase in Na+ conductance is responsible for AP initiation.
The increase in Na+ conductance causes Na+ to enter the neuron, thus depolarizing the membrane potential, which approaches the equilibrium potential of Na+ (55 mV). The rate of depolarization subsequently falls both because the electrochemical driving force on Na+ decreases and because the Na+ conductance inactivates. At the same time, depolarization slowly activates the voltage-dependent K+ conductance, causing K+ to leave the cell and repolarizing the membrane potential toward the equilibrium potential of K+ (-90 mV). Because the K+ conductance becomes temporarily higher and Na+ conductance becomes lower than they are in the resting condition, the membrane potential actually becomes briefly more negative than the normal resting potential.The hyperpolarization of the membrane potential causes the voltage- dependent K+ conductance (and any Na+ conductance not inactivated) to turn off, allowing the membrane potential to return to its resting level. Under consumption of ATP, the energy source of the cells, the sodium and potassium ions are finally transported back into their original media.
Nevertheless, the above-mentioned transport back mechanism does not play a critical role in the generation of the next AP by itself, because the ions, exchanged under an AP, cover only a small fraction of the accumulated concentration difference. It follows that, a single neuron can emit several APs without the long-term recovery activities of the pumps.
Figure 1: Mathematical reconstruction of the AP. Reconstruction of an AP (black curve) together with the underlying changes in Na+ (red curve) and K+ (yellow curve) conductance. The size and time course
of AP were calculated using only the properties of membrane conductance of Na+ and membrane conductance of K+ measured in voltage clamp experiments. After [60]
6.5 Propagation of the action potential
Once an AP is generated at one point of the neuron, how does it propagate to the synaptic terminal? The electrical current depolarizes the adjacent region of the axon membrane. As the charge moves to the adjacent region of the axon, it will depolarize too. If it will depolarize efficiently, voltage dependent Na+ channels in the adjacent regions will be opened and a new AP will be generated, so AP regenerates itself while the refractory time prevents the AP from traveling back along the axon. In fact, the propagation velocity of the APs in nerves can vary from less than 1 meter per second to more than 100 meters per second. In case of myelinated nerves, the propagation of AP is different. Myelin turns off all the voltage-dependent Na+ channels, so the AP can not propagate actively. Rather, the potential change produced by the AP at one node (called node of Ranvier) spreads in the internodal region along the axon passively, allowing a saltatory propagation of the AP, resulting increased velocity. Although, myelin insulates the membrane though, in the nodes of Ranvier have the greatest density of the voltage dependent Na+ channels and have also the greatest active currents, which contribute to the extracellular action potentials (EAP), such as the capacitive currents [45]. During the initiation of an AP, the soma can be depolarized as well. This depolarization can spread towards the dendritic tree where there are voltage gated Na+ channels and it can result in the propagation of dendritic AP, called backpropagation and believed to be responsible for synaptic plasticity [7, 16, 53].
6.6 Non-invasive recording methods
The analysis of bioelectrical signals of the brain is a non-invasive or invasive method to investigate cerebration. EEG is a method that measures and records the oscillations of brain electric potentials recorded from special sensors, called electrodes, attached to the scalp and hooked by wires to a computer. The electroencephalography is also a clinical examination.
The recorded brain electrical signals are transmitted to several amplifiers, filters, and finally displayed on paper chart or computer monitor. EEG technique is discovered by Hans Berger in 1924. He described the alpha wave, which is measured from occipital areas of the brain during wakefulness when the subject’s eyes were closed. He also observed that alpha waves disappeared when the patient’s eyes were opened again [8]. Perhaps Berger’s discovery was a huge step forward in electrophysiology, yet that time his findings did not gain widespread acceptance in the scientific community but by 1937 he gained the approval of Lord Adrian, who, as a psychologist, took a particular interest in alpha waves [71].
Recently EEG and magnetoencephalography (MEG) are the most popular non-invasive technologies with acceptable temporal resolution to follow the fast-dynamic changes in the brain. Otherwise, the spatial resolutions of EEG and MEG are low, relative to other brain imaging techniques like magnetic resonance imaging (MRI), computer tomography (CT) and positron emitted tomography (PET). Every electrode of the scalp EEG records electric potentials from a relatively large brain area, which are generated in tissue with up to one billion neurons in the cortical layer. [108]
Therefore, scalp EEG activities are showing the summation of the synchronous activity of thousands or millions of neurons with similar spatial orientation. Ions of cells with different spatial orientation do not line up and create waves to be detected. One good example is that the Pyramidal neurons of the cortex are known as the most responsible cell type in the brain which activities are present in the EEG signal, mostly because they are fire together and well-aligned.
It is more difficult to detect neural activity from deep sources than currents closer to the skull, because voltage fields fall off with the square of distance [77].
6.7 Invasive recording methods
The electrodes of electrocorticogram (ECoG) record the same signal as in EEG, with closer proximity to the brain. ECoG electrodes are surgically placed on the surface of the cortex.
In addition, with the elimination of the insulating part of the skull and dura, recording signals result in greater signal amplitude, wider detectable frequency range, and better topographical resolution [17].
If we are moving towards to a better space resolution, intracortical methods can be a good solution to record LFP and neuronal APs. These intracortical methods are the most invasive, since they record electrical activity from electrodes implanted in the brain (Figure 2).
Thus, compared with traditional EEG, ECoG and intracortical recordings also provide wider frequency range, higher topographical resolution and better signal quality. However, both methods are invasive, and tissue damage, infection, and long-term recording instability can make more difficult their usefulness [59, 152].
Basically, two main groups of invasive electrophysiological recording techniques are known. These are the extracellular and intracellular recording techniques. In the next paragraphs these techniques will be presented in order to better understand later the goals of the EDC probes.
Figure 2: Brain electrode types; the figure shows the place of recording from scalp to intracellular level (from left to right). The 2nd line shows the recorded signal. The second line from the bottom represents
the size of the area from which an electrode records the sum of the signals. The last line shows the amplitude of the signal [27].
6.7.1 Extracellular recording techniques
As the name of the group suggests, the extracellular recordings take place in the extracellular space. These techniques serve to record many neurons’ activity (population activity). This technique measures field potentials which is the sum of the transmembrane activities. We can measure the AP activity of cells, which is single or multiunit activity. If we are very close to a cell, then we can measure its single unit activity, which is the AP of the neuron [18, 120].
The type of the measuring electrode can be micropipette, wire electrode with one contact, multi wire electrode (tetrode, multielectrode) or silicon based multielectrode.
With these types of electrode, we cannot detect APs obviously (Figure 2). The voltage at the electrode conductor depends on the strength of the field and thus the proximity of the electrode to the field source. This capacitive source is tipically small, on the order of few hundred microvolts, meaning that the recording system needs to be very sensitive, and the electrical noise poses a significant challenge, not to mention the high number of neurons around the electrode in the extracellular space. High electrode impedance can also cause problems for recording APs. [120].
6.7.2 Intracellular recording techniques
Intracellular recordings, as their name reflects to it, are measuring from the cell. For that, somehow we have to penetrate into the cell. In this case, single neuronal activity, or in
some cases a few neurons’ activity can be measure in parallel. We measure directly the synaptic and membrane potential activity of the cell. In addition, we can measure the ion channels and membrane currents, even only one ion channels activity. And we can add chemical materials under the measurement [50, 120].
The used electrode type is often micropipette; the MEMS based electrodes are very rare today.
6.8 Origins of the brain electrical signal
Although, we discussed above the available technologies for measuring brain electrical activities, we have not mentioned yet, what do we record when we use these methods? Because in this dissertation we are focusing on intracranial brain electric activity recording techniques, in this chapter, I try to summarize the origins of the brain electrical signal in short.
The EEG gives an appropriate window on the mind, revealing synaptic activities of neural cells that are in good relations with brain states. Most of the EEG signals are generated in the cerebral cortex, believed liable for our behavior, individual thoughts and emotions. The characterization and quantification of the population activity of neurons can do with the help of field potentials. The synchronously active neurons’ membrane currents flow through the extracellular space and the potential changes are measurable with a proper electrode. The EEG is one of the most commonly analyzed field potential. Potential waves of different frequencies originated from the cerebral cortex can be registered with electrodes placed on the scalp or the surface of the cortex. The some 10 µV macropotential waves are primarily generated by the slow potential changes of dendrites and somas. Under the synaptic activity, positively charged ions, that are moving to the inner part of the cell are generating negative current (sink) and, as a result of charge conservation, positive ions flow out from the other side of the cell, which process is called positive current (source).. These two currents together create a dipole and the circuit closes through the extracellular space. The main sources of the EEG signal are the slow synaptic potential changes (EPSPs and IPSPs) and non-synaptic currents such as post hiperpolarizatons evoked by bursts. APs do not play an important role in the genesis of EEG, since they summed difficultly because of their short duration (< 2ms) and only small membrane areas are affected during their formation. The extracellular space of the neural tissue does not conduct high frequency electrical waves well, which prevents the cumulation of high frequency signals in space. The geometry of neurons is important in the genesis of the EEG, as well. The cell with concentrically placed dendrites does not generate macropotential change, because dipoles in different directions cancel each other. The places from where we can registrate the
best field potentials are the ones which contains long-drawn shaped cells, like in the cortex or hippocampus, where big pyramidal cells have this kind of morphology. The potentials of individual cells have very small amplitudes, the requirements of their registration are on one hand the superponation in space and time of numerous cells’ potentials and on the other hand the appropriate degree of amplification. Synchronization means the fluctuation of membrane potentials in the adjacent cells collated in time. Conversely, if the neurons’ electrical activities are not coordinated in time, then signals of individual neurons mostly cancel each other out, which mechanism is called desynchronization. At this time, small amplitude and high frequency waves are dominant in the EEG signal [105, 108]. The waves are different in every state of vigilance. The typical patterns of sleep will be discussed later.
7 Properties of sleep
In this chapter I will summarize the main fuctions of sleep and sleep stages, focus on the deepest sleep stage, walking around the properties and generation of this stage.
7.1 Sleep – in general
Although at first look it is obvious what sleep is, it remains difficult to define it or simply put it into definitive terms. As the American Sleep Association defines, sleep in general is:
„a normal active state of all living creatures in which the mind and body are less responsive. It is believed that sleep is a restorative process.”
Or in other words which is more specific:
„The definition of ‘sleep’ is that it’s a naturally recurring state of mind that’s characterized by altered consciousness, the inhibition of almost all
voluntary muscles, generally inhibited sensory activity, and a marked reduction in our interactions with our surroundings.”
We spend about a third of our lives in unconscious, unprotected and vulnerable state.
Perhaps strong or important stimuli can wake up from this state; it is undoubtedly full of dangers.
Nonetheless, we still cannot know why do we sleep, what happens exactly when we sleep, how much do we sleep and why do so many people have sleep problems? It must be very important, because sleep deprivation can be as painful as torment. Sleep is necessary and can be observed in most of the mammals and birds. Though there are some exceptions, sleep is associated with special EEG patterns. The behavioral properties of sleep are complex: rapid reversibility, place preference / specific position, increased arousal threshold, homeostatic regulation, and often circadian regulation [14].
Sleep research is conducted in three different directions: homeostatic -, daily rhythmic- and neural regulation. These are mostly independent research areas.
Homeostatic regulation is based on the search for sleep factors, effects of sleep deprivation and the function of sleep. Daily rhythmic regulation is about the measurement of activity and rest, alignment to the outside world and the biological clock. Neural regulation of sleep is measured by electrophysiological methods. It is examining the waking systems and sleep centers of the brain and try to explore the relationship between the alertness and EEG. In this dissertation, I only focus on the latter research area.
7.2 Sleep stages
Sleep can be divided into different stages, which follow a specific pattern in animals and humans alike, though the duration and properties of these stages may vary from species to species.
In general, sleep can be divided into two types, which are rapid-eye-movement (REM) sleep and non-rapid-eye-movement (NREM) sleep. REM sleep, often called "active sleep," on a human EEG is recognizable by its characteristic high-frequency (fast), low-amplitude (small) waves, as well as the eye movements for which it is named. During sleep, we usually go through five phases of sleep which consist of N1-N3 (N4) and paradoxical sleep states (Figure 3). In humans, during stage N1, which is light sleep, we drift in and out of sleep and can be awakened easily. Our eyes move very slowly and muscle activity slows. People awakened from stage N1 sleep often remember fragmented visual images. Many also experience sudden muscle contractions called hypnic myoclonia, often preceded by a sensation of starting to fall. These sudden movements are similar to the “jump” we make when startled. When we enter stage N2 sleep, our eye movements stop and our brain waves (fluctuations of electrical activity that can be measured by electrodes) become slower, with occasional bursts of rapid waves called sleep spindles. In stage N3, extremely slow brain waves, called delta waves begin to appear, interspersed with smaller, faster waves. By stage N4 in the old nomenclature, the brain produces delta waves almost exclusively. It is very difficult to wake someone during stages N3 and N4, which together are called deep sleep. Eye movement and muscle activity dissapear. People awakened during deep sleep do not adjust immediately and often feel groggy and disoriented for several minutes after they wake up [135]. From 2008, the American Academy of Sleep Medicine (AASM) has discontinued the use of stage four (N4),such that the previous stages N3 and N4 now are combined as stage three (N3). An epoch (30 seconds of sleep) which consists of 20% or more slow-wave sleep now is considered to be stage three (N3) [67].
Figure 3: Different stages of NREM and REM sleep (Illustration). Note that in the new nomenclature there is no stage 4. We mentioned NREM (Stage 1 – Stage 4 in the figure) stages as N1-N3.
In all mammals and many other animals, sleep can be defined in much the same way that we define sleep for humans. However, there are some notable differences among species.
When humans sleep, the entire brain is involved. On the other hand, whales and dolphins, need to maintain consciousness while they sleep so they can occasionally come to the surface to breathe. In these marine mammals, sleep occurs in only one hemisphere of their brain at a time—
allowing for some degree of consciousness and vigilance to be maintained at all times. In the next chapters, only the slow wave sleep (SWS) phase of sleep is detailed.
7.3 Slow wave sleep and slow oscillations
SWS is considered the deepest phase of NREM sleep, dominant during the first half of the night. It is accompanied by maintained muscle tone, higher threshold of arousal, and high- amplitude, low-frequency (< 2Hz) waves on the EEG [133-135].
Delta waves during sleep were reported in 1937 by Blake and Gerard [12], but SO, the main characteristic electrophysiological features of deep sleep were first described in anesthetized cats by Mircea Steriade in 1993 [134]. They later detected SO in other mammals and humans, too [2], during various arousal states like anesthesia, natural sleep [34], and quiet wakefulness [115] Furthermore, Slow oscillation (SO) can be induced in slices, too [125].
In animal models, during anesthesia, the membrane potential of the cortical neurons is measurable under SO. These measurements showed that SO consist of the alternation of two states in the membrane potential of cells: an active, depolarized state, during which the membrane potential is closer to the firing threshold and neurons generate APs (also called up- state), and an inactive, hyperpolarized state, during which the membrane potential is more negative with virtually no firing (down-state) [137]. The cortical LFP recorded in cats with a laminar extracellular electrode is positive superficially during up-states that turns into negativity in deep layers. During down-states a superficial negativity and deep positivity can be detected.
During up-states, fast oscillations emerge, while during down-states they disappear.
In human SWS, the alpha and beta power is increased during the surface positive half- wave (up-state) compared to the surface negative half-wave (down-state), suggesting that their basic neurophysiology may be similar to animal findings [89, 94]. While the SO in animals is limited to below 1 Hz [134], the recent AASM guidelines suggest the 0.5 - 2 Hz range for SO in humans [67].
The fine scale laminar structure of neuronal activity was analyzed in ferret slice preparations, revealing that firing during the up-state is the earliest in the infragranular layers and spread towards the superficial layers with a long ~100ms inter-laminar delay [125]. In intact animals, the up-state onset related initial firing, intracellular membrane potential and LFP changes could be detected in any layer in a probabilistic manner, with a short inter-laminar delay (~10ms), however, on average, the earliest activity was found in the infragranular layers [23, 124]. Subthreshold membrane potential fluctuations giving rise to LFPs clearly precede neuronal firing at up-state onset, thus, firing may be the consequence rather than the cause of up-state initiation [23].
Current source density analysis revealed that the low frequency (<1 Hz) components of the anesthesia induced SO in cats displayed a massive current sink in the middle layers (most probably layer III-VI), confined by two sources in superficial and deep layers, while fast oscillations (30-40 Hz) were more distributed, composed of alternating microsinks and microsources along the whole cortical depth [136].. During spontaneous and evoked SO-like events called the K-complexes, a massive up-state related sink was reported in layers II-III besides weaker ones in the deeper layers [3]. In still another cat study, the maximal sink during the up-states in natural sleep was located in the middle and deep layers [23]. In the rat primary auditory cortex, the laminar distribution of the major up-state related sink was variable [124].
On average across animals, it was located in middle and deep layers (most probably layer III- V) in natural sleep, whereas it was located in superficial layers (most probably layer II-III) under urethane anesthesia [124]. Although the cellular and synaptic/trans-membrane mechanisms of
slow waves during natural sleep are thus under intense investigation in animals, these mechanisms have not previously been studied in humans.
Up-states are proposed to be micro-wake ‘fragments’, similar to the activated state of waking [35], while down-states are considered silent states filtering stimuli to the cortex.
Other important role of SO is consolidating engrams to the facts, or in other words, memory consolidation during SWS, which effect can occur in a particular, well defined region of the brain locally [145]. The neural mechanism of memory consolidation may be probably varied. One neural mechanism is the so called synaptic homeostasis model, where those synaptic connections remain in SWS, which reached a certain weight, while synapses with lower weight will disappear. So, the consolidated synaptic connections will be stronger and more stabile [145]. For strengthen connections between neural cells, the other important factor might be the reactivation of those neural cell ensembles in sleep which are in connection with the memory traces formed in awake state. Recent studies showed that SO can induce long term plasticity in the thalamocortical system [23, 137]. Another possible way for memory consolidation during sleep might be the cortico- hippocampal interaction [94].
7.4 Generators of the slow oscillation
SO can be detected in several brain structures: all neocortical areas (in all types of neurons and glia cells), thalamus (in thalamocortical and reticular neurons as well), hippocampus [95], basal ganglia [141] and in cerebellum driven by the neocortex [121].
Despite, SO is traditionally considered an oscillation generated by neocortical networks.
The main arguments for its neocortical origin are that it is present in the neocortex after thalamectomy [134], but absent in the thalamus after decortications [138], and the disconnection of intracortical synaptic linkages results in the disruption of its long-range synchronization [4].
Recently, the pure neocortical origin of SO has been disputed. Crunelli and Hughes pointed out the crucial role of thalamus in the generation of SO [28]. They argue that SO in isolated cortex was not identical to those present when all connections were intact; and SO can be detected in thalamic slices if the metabotropic glutamate receptors (mGluR) of thalamocortical or reticular neurons were activated. They suggest that SO can be generated in three structures:
- cortical circuits (due to synaptic network properties),
- thalamocortical neurons (intrinsically, depending on glutamatergic input from the cortex),
- reticular neurons (intrinsically, depending on glutamatergic input from the cortex),
and the interplay of these oscillators is necessary for the full manifestation of SO. Furthermore, they mention the observation that high-frequency (150 - 300 Hz) bursts of thalamocortical neurons mediated by a low-threshold Ca2+ potential consequently precede the firing of cortical cells and the depth-negative peak of the LFP in the cortex. This could point to that the generation of up-states thus may be triggered by thalamic input.
Other theories for the activation of persistent sodium current that is essential for up-state initiation [87] include spontaneously occurring coincidence of mini EPSPs or the action of some neurons that have a slightly lower spiking threshold. But subthreshold membrane potential fluctuations clearly precede neuronal firing at up-state onset, thus, firing may be the consequence rather than the cause of up-state initiation [23].
Mechanisms generating and maintaining down-states are also debated. Input resistance was found to be the highest during the down-states and lowest during the early part of up-states, increasing until its end [36]. Furthermore, during down-states, inhibitory neurons are silent, too.
Thus, instead of an active inhibition, the hyperpolarization is thought to be the result of disfacilitation i.e. the lack of firing of input neurons [26], or the buildup of activity-dependent potassium conductances [125] or both [58]. K+ currents are believed to be the main factor in generating down-states since the application of Cs+ acetate, nonspecific intracellular blocker of K+ currents, reduces hyperpolarization up to disappearance [139]. However, it has been shown that GABAB has an important role in terminating up-states [86]. Indeed, the observation that the onset of down-states is synchronized more precisely than the onset of up-states suggests a long- range synaptic mechanism [143].
Experiments on cats and rats anesthetized with urethane or ketamine/xylazine revealed a slow cortical activity similar to that observed during natural SWS [23, 26, 47, 48, 85, 131, 133, 134, 143]. Anesthesia-induced SO appears more regular than SWS [134, 150], and its frequency was higher with ketamine/xylazine than urethane anesthesia [131, 134] indicating that properties of SO are not fixed, but depend upon experimental conditions. Recordings from different cortical areas show a preferential origin of slow waves at specific locations [89, 143, 80, 106], suggesting regional specificity.
Ketamine-xylazine anesthesia is extensively used as a model of sleep SO. The differences between patterns of slow waves in LFP observed during SWS and anesthesia in different cortical areas were corroborated by results of intracellular recordings. However, during anesthesia the SO appears to be more rhythmic. Furthermore, during anesthesia the SO was of overall higher amplitude and the silent states were of longer duration than in SWS [23].
7.5 Reactive properties of sleep
SOs occur spontaneously during anesthesia and deep natural sleep, but they can be evoked by external stimulation, too. K-complexes can be evoked during sleep by sensory stimuli, and though the mechanisms underlying their generation are likely similar to those of the hyperpolarized phase of SO [20], they are isolated phenomena not constituting an ongoing oscillation that may distinguish them from the fully developed SO. It has been shown that sound stimuli can entrain the SO in the thalamus [43, 51], furthermore, SO can be induced by transcranial magnetic stimulation (TMS) in humans [90], and by electrical stimulation in rats [110, 145] and humans [40].
Massimini et al. showed that slow waves triggered by TMS resemble spontaneous waves in their morphology and propagation properties [90]. Every TMS pulse evoked a slow wave that started under the stimulator and spread over the scalp. Interestingly, while slow waves could be evoked in any phase of NREM sleep, either local (indicating the breakdown of connectivity during sleep) or global (an aspecific response), responses during waking were long-range and specific, with a low-amplitude, complex wave shape.
Entz et al. showed in humans that slow waves can be evoked by cortical electrical stimulation and characterized the laminar profile of evoked waves [40] . They showed that the LFP, MUA, spectrogram, and current-source density attributes of intracortical responses are similar to those measured during natural SO. Responses triggered in different vigilance states (awake, sleeping, and anesthetized) differed only in the amplitude and latency of evoked potential components derived from subdural electrodes [40].
8 Advances in electrode fabrication
In this section I will present recent brain implantable electrode technologies, including their fabrication processes and technological barriers.
8.1 From hand assembled electrodes to MEMS based probes
The scientific need for multiple-site brain electrical activity recording capability fueled the elaboration of various multisite voltage-recording microelectrode probe arrays. Different technological solutions have been reported to implement these devices depending on the user demand, brain area to explore, and experimental approach. Manual construction technologies, such as wire-based probe assembly, were used earlier to build probes and record neural signals with many sites in acute or in chronic experiments.
Although these manual technologies are considered to be outdated, there are still many laboratories using hand-assembled stereotrodes [91], tetrodes [109] [147], and other micro-wire bundle arrays [72, 79]. The reason for their continuing usage is mostly because of the convenience of their construction, their durability, and the possibility to physically reconfigure the location of the wire-based probes with respect to the brain tissue, if experimental needs require it.
In the last decades, MEMS technology became expedient enough to take the technological lead in constructing brain-implantable devices [148]. As the most commonly used carrier material of these probes is silicon (Si), they are called nowadays the silicon probes [19].
Well-known silicon probes include the Utah electrode array (UEA) [19, 9] and the Michigan probes [148, 13, 31], as well as neural probes developed at the California Institute of Technology (Caltech) [38, 39] and by the consortia of the European projects NeuroProbes [100, 123] and its extension NeuroSeeker [122]. In the next pharagraphs I will summarize the main properties of the abovementioned silicon probes.
8.2 Utah Electrode Array
The UEA is a silicon-based monolithic structure designed for use as a multichannel interface to the central nervous system. The UEA consists up to 128 silicon needles in various configurations carrying a single electrode on each tip. The standard electrode lengths are between 0.5mm – 1.5mm and have a pitch of 400 μm depending on the experimental need [19].
Electrode site metal options can be made of platinum or iridium oxide. Electrodes are sputter
deposited on the needle tips while the needles themselves are isolated by parylene-C. The UEA electrode arrays are commercially available from Blackrock Microsystems (Salt Lake City, UT, USA) [11].
The probe length of the UEAs is limited by the silicon wafer thickness. Recently, the longest probe length is only 1.5 mm. Further, each probe shaft contains only one recording site and the fabrication process suffers from low production rates because of atypical batch process.
The interconnection of the UEAs is made of a set of gold wires insulated with polyimide. It is bonded on the back of the array to a set of aluminum read-out pads ultrasonically. The rigidity of the metal wire bundle makes UEAs inappropriate for chronic implantation in human brain [49].
8.3 Michigan Probe
In contrast with UEA, Michigan probes comprise slender needle-like probe shafts consisting of multiple planar electrodes on the surface of the shaft. Depending on the experimental application, the standard array site layouts can be linear, edge, tetrode, polytrode and multi shank. The standard Michigan probes have a thickness of 15 μm or 50 μm which varies by design, length of 2, 3, 4, 5, 6, 10 or 15 mm, and width of 123 - 145 μm at the base narrowing to 125 - 19 μm at the tip [37, 69]. The probes comprise Iridium (standard), Platinum (custom) or Gold (custom) electrodes, gold bonding pads and polysilicon interconnecting lines.
The recording sites have sizes between 25 and 1250 μm2with spacings in the range from 20 to 200 μm [37]. Probes with four [113], eight [75, 113, 153], sixteen [18, 31] and thirtytwo [69]
electrodes per shaft have been fabricated, reaching up to 256 channel count with 3D matrix array or 2D Buzsaki probe with 32 recording sites on 8 shanks. The increased number of electrodes has been achieved by reducing the width and space of the interconnecting lines between the electrodes and connector part down to 1.5 μm defined by the lithography step. However, the increased number of electrodes results in large connector bases and printed circuit board (PCB).
The Michigan probes are commercially available in various configurations with single and multiple shafts from NeuroNexus (Ann Arbor, MI, USA) [99].
Michigan probes have been successfully used in several neuroscience applications since decades, but they also suffer from some disadvantages, related to probe thickness and durability, in one hand. The typical probe thickness of Michigan probe is 15 μm. These probes when inserted through the meninges of the brain needed special insertion tools. Mechanical weakness of the probes may result in probe fissures and fractures and may cause severe brain tissue damage during insertion. On the other hand, the fabrication process for Michigan probes
typically involved anisotropic etching with ethylene diamine pyrocatechol and using boron etch stop technique, which is incompatible with on-shaft integration of CMOS circuitry.
8.4 NeuroProbes and Caltech Probes
In case of NeuroProbes [54, 56] and Caltech probes [38, 39], in contrast to wet etching with boron etch stop, probes were structured by dry etching of silicon wafers, i.e., by deep reactive ion etching (DRIE) [42]. Their fabrication varies in front DRIE of thin wafers [39], double-sided DRIE of standard [54] and silicon- on- insulator wafers [107, 38] and front DRIE and rear side wafer grinding [56]. This results in powerful fabrication processes for batch processing with high production and adequate robustness of the probe shafts needed for insertion [54]. The probes thicks are in the range of 20 and 100 μm. The layout of the electrode contacts along the probe shafts results in a trade-off between resolution and maximum extension of the volume to be covered by the probe array. The maximum achievable number of electrode contacts per shaft is defined by geometrical limitations, i.e., optimize the width of the shaft considering minimized tissue damage and lithography defined spacing and width of the interconnecting lines. 5 μm [55], 1.5 μm [13], 1 μm [107] and 0.29 μm [38] electrode line widths and spacings were realized. Thanks to the e-beam lithography, the finest resolution is allowing 64 electrodes along a 1.5 mm-long shaft.
8.5 Mechanical adjustment of electrode position
It is a common practice, when the experimenters need to adjust the position of the passive microelectrodes for better signal quality or population activity, which is mostly achieved by mechanical adjustment of the insertion depth of the wire electrodes using micromanipulators and motorized microdrives [126, 41, 21]. Although, the manual replacement of the probe thereby depends on the experimenter’s intuition and subjective assessment with the aid of oscilloscopes and loudspeakers in order to find high quality signals in neural recording [21, 98].
Furthermore, advanced experience is required to find and isolate single-unit activity (SUA) from background activity. With the integration of thermal microactuators, this mechanical depth control was adapted to microelectrode arrays [97], allowing the displacement of three polysilicon probe shafts of up to 5mm at a resolution of 8.8 μm. However, electrode positions cannot be optimized individually within the neural tissue, because all electrodes along the probe shaft are translated in synchrony. One of the major drawbacks using thermal microactuators is that because of micromotions of the brain it cannot be applied to compensate for position shifts of the probe relative to the neural tissue in chronic implantation [97, 21]. In addition, the
probability of inflammation, reactive gliosis and apoptosis of brain tissue is increased by the mechanical movement of the probe, which can end with the degration of the recorded signals [31].