17 Health gap in post-socialist Central and Eastern Europe: A life-course perspective
► The origins of the health gap between post-socialist central and eastern Europe and western Europe are analysed
► Health disparities existed even before the transition
► Stressful periods, financial difficulties and job losses around the transition are associated with worse health at older ages
17.1 Introduction
The health of the population of post-socialist central and eastern European (CEE) countries lags behind the European Union average. Based on Eurostat data corre- sponding to the year 2016 and using the EU-28 average as a comparison, life ex- pectancy at both birth and age 65 is approximately 3–6 years shorter than the EU average. These differences are more pronounced among males than among fe- males. Mortality attributable to cancer and ischaemic heart diseases is substan- tially higher in post-socialist CEE countries than in the rest of the European Union. Laaksonen et al. (2001) argue that the east–west health gap can partly be explained by differences in health behaviours and psychosocial factors. Steptoe and Wardle (2001) arrive at a similar conclusion using a sample of young adults.
Health behaviours and psychosocial factors are likely to be related to living con- ditions during and after the communist era and to the transition itself.
In approximately 1990, the dictatorship of the Communist Party ended in CEE, and the Soviet Union dissolved in 1991. The transition implied a dramatic restructuring of the economy and the social security system. Such major events could have affected not only the healthcare system but also the health status of the population in CEE.
Zatonski (2007) documents that adult mortality rates in post-socialist CEE countries started to diverge from those of western countries in the 1960s. Addi- tionally, during the transition period, adult mortality rose particularly rapidly in post-socialist CEE countries, especially in the Baltics. The dramatic increase in adult male mortality rates during the first years of transition was attributed to
Open Access. © 2019 Anikó Bíró and Réka Branyiczki, published by De Gruyter. This work is
the rising incidence of cardiovascular diseases, accidents and violence, indicat- ing the role of stress and social upheaval (EBRD, 1999). In this study, our focus is not on mortality but on the health status and its evolution before and after the transition, conditional on having survived at least approximately 20 years after the transition. Using individual level life history data, we can also increase our understanding of how the transition impacted the health of the population in post-socialist CEE countries. Our analysis also relates to the literature analysing the effect of rapid privatization (as part of the economic transition) on population health and mortality (Azarova et al., 2017; King et al., 2009).
17.2 Data
We use the pre-release data from SHARE Wave 7 (Wave 7 Internal Release 0, April 19, 2018) and data from Wave 3 (Wave 3 Release 6.1.0, March 29, 2018) that include retrospective questions on life history (such as employment history and health at younger ages) of the population older than age 50. Even the youngest cohorts of the sample were already of active age during the transition period, such that the collapse of communism was likely to be a major life event that affected their pros- pects on the labour market as well. We group the countries into post-socialist CEE countries (Bulgaria, Croatia, Czech Republic, Estonia, Hungary, Latvia, Lithuania, Poland, Romania, Slovak Republic and Slovenia - highlighted with orange in Figure 17.1) and the rest are labelled‘West’(Austria, Belgium, Cyprus, Denmark, Finland, France, Germany, Greece, Ireland, Israel, Italy, Luxembourg, Malta, Neth- erlands, Portugal, Spain, Sweden and Switzerland).1We use questions on health (both current and childhood), timing of stressful periods and financial hardships, employment history and standard demographics.
17.3 Results
17.3.1 Health at old age – ‘ current ’ health
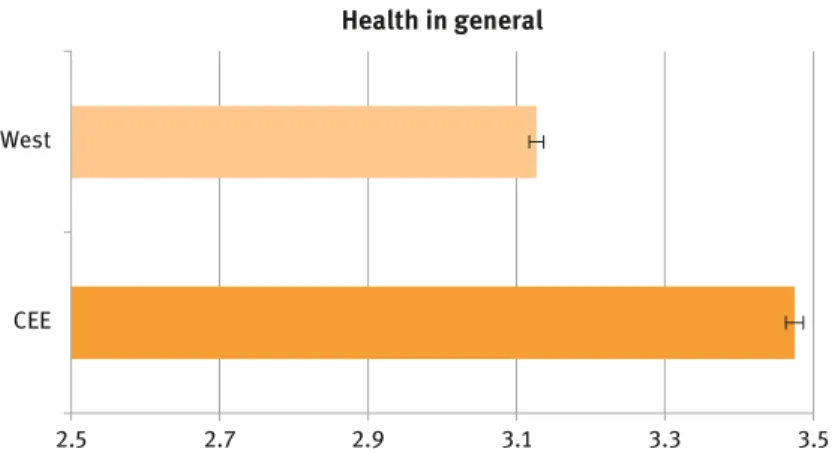
Self-reported health (1–excellent to 5–poor) is on average worse in the CEE coun- tries based on Wave 7 data (Figure 17.2). Additionally, most chronic diseases are
1 Although eastern Germany was affected by the transition, we include Germany within the group‘West’. Our results are robust to the exclusion of Germany from the analysis.
Figure 17.1:Post-socialist CEE countries in SHARE Wave 7.
West
CEE
Health in general
2.5 2.7 2.9 3.1 3.3 3.5
Figure 17.2:Self-reported health in general in CEE and the West.
Note:Average health in general from 1–excellent to 5–poor; 95% confidence interval of the mean is displayed.
Source:SHARE Wave 7 release 0.
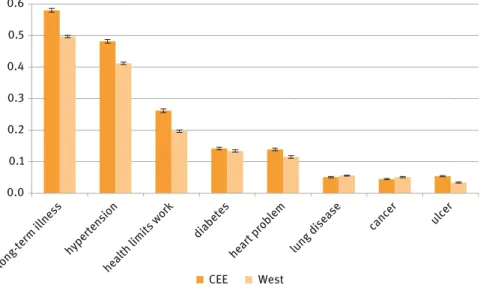
more prevalent which are known to be influenced by living conditions and life- style. In contrast, based on our data, cancer and chronic lung disease are less prev- alent in the CEE countries (Figure 17.3). Note that these statistics do not reveal the differences in mortality rates between the country groups. For example, whereas the prevalence of cancer is similar, we know from Eurostat and OECD statistics that the mortality rate due to cancer is on average higher in the CEE countries.
17.3.2. Retrospective health
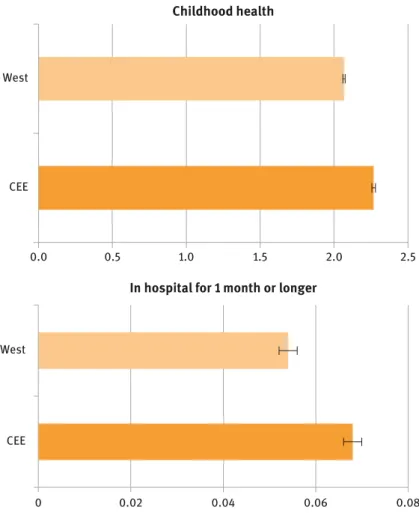
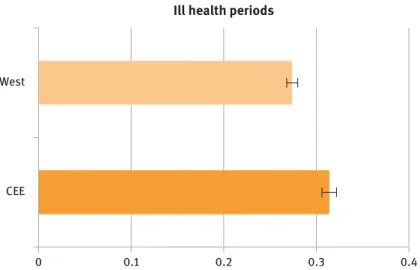
The subsequent figures are based on the retrospective data obtained from Waves 3 and 7. The overall evaluation of childhood health (1–excellent to 5–poor) is somewhat worse in post-socialist countries. A hospital stay for 1 month or longer during childhood is a rare event but is slightly more prevalent in post-socialist countries (Figure 17.4). The number of ill health periods (0–none to 5–most of the time) is also slightly higher on average in post-socialist countries (Figure 17.5).
These differences are moderate in magnitude, albeit statistically significant, indi- cating that the health gap between CEE and the West may partly originate from periods before the transition.
0.0
long-term illness
hypertension
health limits work
diabetes heart probl
em
lung disease
cancer ulcer
0.1 0.2 0.3 0.4 0.5 0.6
CEE West
Figure 17.3:Prevalence of health conditions in CEE and the West.
Note:Prevalence of long-term illness, health limits to work, hypertension, diabetes, heart problem lung disease, cancer and ulcer; 95% confidence interval of the mean is displayed.
Source:SHARE Wave 7 release 0.
17.3.3 Timing of major health events and hardships
The distribution of the initial year of stressful periods and periods of financial hardship peaked around the transition (1990) in post-socialist countries but not in western countries (Figure 17.6). No such time pattern can be observed for the start of ill periods. In the case of the ill periods, only that period is considered here that is mentioned first. It is likely that there is a time lag between the tran- sition and its potential health impacts.
0.0 0.5 1.0 1.5 2.0 2.5
West
CEE
Childhood health
West
CEE
In hospital for 1 month or longer
0 0.02 0.04 0.06 0.08
Figure 17.4:Self-reported childhood health and prevalence of hospital stay during childhood.
Note:Average health in childhood from 1–excellent to 5–poor. Prevalence of hospital stay for 1 month or longer during childhood; 95% confidence interval of the mean is displayed.
Source:SHARE Wave 3 release 6.1.0, Wave 7 release 0.
West
CEE
Ill health periods
0 0.1 0.2 0.3 0.4
Figure 17.5:Frequency of ill health periods in CEE and the West.
Note:Average value of ill health periods as an adult (hs054) from 0–none to 5–ill or disabled for all or most of my life; 95% confidence interval of the mean is displayed.
Source:SHARE Wave 3 release 6.1.0, Wave 7 release 0.
0.00 0.01 0.02 0.03 0.04 0.05 0.06
1951 1961 1971 1981 1991 2001 2011 West-start of stressful period
0.00 0.01 0.02 0.03 0.04 0.05 0.06
1951 1961 1971 1981 1991 2001 2011 CEE-start of stressful period
0.00 0.01 0.02 0.03 0.04 0.05 0.06
West-start of financial hardship
0 0.01 0.02 0.03 0.04 0.05 0.06
CEE-start of financial hardship
1951 1961 1971 1981 1991 2001 2011 1951 1961 1971 1981 1991 2001 2011
Figure 17.6:Timing of stressful periods and financial hardships in CEE and the West.
Note:Starting year of stressful periods, starting year of financial hardship.
Source:SHARE Wave 3 release 6.1.0, Wave 7 release 0.
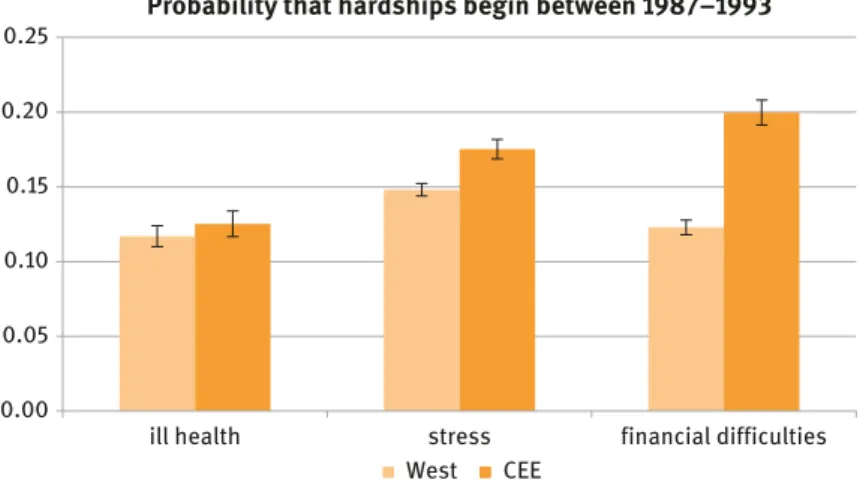
The probability that the start of a stressful period or a period with financial hardship falls between 1987–1993 (i.e., around the transition) is 3 percentage points and 8 percentage points higher in post-socialist countries than in the West, respectively (Figure 17.7). These statistics are conditional on having had such hardships. Thus, the cross-country differences in reporting patterns of dif- ficulties or hardships do not affect the estimated differences in the time pat- terns. The difference reflects the adverse shock of a transformational recession across CEE countries.
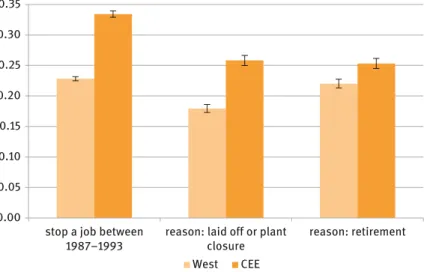
We also observe that people were more likely to stop working in a job around the years of transition (1987–1993) in post-socialist CEE than in the West (Figure 17.8).
Additionally, among those who stopped working in a job, the reason for leaving a job such as being laid off or a plant/office shutdown was more prevalent in post- socialist countries. Retiring was also slightly more likely in CEE countries, which may reflect the tendency in some post-socialist countries to transfer the unem- ployed into early and disability retirement.
17.3.4 Regressions
We estimate, using linear models, how a stressful period around a transition is associated with subsequent health. The sample is restricted to post-socialist 0.00
0.05 0.10 0.15 0.20 0.25
ill health stress financial difficulties Probability that hardships begin between 1987–1993
West CEE
Figure 17.7:Ratio of the hardships beginning during 1987–1993 in CEE and the West.
Note:Probability that the initial year of ill health, stressful periods and financial hardships decline during 1987–1993 conditional on having had such hardship; 95% confidence interval of the mean is displayed.
Source:SHARE Wave 3 release 6.1.0, Wave 7 release 0.
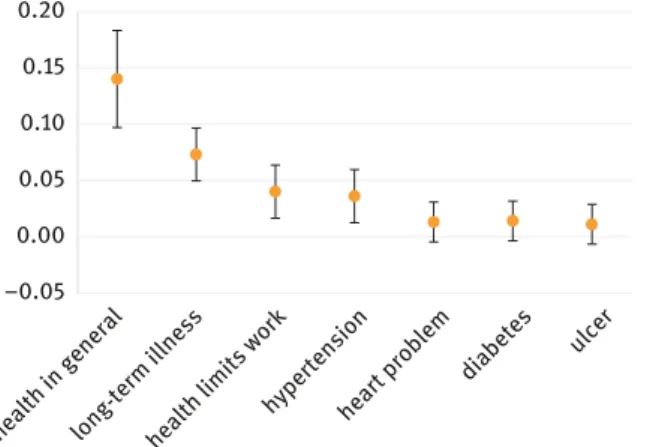
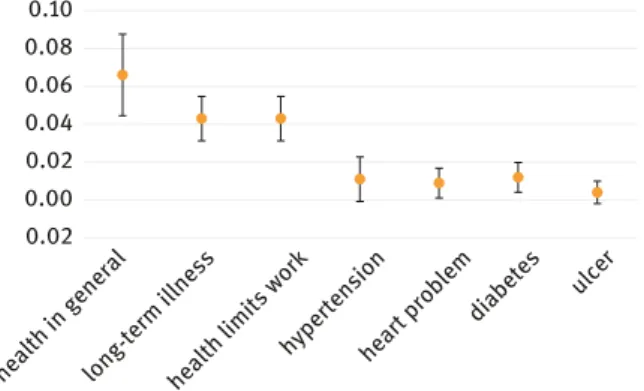
CEE countries. We regress various health measures on the binary indicators of a stressful period or financial hardships beginning during 1987–1993. We also add a set of individual controls (age, gender, education dummies, overall child- hood health, hospitalization during childhood and country dummies). We ob- serve evidence that such hardships imply worse overall health at older ages and a higher probability of having ever had hypertension or ulcer. We find small and statistically insignificant associations with having ever been diag- nosed with cancer or lung disease (not reported in Figures 17.9–17.11).
We also estimate the association between a job change around a transition and later health. The results suggest negative health implications of stopping or changing jobs around a transition.
17.4 Conclusions
Using retrospective data (SHARELIFE), we analysed the origins of the health gap between post-socialist central and eastern Europe, and western Europe. We docu- mented that health disparities existed even before the transition. Additionally, 0.00
0.05 0.10 0.15 0.20 0.25 0.30 0.35
stop a job between 1987–1993
reason: laid off or plant closure
reason: retirement West CEE
Figure 17.8:Prevalence of stopping a job and leaving due to lay-off or plant closure during 1987–1993.
Note:Prevalence of stopping a job and leaving due to lay-off, plant closure or retirement during 1987–1993; 95% confidence interval of the mean is displayed.
Source:SHARE Wave 3 release 6.1.0, Wave 7 release 0.
–0.05 0.00 0.05 0.10 0.15 0.20
long-term illness
hypertension health limits work
diabetes heart problem health in general
ulcer
Figure 17.9:Linear regressions–current health and stressful period during 1987–1993.
Note:Estimated coefficient of a stressful period starting during 1987–1993 in separate linear regressions with indicators of current health as a dependent variable (health in general, among others); 95% confidence interval of the point estimate is displayed. Individual controls include age, gender, education dummies (primary, secondary, tertiary), overall childhood health on a scale of 1–5 and hospitalization during childhood dummy.
Source:SHARE Wave 3 release 6.1.0, Wave 7 release 0.
–0.05 0.00 0.05 0.10 0.15 0.20
long-term illness
hypertension health limits work
diabetes heart problem health in general
ulcer
Figure 17.10:Linear regressions–current health and financial hardship during 1987–1993.
Note:Estimated coefficient of financial hardship starting during 1987–1993 in separate linear regressions with indicators of current health as a dependent variable (health in general, among others); 95% confidence interval of the point estimate is displayed. Individual controls include age, gender, education dummies (primary, secondary, tertiary), overall childhood health on a scale of 1–5 and hospitalization during childhood dummy.
Source:SHARE Wave 3 release 6.1.0, Wave 7 release 0.
we showed that the post-socialist transition era was more often associated with the start of stressful periods and financial difficulties in the post-socialist CEE countries than in the West. Finally, with the assistance of a regression analysis, we found evidence that stressful periods, financial difficulties and job loss around the transition period are all associated with worse health at older ages, even after netting out the effect of childhood health and demographic factors.
Overall, our results suggest that the post-socialist transition itself increased the health disadvantage of the post-socialist CEE countries.
Our study is subject to a set of limitations. The results are conditional on having survived approximately 20 years after transition; thus, we could not es- timate the mortality effects. Health behaviours could not be analysed given data limitations. Additionally, reverse causality is possible from persistent health problems to reporting hardships related to the transition; therefore, our results indicate associations rather than causal effects.
References
Azarova, A., et al. (2017). The effect of rapid privatisation on mortality in mono-industrial towns in post-Soviet Russia: a retrospective cohort study.The Lancet Public Health,2(5), e231–e238.
0.02 0.00 0.02 0.04 0.06 0.08 0.10
long-term illness
hypertension health limits work
diabetes heart problem health in general
ulcer
Figure 17.11:Linear regressions–current health and stopping a job between 1987–1993.
Note:Estimated coefficient of stopping a job during 1987–1993 in separate linear regressions with indicators of current health as a dependent variable (health in general, among others);
95% confidence interval of the point estimate is displayed. Individual controls include age in year 2017, gender, education dummies (primary, secondary, tertiary), overall childhood health on a scale of 1–5 and hospitalization during childhood dummy.
Source:SHARE Wave 3 release 6.1.0, Wave 7 release 0.
EBRD (1999).Transition report 1999. Ten years of transition. European Bank for Reconstruction and Development, 1999.
King, L., Hamm, P., and Stuckler, D. (2009). Rapid large-scale privatization and death rates in ex-communist countries: an analysis of stress-related and health system mechanisms.
International Journal of Health Services,39(3), 461–489.
Laaksonen, M., et al. (2001). Do health behaviour and psychosocial risk factors explain the European East-West gap in health status?The European Journal of Public Health11(1),65–73.
Steptoe, A., and Wardle, J. (2001). Health behaviour, risk awareness and emotional well-being in students from Eastern Europe and Western Europe.Social Science & Medicine,53(12), 1621–1630.
Zatonski, W. (2007). The east-west health gap in Europe–what are the causes?The European Journal of Public Health,17(2), 121–121.