1
Hungary Country Report
European Foundations for Research and Innovation
EUFORI Study
Éva Kuti
Research and innovation
EUROPEAN COMMISSION
Directorate-General for Research and Innovation
'LUHFWRUDWH%²,QQRYDWLRQ8QLRQDQG(XURSHDQ5HVHDUFK$UHD
8QLW'LUHFWRUDWH%8QLW%²60(V)LQDQFLDO,QVWUXPHQWVDQG6WDWH$LGV
&RQWDFW0DULD.D\DPDQLGRXDQG,JQDFLR3XHQWH*RQ]iOH]
(PDLO0DULD.D\DPDQLGRX#HFHXURSDHXDQG,JQDFLR38(17(*21=$/(=#HFHXURSDHX European Commission
B-1049 Brussels
Hungary Country Report
EUFORI Study
Éva Kuti
Association for Nonprofit and Social Studies
Directorate-General for Research and Innovation 2015
LEGAL NOTICE
This document has been prepared for the European Commission however it reflects the views only of the authors, and the Commission cannot be held responsible for any use which may be made of the information contained therein.
More information on the European Union is available on the Internet (http://www.europa.eu).
Luxembourg: Publications Office of the European Union, 2015
© European Union, 2015
Europe Direct is a service to help you find answers to your questions about the European Union.
Freephone number (*):
00 800 6 7 8 9 10 11
(*) The information given is free, as are most calls (though some operators, phone boxes or hotels may charge you).
5
Contents
1 Contextual Background 6
1.1 Historical background 6
1.2 Legal and fiscal framework 9
1.3 The foundation landscape 10
1.4 Research/innovation funding in Hungary 12
2 Data Collection 15
2.1 The identification of foundations supporting R&I 15
2.2 The survey 16
2.3 The interviews 17
3 Results 19
3.1 Types of foundation 19
3.2 Origins of funds 21
3.3 Expenditure 25
3.4 Focus of support 30
3.5 Geographical aspects of the activities 33
3.6 Foundations’ operations and practices 35
3.7 Roles and motivations 40
4 Innovative Examples 43
5 Conclusions 47
5.1 Main conclusions 47
5.2 The strengths and weaknesses of the R&I foundation sector in Hungary 47
5.3 Recommendations 49
6 References 50
7 Annex 53
1 Contextual Background
1.1 Historical background
There is a quite strong philanthropic tradition in Hungary. Besides the religious roots of charitable activi- ties and some emotionalism that is part of the national character, this strength is explained by the col- lective experience gained throughout the country’s turbulent history. Since the Turkish invasion and the formation of the modern European ‘world-economy’ had pushed Hungary into a backward position on the European periphery in the sixteenth century (Wallerstein, 1983:162-167), public needs and expec- tations were rarely met by the public authorities. The room for political movements and advocacy was very limited under the conditions of foreign occupation and internal oppression. Thus, the role of private contributions became crucial in facing social challenges. Donations are regarded as an important (and sometimes the only) source of financing independent actions, new initiatives and innovative approaches to the treatment of social problems. Consequently, Hungarians also have a liking for the foundation as an appropriate institutional form of raising, pooling, administering and making good use of private donations (Balázs, 1991; Czakó et al., 1995; Czike–Kuti, 2006).
The history of foundations is almost as long as that of the Christian State in Hungary. The first kings do- nated large properties to the Catholic Church and the religious orders they invited to the country. Accord- ing to some analysts (Kecskés, 1988:110-111), these endowments (followed by many others from both kings and feudal lords) were the very first charitable foundations in Hungary. Independent lay foundations were also established from the beginning of the fifteenth century (Somogyi, 1941:93). Some co-opera- tion between private foundations and public institutions emerged at an early stage and became fairly commonplace in the late 1800s. Numerous foundations contributed to the financing of public hospitals, schools, universities, orphanages and shelters (Balázs, 1991:85-89). Some regulatory measures from the early twentieth century also reveal that government authorities laid claim to the sources available from private philanthropy. This intention was apparent in Law XXXIV/1920, which declared the tax deductibility of bequests and donations for foundations engaged in scientific, educational and charitable activities (Ba- lázs, 1991:82), as well as in some government decrees that tried to regulate and control private donations in the 1920s.
The development of any co-operation between the State and foundations was cut short by the Commu- nist takeover after World War II. Communist governments regarded private initiatives as a threat to the monopoly of Marxist-Leninist ideology and to Party control over social movements. This is why Decree 474/1948 and Decree 2/1949 ordered that foundations had to be dissolved and their property was to be given to the central State or local government agencies (Kecskés, 1988:113). No legal form of foundation existed in Hungary between 1949 and 1987. However, the government recognised its failure to build a sustainable welfare system and the need for assistance from private donors well before the collapse of the Soviet bloc. The ‘rehabilitation’ of foundations came about due to both financial and social pressures.
7
When George Soros decided to promote democratisation in Central and Eastern Europe and sought to establish his first national foundation in Hungary in 1984 (Szabo, 2009:1470), only a pseudo-foundation could be created under the auspices of the Academy of Sciences. Ernő Rubik, the inventor of the Rubik’s Cube, and several prominent artists had similar difficulties in finding an appropriate institution for their planned donations. They did not want to support government-controlled public institutions and insisted on establishing independent foundations. The government, which was facing many financial problems, could not (and perhaps did not even want to) resist these pressures. In 1987, it issued Decree 11, which modified the Civil Code and introduced once again the foundation as a legal entity (Kuti, 1996:41). The growth of the number of foundations was slow at first, but accelerated rapidly after the political changes of 1989.
The development of foundations supporting scientific activities started somewhat later than that of most traditional charitable foundations, but ran parallel with them from the fourteenth century. Donations tra- ditionally played an important role in financing research and scientific institutions. In the beginning, these were almost exclusively higher education institutions. For example, the very first Hungarian university was able to attract prominent foreign scholars by offering them extremely high salaries[1] covered by dona- tions (Petrovics, 2005:36). Hungarian scholars’ international relations and foreign studies were also pro- moted by private donors. ‘Surprisingly generous private individuals established large foundations in order to enable professors and students to make studies beyond the national borders, namely in Italy, Germany, and in the Netherlands’ (Vekerdi, 1996:13).
The partial separation of higher education and scientific activities and the emergence of exclusive re- search institutions were also helped by private donations. The Hungarian Academy of Sciences itself owed its establishment to a generous offer by István Széchenyi, one of the richest, and definitely the most enlightened, aristocrats in the country. In 1825, he donated a whole year’s income from his estate for the Academy to be created. Count Széchenyi’s example was followed, not only by other magnates and noblemen, but also by entrepreneurs, municipalities, churches, and even schools and students. As a re- sult, a significant endowment ‘guaranteed the financial independence of the Academy and, in principle, protected its autonomy from all kinds of government interference’ (R. Várkonyi, 2010:1422). Although on a smaller scale, similar donations helped the research activities of several scientific societies. It was quite common for scholars who were active members of these voluntary associations to pay no or a very small membership fee, while the costs of research activities, awards and conferences were covered by ‘support- ing members’ and occasional donors (Tóth, 2005:177).
As far as innovation is concerned, foundations and voluntary associations played an important role espe- cially in social innovation during the nineteenth century and the first part of the twentieth century. The first museums, libraries, exhibition halls, tuberculosis clinics, children’s hospitals, kindergartens, compre- hensive schools, employment agencies, and institutions of adult and women’s education were all created either by them or with their assistance.
1 The University of Pécs (established in 1367) lured the prominent jurist Galvano di Bologna to Hungary by offering him an income that was ten times higher than his former salary at the University of Padova.
HUNGARY - EUFORI Study Country Report
Both research and innovation were controlled by the government under State Socialism. Private initiatives could (and did) gain momentum in this field only after the change in political system. In fact, the founda- tions focusing on research (and thus classified as research foundations according to the ICNPO [2]) mush-
roomed during the early 1990s (Figure 1).
The rapid growth of foundations was mainly (but not only) explained by the researchers’ and their sup- porters’ willingness to take the opportunity to freely establish independent organisations and to launch projects on their own initiative. The regulatory environment was also very favourable. The procedures of court registration were simple and free from bureaucracy and the administrative and accounting regula- tions were not yet fully developed. Foundations had to meet very few formalised conditions in order to receive indirect government support; their tax exemption and the tax deductibility of donations were practically unconditional until 1994. Since then, the regulations guiding the functioning of foundations have gradually become more detailed, more complicated and more differentiated [3]. In parallel, the tax advantages have been reduced. All these changes, together with the saturation effect, have resulted in a decrease in their growth rate. This slow-down was somewhat moderated by the creation of two new schemes supporting nonprofit organizations (NPOs) in the late 1990s and early 2000s. The first, the 1 % system, let the taxpayers decide which nonprofit organizations should benefit from 1 % of their personal income tax. The second, the National Civil Fund, was established in order to distribute public support through boards whose members were mainly elected by NPOs. The introduction of these new financing mechanisms was an important step towards the decentralisation and democratisation of the distribution of public support, but their impact could not counter the negative effects of the shrinking tax advantages and the shock of the economic crisis in the late 2000s.
2 The Hungarian Statistical Office uses a slightly modified version of the ICNPO (the International Classification of Nonprofit Organizations) developed by Salamon and Anheier (1996:136-140). Under this system, foundations are classified according to their main activity.
3 The most important element of this process of differentiation was the introduction of a voluntary public benefit test in 1997. NPOs passing this test could get public benefit status or (if they substituted for government agencies in service provision) the eminently public benefit status, thus becoming eligible for tax exemption and other privileges.
Figure 1: Number of foundations in the field of research, 1987–2011
Sources: MASZ (1991), KSH (1994) and KSH (1995–2013) 1000
200300 400500 600700
1987 1988 1989 1990 1991 1992 1993 1994 1995 1996 1997 1998 1999 2000 2001 2002 2003 2004 2005 2006 2007 2008 2009 2010 2011
9
1.2 Legal and fiscal framework
Under Hungarian law, there are two legal forms of foundation, namely private and public law foundations.
Private foundations (named simply as foundations in the legal regulations) are organisations with some form of endowment, established to pursue lasting public purposes. Their founders can be either private persons or organisations with legal personalities. Their endowment must be big enough to cover the costs of starting the planned work and fund-raising activities. These foundations are managed by a board appointed by the founders, who are not allowed to have a significant influence on the decisions of this board. If a private foundation is dissolved, its property must remain in the same field serving the original public purpose.
Public law foundations are foundations established to take over certain government tasks that are de- fined in law as government responsibilities. They can only be founded by Parliament, the government or municipalities. The founders can initiate their dissolution if they think their functions could be more efficiently carried out by another organisation. The property of a dissolved public law foundation reverts to its founder. Apart from these special provisions, the basic legal regulations for private foundations also apply to public law foundations.
Both kinds of foundation are registered by the county and capital courts. Registration cannot be refused if all the legal requirements (durable public purpose, founding statute and endowment) are fulfilled. Regis- tration can still be completed by a public benefit test at the request of the foundation, but its content was completely changed by Law CLXXV in 2011 (Sebestény, 2013). Just one degree has remained, known as the public benefit status, but this is only available for nonprofit organisations (including foundations) if they are engaged in the provision of welfare services defined by law (e.g. the laws on health care, education, social care etc.) as government tasks.[4] In addition, NPOs applying for public benefit status also have to:
• declare the general accessibility of their services;
• prove that they have the appropriate resources (that their annual income exceeds HUF 1 million/
EUR 3 300, or the balance of their revenue and expenditure is positive, or their wage bill exceeds one quarter of their total expenditure);
• demonstrate that they receive significant support from citizens either in the form of service fees, or in the form of voluntary work or 1 % support.
The public benefit status is a necessary condition for receiving government grants and contracts, as well as for enjoying beneficial tax treatment. Only one of these tax benefits is equally available for all founda- tions: this is the exemption from tax on the foundations’ income from activities related to their mission.
Any unrelated business income can also be tax exempt if it does not exceed HUF 10 million (EUR 33 000 Euro) or 10 % of the total revenue of foundations without public benefit registration. This limit is higher (15 %) in the case of public benefit foundations.
4 Formerly this was the condition of getting the eminently public benefit status.
HUNGARY - EUFORI Study Country Report
Another type of the tax advantage could be (and was for almost 20 years) the tax deductibility of dona- tions. Unfortunately, individual donors are no longer allowed to deduct their contributions from their tax- able income. Corporate donations may still reduce the tax liabilities that the donor would otherwise bear if the beneficiaries are nonprofit organizations registered as being of public benefit. Single contributions are tax deductible up to 20 % of the taxable income. The upper limit becomes 40 % if (at least) the same amount is annually donated by a business firm for more than 3 years.
The very same Law CLXXV that redefined the public benefit status, also changed the name, structure and decision-making mechanisms of the National Civil Fund (Kákai, 2013); the government gained control over the distribution of its grants. The new name is the National Co-operation Fund. Only one third of its decision-making bodies’ members are elected by the NPOs; two thirds of them are delegated by the government and Parliament. The boards still issue calls for applications, but foundations close enough to the government can also get support from the Fund directly if decided by the head of the supervisory authority. [5]
1.3 The foundation landscape
According to the last official data published by the Central Statistical Office, there existed 23 236 founda- tions in Hungary in 2011. More than two thirds (72 %) of them were involved in education, social care, culture and health care (Figure 2); all the other fields (including research) proved to be rather small.
The dominance of these four fields is explained by the fact that practically all Hungarian kindergartens, schools, universities and university departments, theatres, museums, libraries, cultural centres, residen- tial homes and daycare institutions, hospitals and hospital departments have their ‘own’ grant-seeking foundations. These institutions are numerous, and the number of their satellite foundations is so high that all other foundations are very much in the minority within this sector. The tax advantages available for foundations and their access to special funding targeted for NPOs were not the only reasons for the establishment of satellite foundations. Their founders were also motivated by the relative freedom of decision making the foundations enjoy compared to state-run institutions. The beneficiaries of the satel-
5 At present, this is the Ministry of Human Resources.
Source: KSH (2013)
32%
16% 14%
10%
3%
25%
Figure 2: Composition of foundations according to ICNPO groups, 2011
Education Culture Social care Health Research Other
11
lite foundations’ grantmaking activities are almost exclusively the parent institutions and their clients and employees. These ‘grants’ may simply cover the costs of everyday activities or special projects (e.g. con- ferences, workshops, festivals), but they can also contribute to the implementation of major investments, to employees’ training and professional development, or to the motivation for and acknowledgment of outstanding achievements (e.g. awards, fellowships).
In much smaller numbers, there are also some charitable foundations of a very traditional type (e.g. pov- erty relief funds, foundations helping the disabled, homeless, refugees or the elderly). They are vehicles of the voluntary redistribution of wealth, mainly reflecting their founders’ empathy towards the people in need. Another mission of these ‘classical’ grantmaking foundations is to support the studies of talented children and students, or to facilitate the careers of young researchers and artists. Former governments and some foreign donors also established large foundations promoting economic development. Although some of them have become the victims of the present government’s centralisation efforts, others still ex- ist. Their main tasks are to encourage innovative and experimental employment programs and to provide entrepreneurs and companies with financial support, assistance and advice. Their grants and services are equally available for social entrepreneurs and business firms (KSH, 2013; Kuti, 2008).
Hungarian foundations do not confine themselves to grantmaking and grantseeking; many of them are operating foundations involved in service provision. This initiative mainly comes from enthusiastic profes- sionals (e.g. doctors, teachers, librarians, social workers, artists and researchers) or potential clients and other stakeholders (e.g. the audience of a local theatre, parents of disabled children). Some operating foundations have also been established by voluntary associations, trade unions, business federations and government authorities. It also happens that private foundations are active in environmental and civil rights movements or in different types of advocacy, but very few of them are specialised in these kinds of activities. There is no established infrastructure for collaboration either within the foundation sector or between foundations and the national government. Umbrella organisations and intermediary organisa- tions are equally lacking in the field of foundations in general and within the research and innovation (R&I) sector.
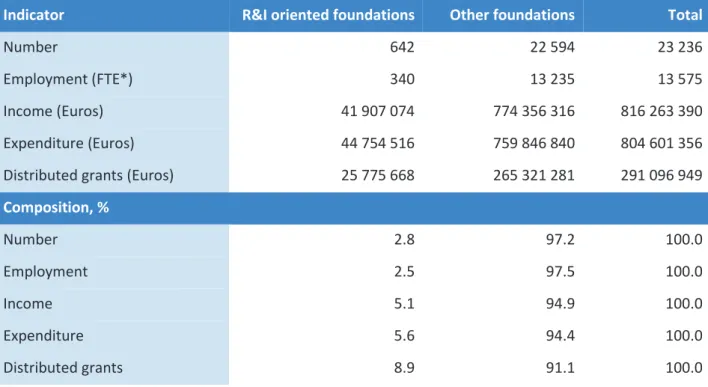
The foundations supporting research and innovation do not take up much room in the foundation land- scape (Table 1) in Hungary. They represent less than 3 % of the foundation sector, and their share is even smaller in terms of employment.
However, the financial indicators suggest that the economic weight of foundations supporting R&I is more important than their employment potential. In addition, their grantmaking activities are obviously much more intensive than the Hungarian average: almost one-tenth of the total foundation support is distrib- uted by them.
1.4 Research/innovation funding in Hungary
Research funding has changed a lot over the last three years in Hungary. The present government has rejected the arm’s length principle that guided the behaviour of its predecessors. Most of the funding de- cisions have become centralised and government-controlled. The amount of public support for university research no longer depends on the size or quality of the academic community hosted by the higher edu- cation institutions. The government has selected certain universities that are entitled to carry out funded research; all the others are not eligible for public funding for their scientific activities. State support for the Academy of Sciences is part of the central budget, thus its amount depends on decision by Parliament.
Both university professors and researchers employed by the Academy’s research institutes can apply for individual grants from a special government fund (OTKA – the National Scientific Research Fund).
The majority of the government-founded (mainly public law) foundations engaged in doing or supporting research and innovation have been dissolved. Several of them (e.g. the Bay Zoltán Public Foundation for Applied Research, the Science and Technology Foundation) were transformed into state-owned nonprofit companies. Others had to merge with public institutions (e.g. the Public Foundation for the Documenta- tion and Research of the 1956 Revolution’s History) or their grantmaking task was simply taken over by a ministry (e.g. the Magyary Zoltán Public Foundation for Higher Education). Whatever the method, the
3
Table 1: Major indicators of the foundation sector and its R&I segment, 2011
Indicator R&I oriented foundations Other foundations Total
Number 642 22 594 23 236
Employment (FTE*) 340 13 235 13 575
Income (Euros) 41 907 074 774 356 316 816 263 390
Expenditure (Euros) 44 754 516 759 846 840 804 601 356
Distributed grants (Euros) 25 775 668 265 321 281 291 096 949
Composition, %
Number 2.8 97.2 100.0
Employment 2.5 97.5 100.0
Income 5.1 94.9 100.0
Expenditure 5.6 94.4 100.0
Distributed grants 8.9 91.1 100.0
Sources: KSH (2013) and the database of the Central Statistical Office
* Employment is given as a full-time equivalent (FTE). The Hungarian Central Statistical Office uses the definition developed by the Johns Hopkins Comparative Nonprofit Sector Project (Salamon and Anheier, 1996).
13
result is the same: these formerly independent organisations’ activities are now controlled by the govern- ment and not by a board consisting of experts, academics and other stakeholders.
Similarly, support for innovation has also been centralised. Large and medium size companies are still obliged to pay an ‘innovation contribution.’[6] Formerly, these companies had a choice: they could either transfer this contribution to the Innovation Fund or spend the same amount themselves in order to cover the costs of any applied research directly useful to them. In most cases this research was not carried out by the corporations; they contracted it out to research institutes, universities and research-oriented NPOs.
As one of our interviewees reported, this innovation contribution was an important source of income for R&I foundations, as well. At present, this is no longer available as the costs of contracted out research are not deductible from the innovation contribution. This latter goes to the Central Fund for Technology and Innovation, and then it is distributed in a centralised way.
The largest part of the money concentrated in the Central Fund for Technology and Innova- tion is distributed at the government’s discretion. In addition there are two calls for applica- tions: one for the privileged companies that have signed a ‘strategic agreement’ with the gov- ernment, another for everybody else with innovative, market-oriented projects. This latter call appeared on the website of the Ministry of National Development on October 21, 2013.
According to its text, the deadline for the applications was November 21. However, four days later the Ministry closed the procedure because the amount requested in the immediately submitted applications largely exceeded the size of the available fund. Some members of the Hungarian Innovation Society questioned the fairness of the tender, spoke about inside information and favoritism, but the law does not provide remedy for this kind of injustice (Vitéz F. 2013:61).
All in all, the public funding of research and innovation is politically tainted in Hungary. Moreover, it is extremely scarce. As stated in the ‘Strategy for Science Policy between 2014 and 2020’ prepared by the Ministry of Human Resources: ‘it is worrisome that the public funding has declined in an international comparison; the time-series calculated at constant prices reveal a decrease even in its total amount. The segment of the research and development (R&D)[7] sector financed from public sources has growing dif- ficulties in keeping its position unchanged in the global scientific competition’ (EMMI, 2013:18.). The over- all picture is not much better, either. Hungary is only a ‘moderate innovator’[8] according to the Innovation Union Scoreboard. Moreover, it ‘performs below the EU average for most indicators’ (Hollanders and Es-Sadki, 2014:59). The total Hungarian R&D spending as a percentage of GDP is still far behind the EU average (1.9 %) and the national target for 2020 (1.8 %): it was 1.21 % in 2011 (EC, 2013:10) and 1.29 %
6 The innovation contribution is 0.3 % of the corporations’ net business income.
7 Although it happens more and more frequently that new names (research, development & innovation) and abbreviations (RDI) appear on official documents (e.g. NGM, 2013), the statistical publications’ language and the methodology behind it have not changed. The statistical figures quoted here are based on an annual survey of all institutions where basic and applied research and experimental development projects are carried out.
8 Hungary’s Summary Innovation Index is only 0.351, much lower than the 0.554 EU average, let alone the innovation leaders’ SIIs, which exceeds 0.7 (Hollanders and Es-Sadki, 2014:92).
in 2012 according to a preliminary estimation of the Hungarian Statistical Office (KSH, 2013a:5). Current expenditure is slightly in excess of EUR 1 billion, while capital expenditure is just under EUR 200 million.
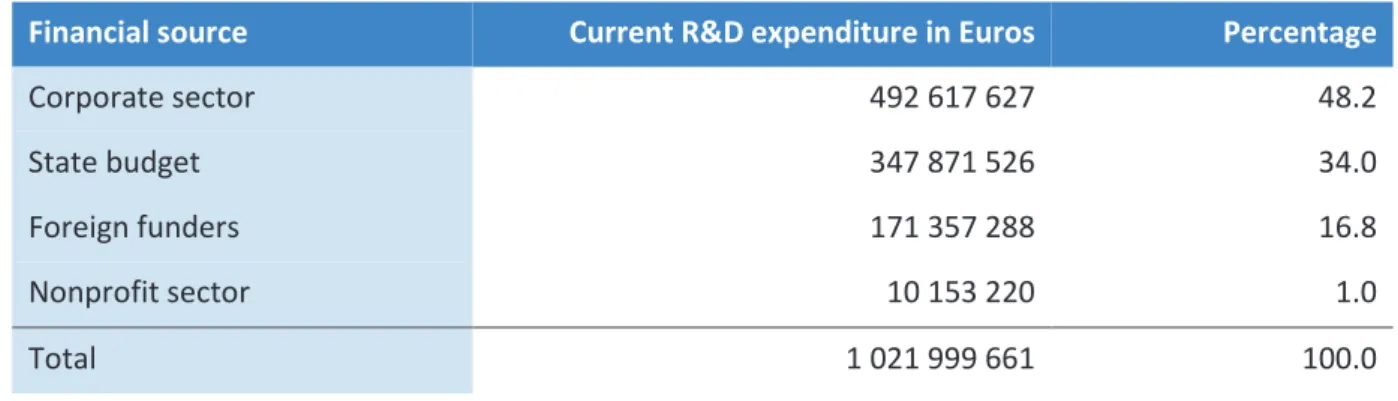
As shown in Table 2, the income from the nonprofit sector covered 1 % of the R&D institutions’ costs in 2012. This probably indicates almost exclusively foundation support because grantmaking is not a typical activity for other kinds of NPO (voluntary associations and nonprofit companies), but the donor founda- tions are not necessarily specialised in supporting research and innovation. On the other hand, there are also several operating foundations on the recipient side. Consequently, the data produced by the regular statistical survey of R&D institutions do not provide us with the information we need if we want to explore the role of foundations in research and innovation. This is why an empirical survey of R&I-oriented founda- tions has become a major element of the EUFORI Study.
Table 2: Composition of current R&D expenditure by financial source, 2012
Financial source Current R&D expenditure in Euros Percentage
Corporate sector 492 617 627 48.2
State budget 347 871 526 34.0
Foreign funders 171 357 288 16.8
Nonprofit sector 10 153 220 1.0
Total 1 021 999 661 100.0
Source: KSH (2013a)
15
2 Data Collection
2.1 The identification of foundations supporting R&I
The main source of information on Hungarian R&I-oriented foundations was the register kept by the Cen- tral Statistical Office. [9] This register is regularly updated with the help of an annually distributed ques- tionnaire (containing questions on availability, activities, and the cessation or closure of operations), and with the help of data available from the court register on newly registered nonprofit organisations. The organisations on the register are classified according to their main activity into 18 major ICNPO groups (one of them being Research) and nearly 200 subgroups by using the information provided during their registration process. The respondents of the annual statistical survey are asked to confirm the validity of their classification. In principle, the register of the Central Statistical Office should be completely up- to-date as returning its questionnaire is a legal obligation. In practice, the response rate is only 70-80 %.
Foundations that do not return the questionnaire remain registered, although it is highly probable that several of them no longer exist. Similarly, non-respondents do not indicate whether their contact informa- tion and classification are correct or not.
Unfortunately, there is no separate group for NPOs specialised in the promotion of innovation in the ICNPO, so the identification of innovation-oriented foundations was rather difficult. While most of the research foundations were automatically identified by their ICNPO code, the selection of foundations supporting innovation (just like the ones whose research activities were secondary) could only happen on the basis of their name. When innovation or any of its Hungarian synonyms were part of the name, the foundation was added to the list we bought from the Statistical Office. This also went for the ones we man- aged to identify as foundations being at least partly engaged in R&I activities by using several other kinds of background information. The final list (and the related database of the last available statistical survey we also purchased) contained 642 foundations supporting research and innovation.
The next step was the search for email addresses. We collected addresses through personal networks and from several different information sources, namely the Internet, web pages, conference participant lists, applications for R&I grants, lists of recipients of relevant newsletters, etc. Then we sent a test letter[10] to all the email addresses we had found in order to check whether they were really in use. The final list of R&I-oriented foundations with reliable email addresses consisted of 438 items, which meant that the call for the return of the questionnaire of the EUFORI survey could reach 68 % of the whole population. Fortu- nately, we can be almost sure that most of the foundations not having email address are either very small or even inactive, so leaving them out would not cause much bias in the calculation of economic indicators.
9 There also exists a court register of nonprofit organizations, but it was not suitable for our identification purposes because it is not regularly updated; thus it contains a large number of NPOs that have not been in operation for long and even more with completely outdated contact information.
10 We also used this letter to inform the foundations about the EUFORI study and the online survey.
As we shall see in Chapter 3, this hypothesis is supported by the similarity of the income and expenditure data coming from the statistical database and the EUFORI survey.
2.2 The survey
The online survey was carried out by the VU team. The foundations received an email with a direct link to the online questionnaire. Later on, a reminder was also sent out by the core team. Those who still did not respond were contacted directly by the national experts.[11] We tried to persuade foundation leaders to fill in the questionnaire not only via email (3-5 repeated messages/foundation); we also called 70 of them by phone. In the meantime, the VU team developed a very short version of the online questionnaire in the hope that this would help us in our final attempt to increase the response rate. This ‘short version’
questionnaire included only 10 of the most important questions. In fact, the foundations proved to be more willing to fill in the short questionnaire, thus providing us with at least with some essential informa- tion on their activities, revenue and expenditure. As a result, the response rate increased somewhat, but was still not satisfactory.
From some encouragement by the VU team, we complemented the database on the basis of the foun- dations’ annual reports in order to provide as complete a picture as possible. This was feasible because Hungarian nonprofit organisations are obliged to submit their annual accounts to the relevant registering court that makes the electronic version available on a website (http://www.birosag.hu/allampolgaroknak/
tarsadalmi-szervezetek-es-alapitvanyok-nevjegyzeke). Although it happens quite frequently that founda- tions (especially small ones) fail to fulfill their reporting obligations, the majority of them comply with the regulations and submit some kind of report. Unfortunately, in many cases its only element is the ac- counting statement. However, the crucially important financial data and activity information matching the content of the short questionnaire could be found in most of the annual reports
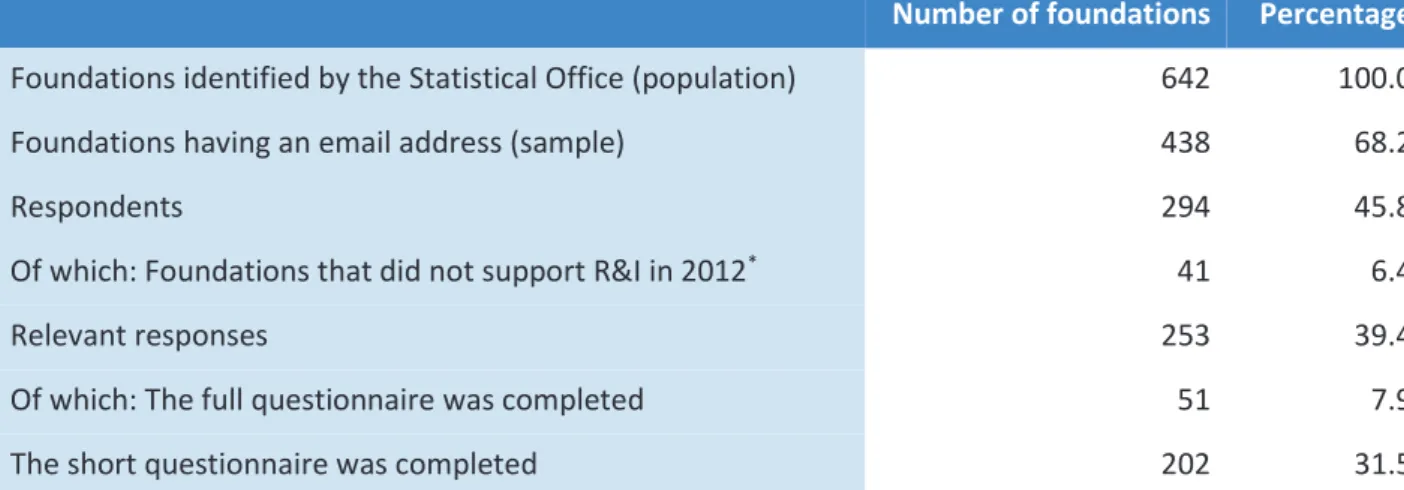
All in all, our survey finally covered 46 % of the foundations originally identified by the Central Statistical Office and 67 % of those having an email address, but the amount of information we now have on the respondents is rather uneven (Table 3).
11 In Hungary’s case, this work was done by Margit Kinyik, who also conducted nine of the ten interviews. I owe her a dept of gratitude for her assistance.
17
The survey data are the main source of information we will rely on when analysing the foundations’ or- ganisational features, activities, relationships and contribution to European integration in Chapter 3. The overall number of responses is relatively high; consequently the survey data are fairly reliable in the case of the questions that were part of the short questionnaire. The other questions (included only in the full questionnaire) were answered by far fewer foundations, [12] thus we must be extremely cautious about the interpretation of the results. This is especially true for the questions that tried to explore the composi- tion of assets, revenue and expenditure, as many of the respondents refused to share with us this kind of information.
Some additional (mainly financial) information is also available from the database we bought from the Central Statistical Office. Apart from their reliability, one major advantage of these official statistical data is that they cover the whole population of R&I-oriented foundations thanks to the relatively high response rate and a very sophisticated imputation method. [13] This is why we have used them in the analysis of the economic weight of foundations supporting R&I.
2.3 The interviews
In order to illustrate and enrich the data from the online survey and to develop a more in-depth under- standing of the foundations’ activities and their impact, we also conducted interviews with nine founda- tion leaders and one expert on R&I funding. The selection of the interviewees was guided by the prelimi- nary information on the major types of foundation:
12 The number of observations (N) is displayed for each table and figure containing the survey results.
13 Non-respondent NPOs are ‘represented’ in the database by respondents similar to them in terms of legal form, ICNPO subgroup, geographical location, and the community type of their seat (KSH, 2003:12).
5
Table 3: The whole population of foundations supporting research and innovation, the sample, and the respondents
Number of foundations Percentage Foundations identified by the Statistical Office (population) 642 100.0
Foundations having an email address (sample) 438 68.2
Respondents 294 45.8
Of which: Foundations that did not support R&I in 2012* 41 6.4
Relevant responses 253 39.4
Of which: The full questionnaire was completed 51 7.9
The short questionnaire was completed 202 31.5
* The overwhelming majority of these 41 foundations was not active in any other way. As one of our respondents and the annual reports of the foundations revealed, this inactivity mainly resulted from a lack of substantial revenue, but administrative reasons and organisational crises also happened to play some part.
1. Very large grantmaking foundations financed mainly from abroad: Magyar-Amerikai Fulbright Alapítvány (the Hungarian American Fulbright Foundation).
2. Very large operating foundations mainly financed (and more or less controlled) by the national gov- ernment: Holocaust Dokumentációs Központ és Emlékgyűjtemény Közalapítvány (the Holocaust Doc- umentation Center and Memorial Collection Public Foundation).
3. Operating foundations established by researchers and professionals committed to a specific issue, research field and/or innovation: Szociális Innováció Alapítvány (the Social Innovation Foundation).
4. ‘Market-oriented’ operating foundations engaged in applied research, project development and eval- uation: Információs Társadalom Alapítvány (the Foundation for Information Society).
5. Innovation-oriented foundations focusing on the promotion of technological progress, sustainable economic development and putting innovative ideas into practice: InfoPark Alapítvány (the InfoPark Foundation).
6. Grant-seeking foundations closely connected to a state-run research institute: Népesedési Kutatások Alapítvány (the Foundation for Demographic Research).
7. Foundations mainly or exclusively dealing with the dissemination of research findings: Közgazdasági Szemle Alapítvány (the Economic Review Foundation).
8. Small grantmaking foundations created in remembrance of scholars well-known in some profession or in a relatively narrow academic community: Illyés Zsigmond Baleseti Sebészeti Tudományos Alapítvány (the Zsigmond Illyés Foundation for the Emergency Surgery Science).
9. Corporate foundations supporting research and innovation in the field its founder is interested in:
Richter Gedeon Alapítványok (the Foundations of the Richter Gedeon Company).
We also wanted to interview the leader of a foundation supporting outstanding scholars and/or very talented young researchers through giving highly prestigious awards. Unfortunately, only two Hungarian foundations belong to this type and neither of them was ready to talk to us. Thus the tenth interview was conducted with an expert on research funding who has been involved in the development of the system for financing R&I activities for more than 30 years.
19
3 Results
3.1 Types of foundation
More than four fifths of the 253 respondent foundations supporting R&I in 2012 were specialised in re- search (Figure 3), while the share of exclusively innovation-oriented foundations was negligible.
About half of the foundations [14] reported only on R&I expenditure, meaning they dealt only with re- search and/or innovation in 2012 (Figure 4). R&I spending was dominant (exceeding 50 % of total expendi- ture) for almost one-third of them. The group of organisations mainly engaged in other activities proved to be relatively small (18 %) compared to R&I focused foundations.
14 Unfortunately, a significant part of the respondents did not provide us with information on their expenditure; several others only partly answered the expenditure question. It also happened that their answers were not consistent.
6 Source: EUFORI survey
6%
82%
12%
Figure 3: Types of foundation in terms of research and/or innovation, 2012 As a percentage of the total number of foundations (N=253)
Innovation Research
Both research and innovation
7 Source: EUFORI survey
51%
31%
18%
Figure 4: Types of foundation in terms of purpose, 2012 As a percentage of the total number of foundations (N=222)
Exclusively R&I focused foundations
Mainly R&I focused foundations Mainly other purpose focused foundations
HUNGARY - EUFORI Study Country Report
Hungarian foundations are fairly active in actual research work. According to our survey results, slightly more than half proved to be operating foundations (Figure 5), while less than one-third confined them- selves to grantmaking. Mixed activities were rather rare.
The Hungarian R&I-oriented foundations (just like the foundation sector as a whole) are relatively new (Figure 6).
As mentioned previously in Chapter 1, foundations have only been established in Hungary since 1987.
Therefore, it is not surprising that almost half of our respondent foundations were created in the 1990s, during a period of extremely rapid growth (see Figure 1) for the foundation sector.
8 Source: EUFORI survey
31%
52%
17%
Figure 5: Types of foundation in terms of grantmaking versus operating, 2012 As a percentage of the total number of foundations (N=248)
Grantmaking Operating
Both grantmaking and operating
Source: EUFORI Survey
0% 0% 0% 0%
13%
44%
37%
6%
Up to 1949 1950-1959 1960-1969 1970-1979 1980-1989 1990-1999 2000-2009 2010-present Figure 6: Types of foundation according to year of establishment, 2012
As a percentage of the total number of foundations (N=46)
21
3.2 Origins of funds
3.2.1 Financial founders
Despite the large number of satellite foundations, the most important financial founders proved to be private individuals, followed by for-profit and nonprofit organisations (Figure 7). The seed money was of private origin in the cases of almost four-fifths of the foundations.
As mentioned above, legal regulations allowed the establishment of foundations with a very small [15]
endowment, thus the founders did not need to be particularly rich or affluent. To take this opportunity was all the more attractive because this was a possible way of remaining outside government control. On the other hand, foundations without a substantial endowment are obviously dependent on their current income, which makes them financially vulnerable.
3.2.2 Income
This vulnerability can also be detected in both the low income and the revenue structure of the Hungar- ian foundations (Figure 8; Tables 4 and 5; Annex tables 1 and 2). According to our survey results, the total income of R&I-oriented foundations was 43 million Euros in 2012. As shown in Figure 8, only a very small part of the foundations had an income of over 100,000 Euros in 2012. The share of foundations with rev- enue under 10,000 Euros was 53 %.
15 In principle, this seed money was supposed to cover at least the initial fundraising or other income generating
expenditure, as well as the costs of the establishment and registration procedure. In fact, lots of Hungarian foundations with an endowment of around EUR 500 were registered, so in the beginning they had to rely on the voluntary work of their founders.
10 Source: EUFORI survey
* Although none of the 48 respondents that provided us with information on their year of establishment was founded by a hospital, there are several foundations with one or more hospitals among their founders in Hungary.
0%
0%
8%
8%
10%
15%
19%
60%
Others Hospitals*
Public sector (government, national or local) Research institutes Universities Other nonprofit organisations (associations etc) For-profit corporations Private individual(s)/families Figure 7: Financial founders, 2012
As a percentage of the total number of foundations, multiple answers possible (N=48)
HUNGARY - EUFORI Study Country Report
The analysis of income sources is based on the 2011 database of the Statistical Office because – thanks to a much more finance-oriented questionnaire – it contains more detailed information than our survey results, [16] while the major categories of revenue sources are either the same or very similar in both surveys. The figures for total income are naturally different. They indicate that R&I-oriented foundations generated more revenue (43 million Euros) in 2012 than in 2011.
16 As far as the composition of the major sources of income is concerned, the results from the two surveys are not
significantly different. If we calculate on the basis of the EUFORI data (Annex tables 1 and 2) after deducting the amount whose sources are not identified or classified as ‘Other’ by the respondents, the revenue structure we find is as follows: income from endowment 2.2 %, individual donations 0.4 %, corporate donations 10.1 %, support from NPOs 1.7 %, government support 66.7
%, and income from service fees and sales 18.9 %.
11 Source: EUFORI Survey
88%
6%
2% 0%
0% 1% 3%
Figure 8: Total income by category in Euros, 2012
As a percentage of the total number of foundations (N=250)
EUR 0-100 000
EUR 100 000-1 000 000 EUR 1 000 000-10 000 000 EUR 10 000 000-100 000 000 EUR 100 000 000 or more Don't know
Don't want to answer this question
Table 4: Amount and composition of the total income by sources, 2011 (N=642)
Sources Income in Euros Percentage
Income from an endowment 1 035 214 2.5
Income from private donations 6 910 329 16.5
Of which: Donations from individuals 747 254 1.8
Donations from for-profit corporations 5 411 844 12.9
Donations from other nonprofit organizations 751 231 1.8
Income from government 27 800 993 66.3
Of which: Income from national, regional and local governments 4 800 257 11.4
Income from EU and other foreign governments 23 000 736 54.9
Service fees, sales, unrelated business income 6 142 366 14.7
Other 18 172 0.0
Total 41 907 074 100.0
Source: Database of the Central Statistical Office
23
The most important source of revenue for Hungarian R&I-oriented foundations is government support, but only a small part (less than one fifth) of this comes from the Hungarian government. [17] The main donors are the European Union [18] and some foreign (e.g. the US, Austrian, Norwegian) governments. As one of our interviewees explained, the latter have made some attempt to convince the Hungarian govern- ment that it should increase its contribution, but without any success. Another interviewee even blamed one of the Hungarian ministries for ‘directing its hopes and efforts to get EU support instead of lobbying for an increase of R&I spending in the budget debate’.
The share of services fees, sales and unrelated business income is about one-sixth of the total revenue, slightly lower than that from private donations. Understandably enough, corporations are by far the most important private supporters, while the contribution by other nonprofit organisations and private indi- viduals is rather small. Although the culture of giving has developed a lot in Hungary over the last few decades, the concentration of individual donations in the traditional fields of charity (health and social care, education) and the lack of interest in research and innovation have remained unchanged (Czakó et al., 1995; Czike and Kuti, 2006).
The income from endowment does not play an important role in financing R&I-oriented foundations, either. With very few exceptions, the donation of money by the initial founder(s) is the source of original endowment. Since the amount of this original endowment was generally very small, consequently inad- equate for generating significant income, most of the founders did not insist on its maintenance. Four fifths of the foundations are supposed to expand, but also allowed to spend down their endowment at the trustees’ discretion. No wonder, then, that ‘only a handful of foundations own sufficient capital’ (Wizner and Aszalos, 2007, p. 200). However, the almost negligible return on financial investments also has to do with the very low Hungarian interest rate, the foundation boards’ ignorance of investment opportunities and their willingness to avoid risk.
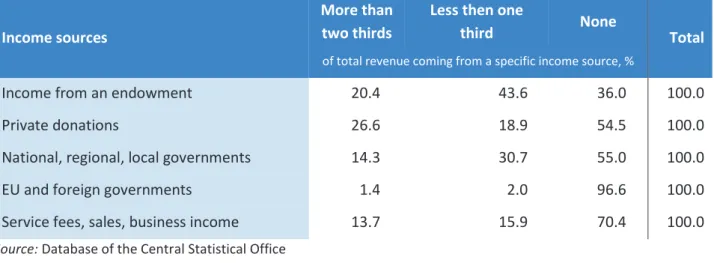
It is worth noting that the overall financial importance of the different elements of revenue does not cor- respond with their accessibility (Table 5). The single most important foreign grants are available only for 3 % of the foundations supporting R&I, while almost two-thirds of them receive some income from their endowment.
17 This relatively small contribution by the Hungarian government, together with the low share of public sector bodies among financial founders (Figure 7), explains that direct government participation in the operating of foundations proved to be quite rare. 5 % of our respondents (N=21) had government representatives on their governing board; 10 % reported such a presence on their supervisory board. When rating the government’s influence on their decision-making on the allocation of funds for R&I on a scale of 0-10 (Not influential – Totally influential), the average score given by the same respondents was only 3.2.
18 Most of the EU money comes from the Structural Funds through a government-controlled system of applications, but some Hungarian foundations also have access to direct EU support.
HUNGARY - EUFORI Study Country Report
About one third of the foundations earn some income through the provision of services and slightly less than half of them have access to private donations and government support. The surprisingly high share of foundations receiving some support from the state budget is a result of the 1 % system. Individual taxpay- ers can be fairly easily contacted by foundations having close relationships with universities and hospitals, and it is not too difficult to get some 1 % support through their assignment decision. However, the major- ity of state support is distributed by government authorities and is only available for a small number of foundations.
3.2.3 Assets
According to the respondents of the EUFORI survey, the amount of total assets was 26 million Euros in 2012 (Annex tables 3 and 4). More than four fifths of the foundations had very small assets (Figure 9).
13
Table 5: Composition of foundations according to the importance of the different income sources within their total revenue, 2011 (N=642)
Income sources
More than two thirds
Less then one
third None
Total
of total revenue coming from a specific income source, %
Income from an endowment 20.4 43.6 36.0 100.0
Private donations 26.6 18.9 54.5 100.0
National, regional, local governments 14.3 30.7 55.0 100.0
EU and foreign governments 1.4 2.0 96.6 100.0
Service fees, sales, business income 13.7 15.9 70.4 100.0
Source: Database of the Central Statistical Office
Source: EUFORI Survey
82%
14%
1% 0% 0% 1% 2%
Figure 9: Total assets by category in Euros, 2012
As a percentage of the total number of foundations (N=241)
EUR 0-100 000
EUR 100 000-1 000 000 EUR 1 0000 00-10 000 000 EUR 10 000 000-100 000 000 EUR 100 000 000–1 000 000 000 Don't know
Don't want to answer this question
25
The composition in terms of types of asset (Figure 10) supports our former statement about the founda- tion boards’ very cautious investment behaviour, which is rooted partly in their willingness to avoid risks but also in the uncertainties of the financial environment and the lack of capital market experience and skills.
Current assets (cash and other assets that can be converted into cash or consumed within a short time) accounted for almost three quarters of the total assets in 2012. The share of all kinds of long-term invest- ment that might generate much higher returns proved to be low. None of the respondents reported on any investment in special funds.
3.3 Expenditure
3.3.1 Total expenditure
The total expenditure of the Hungarian R&I-oriented foundations added up to EUR 42.5 million in 2012 (Annex tables 5 and 6). As mentioned previously, the overwhelming majority of these foundations were very small organisations with extremely low incomes. It is not surprising, then, that almost nine tenths of
15 Source: EUFORI Survey
74%
10%
14%
0% 2%
Figure 10: Distribution of assets, 2012 As a percentage of total (known) assets
Current assets (N=27)
Long-term investments–Securities (N=28)
Long-term investments–Fixed assets (N=28)
Long-term investments–Special funds (N=28)
16 Source: EUFORI Survey
86%
9%
1% 0% 0% 1% 3%
Figure 11: Total expenditure by category in Euros, 2012 As a percentage of the total number of foundations (N=248)
EUR 0-100 000
EUR 100 000-1 000 000 EUR 1 000 000-10 000 000 EUR 10 000 000-100 000 000 EUR 100 000 000 or more Don't know
Don't want to answer this question
them spent less than EUR 100 000 in 2012 (Figure 11).
One quarter of the total expenditure served research purposes (Figure 12), another 6 % went to innovation
and more than two thirds of the total expenditure was used outside the field of research and innovation.
This is explained by the fact that there are some huge foundations in Hungary that combine several activi- ties. Some of them are higher education-related foundations (e.g. the Tempus Foundation) with a clear focus on student fellowships and other education-oriented programs where support for research is sec- ondary. Another type was described by one of our interviewees as follows:
The foundation has several activities, out of which running the Holocaust Museum with its permanent exhibition and the Documentation Centre collecting documents about the Hungarian Holocaust victims are the most important ones. Besides, the foundation organises travelling exhibitions, events, conferences, teacher training courses and the Holocaust Memorial Day. Its research activity focuses on the analysis of twentieth century Jewish history in Hungary.
It is also quite common that foundations connected to hospitals are much more involved in improving health services and/or helping (sometimes even organising) the training of employees than in supporting research projects and promoting doctors’ scientific careers.
Even the completely research-oriented foundations tend to combine their scientific work with related 17
Source: EUFORI survey
25%
6%
69%
Figure 12: Distribution of total expenditure in terms of research, innovation and/or other purposes, 2012
As a percentage of the total known expenditure (N=227)
Expenditure on research Expenditure on innovation Expenditure on other purposes
27
educational programs.
As one of our interviewees, the head of a foundation mainly engaged in applied IT research, reported: in its most prosperous period the foundation worked a lot for banks and similar financial institutions. There were years when it had research contracts from 50-60 market organisations and ran over 110 projects. In parallel, the foundation became an accredited adult education institution with several specific and unique training programs, e.g. the IT Safety Expert course, the Bank Information Technology or the Electronic Signature training.
3.3.2 Research
Only 48 % of the total research expenditure went directly to scientific institutions, projects and programs (Annex table 7). Slightly more than half of them financed research-related activities, mainly the dissemina- tion of scientific results, scientific communication, and researchers’ mobility.
About half of the research-oriented foundations supported basic research, while three quarters of them dealt with applied research (Figure 13). The overlap between the two was 30 %.
18 Source: EUFORI survey
54
76
0 10 20 30 40 50 60 70 80
Basic research Applied research
Figure 13: Total expenditure on research Basic vs Applied, 2012
As a percentage of the total number of foundations, multiple answers possible (N=37)
HUNGARY - EUFORI Study Country Report
Not much more than one quarter of the known research expenditure went on basic research (Annex table 8), probably because basic research is generally very expensive and closely connected to the Academy of Sciences and universities; thus foundations can only afford to take part in it through organising and funding low budget research-related activities. In addition, it is obviously more difficult to raise funds and generate demand for basic research than for applied research projects because the latter’s purposes and practical utility are more often clear at first glance.
Research grants consumed more than half of the foundations’ research expenditure in 2012 (Annex ta- ble 9). This probably had to do with the large number of satellite foundations that were created mainly in order to support their parent institutions. However, the presence of some really large grantmaking foundations (e.g. Tempus, Fulbright) was also responsible for the high share of research grants. The share of operating costs was only 24 %, but we have every reason to believe that most of the ‘Other research expenditure’ actually belongs to the category of operating costs.
3.3.3 Innovation
Grantmaking seems [19] to be much less important in supporting innovation than in the field of research (Annex table 10). It accounts for only one fifth of the innovation expenditure; the other 80 % makes up the operating costs of foundations engaged in innovation.
3.3.4 Changes in expenditure
Very few (only 12 %) of the foundations were able to increase their expenditure in 2012 (Figure 14). More than one-third of them had to spend less than before; another 5 % could not continue financing their former activities at all.
19 The extremely low number of valid cases makes any further analysis impossible.
Source: EUFORI survey
12%
44% 34%
5% 5%
Figure 14: Changes in expenditure on research and innovation compared to the previous year, 2012
As a percentage of the total number of foundations (N=41)
Increased Decreased
Remained about the same Discontinued
Just started to support research and/or innovation
29
With one exception, [20] all the foundation leaders we interviewed complained about financial difficulties.
As they explained, the economic crisis was harmful for them in several different ways. It equally reduced the market demand for their services and the amount of international, governmental and corporate sup- port. The problem was even aggravated by government policy. In the words of one of our interviewees:
The state – in order to balance the budget – hunted down all the sectors that were able and traditionally willing to sponsor research. The government introduced the bank tax, the telecom tax, the chips tax, the
transaction tax and it keeps tapping these sectors...
In this situation, it is not enough to know personally the director of a bank; it is no use to go there to ask for support.
The expectations were not very different from the previous year’s experiences (Figure 15). Only one fifth of the foundations hoped for an improvement, while 36 % of them were definitely pessimistic.
The overall evaluation of the perspectives also depended on the size of the endowment, as is reflected in the following statements of two of our interviewees.
20 The HR executive of a large pharmaceutical company stated that the corporate support to their ‘own’ foundations remained unchanged despite the economic crisis.
20 Source: EUFORI survey
21%
24%
43%
12%
Figure 15: Changes in expenditure on research and innovation, expectations for the next year, 2012 As a percentage of the total number of foundations (N=42)
Increase Decrease
Remain about the same Discontinue
12% 21%
43% 24%
HUNGARY - EUFORI Study Country Report
It is good that the foundation is behind us as a reservoir;
sometimes it is full, at other times it can be drained.
Although we can survive somehow until the middle of next year, without additional resources we will have to shut up shop then.
3.4 Focus of support
3.4.1 Beneficiaries
The survey question about beneficiaries was answered by very few respondents (N=16), so the informa- tion we received is not reliable. Moreover, the figures seem to be misleading, thus we prefer not to ana- lyse them. Instead, we can rely on the data from the Statistical Office (Tables 6 and 7).
The majority of the R&I-oriented grantmaking foundations supported partly or exclusively private indi- viduals. Nevertheless, the total amount of grants given to organisations (universities, scientific societies, research institutes, hospitals etc.) was five times higher than to individuals (researchers, professors, stu- dents etc.).
Table 6: The number of R&I-oriented foundations and grants according to the beneficiaries of grantmaking activities, 2011 (N=642)
Grantmaking activities R&I-oriented foundations’ Grants made by them Number Percentage Amount in Euros Percentage
No grant (operating foundations) 412 64.2 – –
Grants only to individuals 145 22.6 2 214 695 8.6
Grants only to organisations 47 7.3 809 003 3.1
Grants to individuals &
organisations 38 5.9 22 771 353 88.3
Total 642 100.0 25 795 051 100.0
Source: Database of the Central Statistical Office
31
22
Table 7: The composition of grants given to individuals and organisations according to the form of support, 2011 (N=642)
Form of support Grants to individuals Grants to organisations Amount in Euros Percentage Amount in Euros Percentage
Financial grant 4 220 841 94.4 21 178 403 99.3
In-kind support 249 200 5.6 146 607 0.7
Total 4 470 041 100.0 21 325 010 100.0
Source: Database of the Central Statistical Office
It is also interesting that the in-kind support played a significantly more important (although still not very important) role in helping private individuals than in supporting organisations. Our interviewees men- tioned many specific forms of this in-kind support, including free access to scientific publications, office and laboratory facilities, and legal, information and administrative services, etc.
3.4.2 Research fields
Foundations may naturally focus on several different research fields, thus the sum of percentages dis- played in Figure 16 exceeds 100 %. However, multi-focus foundations proved to be rare in Hungary; about four fifths of the respondents supported only one research field.
The two most supported fields were the social and medical sciences; almost one third of the foundations played some role in helping their work, while the agricultural sciences proved to be almost neglected. The share of supporters of the natural sciences, the humanities, and engineering and technology was about 20 %.
23 Source: EUFORI survey
1 %
9 %
18 % 20 %
23 %
30 % 31 %
Other Agricultural sciences Engineering and technology Humanities Natural sciences Medical sciences Social and behavioral sciences
Figure 16: Thematic research fields, 2012
As a percentage of the total number of foundations, multiple answers possible (N=239)