Obuda University ´
Doctoral Dissertation
Development of novel measurement methods for neuroscientific research and dentistry
G´ abor Orb´ an
Supervisor:
Gergely M´ arton, PhD
Doctoral School on Materials Sciences and Technologies
Budapest, March 24, 2021
Komplex vizsga bizotts´ag:
Eln¨ok: Horv´ath Zsolt J´ozsef, DSc, egyetemi tan´ar, ´OE Tagok: Csik´osn´e Pap Andrea, PhD, egyetemi docens, ´OE
Hars´anyi G´abor, DSc, egyetemi tan´ar, BME
Nyilv´anos v´ed´es bizotts´aga:
Opponensek: Csik´osn´e Pap Andrea, PhD, egyetemi docens, ´OE Somogyv´ari Zolt´an, PhD, ELKH Wigner FK RMI Eln¨ok: Horv´ath Zsolt J´ozsef, DSc, professor emeritus, ´OE Titk´ar: Kov´acs T¨unde Anna, PhD, egyetemi docens, ´OE Tagok: Nemcsics ´Akos, DSc, egyetemi tan´ar, ´OE
Baji Zs´ofia, PhD, tudom´anyos munkat´ars, ELKH EK MFA Bogn´ar Gy¨orgy, PhD, egyetemi docens, BME VIK EET
Nyilatkozat a munka ¨ on´ all´ os´ ag´ ar´ ol, irodalmi forr´ asok megfelel˝ o m´ odon t¨ ort´ ent id´ ez´ es´ er˝ ol
Alul´ırottOrb´an G´abor kijelentem, hogy aDevelopment of novel measurement meth- ods for neuroscientific research and dentistry c´ım˝u beny´ujtott doktori ´ertekez´est magam k´esz´ıtettem, ´es abban csak az irodalmi hivatkoz´asok list´aj´an megadott forr´asokat haszn´altam fel. Minden olyan r´eszt, amelyet sz´o szerint, vagy azonos tartalomban, de ´atfogalmazva m´as forr´asb´ol ´atvettem, a forr´as megad´as´aval egy´ertelm˝uen megjel¨oltem.
Budapest, March 24, 2021
Orb´an G´abor
Nyilatkozat a nyilv´ anoss´ agra hozatalr´ ol
Alul´ırott Orb´an G´abor hozz´aj´arulok a Development of novel measurement meth- ods for neuroscientific research and dentistry c´ım˝u doktori ´ertekez´esem interneten t¨ort´en˝o nyilv´anoss´agra hozatal´ahoz az al´abbi form´aban:
korl´atoz´as n´elk¨ul;
el´erhet˝os´eg csak magyarorsz´agi c´ımr˝ol;
el´erhet˝os´eg a fokozat oda´ıt´el´es´et k¨ovet˝oen 2 ´ev m´ulva, korl´atoz´as n´elk¨ul;
el´erhet˝os´eg a fokozat oda´ıt´el´es´et k¨ovet˝oen 2 ´ev m´ulva, csak magyarorsz´agi c´ımr˝ol.
Budapest, March 24, 2021
Orb´an G´abor
Contents
List of acronyms 8
1 Introduction 9
1.1 Electrophysiology - a short overview . . . 10
1.1.1 Electroencephalography . . . 10
1.1.2 Electrocorticography . . . 11
1.1.3 Implanted microelectrode arrays . . . 11
1.2 Combining electrophysiology with optical imaging . . . 13
1.2.1 Simultaneous electrophysiological and optical measurement method in the field of neuroscience . . . 15
1.3 Electrophysiology in the field of dentistry . . . 16
1.3.1 The dentin recording . . . 17
2 Specific aims 21 2.1 Simultaneous electrophysiological recording and two-photon imaging in vitro . . . 21
2.2 Simultaneous electrophysiological recording and two-photon imaging in vivo . . . 21
2.3 Determination of the thickness dependent electrical impedance spec- trum of the human dentin . . . 22
3 Materials and Methods 23 3.1 Materials and methods related to the simultaneous electrophysiolog- ical recording and two-photon imaging . . . 23
3.1.1 Preparation of physiological experiments . . . 23
3.1.2 Two-photon imaging . . . 25
3.1.3 Electrophysiological measurement . . . 26
3.1.4 Data analysis . . . 29
3.2 Materials and methods related to the determination of the thickness dependent electrical impedance spectrum of human dentin . . . 35
3.2.1 Specimen preparation . . . 35
3.2.2 Thickness measurements . . . 36
3.2.3 Impedance measurement system . . . 36
3.2.4 Impedance measurement . . . 37
3.2.5 Data analysis . . . 38
4 Results and Discussion 39 4.1 Results concerning the simultaneous electrophysiological recording and two-photon imaging . . . 39
4.1.1 Results concerning the simultaneous in vitro experiments . . . 40
4.1.2 Results concerning the simultaneous in vivo experiments . . . 48
4.2 Discussion concerning the simultaneous electrophysiological recording and two-photon imaging . . . 50
4.3 Results concerning the determination of the thickness dependent elec- trical impedance spectrum of human dentin . . . 51
4.4 Discussion concerning the determination of the thickness dependent electrical impedance spectrum of human dentin . . . 53
5 Overview of the new scientific results 55 5.1 First thesis group: Simultaneous utilization of electrophysiological recording and two-photon imaging . . . 55
6 Author’s publication list 57 6.1 Papers closely related to the PhD dissertation . . . 57 6.2 Papers not closely related to the PhD dissertation . . . 57 6.3 Utility patents . . . 58
7 Acknowledgements 60
List of Figures 60
Bibliography 81
List of acronyms
Acronym Reconstitution
aCSF Artificial cerebrospinal fluid
AP Anteroposterior
BCI Brain-computer interface CCD Charge-coupled device
CW Cranial window
ECoG Electrocorticography EEG Electroencephalography FFT Fast Fourier transform
GEVI Genetically encoded voltage indicators HAS Hungarian Academy of Sciences
IIR Infinite impulse response
IR Infra red
ITO Indium tin oxide
LFP Local field potential
MEA Microelectrode array
MEMS Micro-electromechanical system
ML Mediolateral
PCA Principal component analysis
QD Quantum dot
RCNS Research Centre for Natural Sciences SEM Scanning electron microscope
SUA Single unit activity
UV Ultra violet
Chapter 1 Introduction
Electrophysiology is the scientific area of observation and study of the electrical properties of the biological cells and tissues. This dissertation could be split into two parts according to this definition. Both main research projects which will be presented herein are based on electrophysiology. The aim of the first one is the simul- taneous utilization of an electrophysiological measurement method and an optical imaging process for neuroscientific research, where the principal targets of observa- tion are neurons. The second presented research topic is related to human dental structures. During this research an electrical property of a biological tissue, namely the electrical impedance of the human dentin has been measured, and a formula has been determined to evaluate its dependency on geometric thickness and signal frequency.
During my scientific activities I have studied and observed the central nervous system and I have taken part in neural electrode system development and validation projects from the conceptualization to the performance of in vitro and in vivo experiments.
These research topics led me to the results of my first thesis group, thus in the first part of the introduction chapter the electrophysiological methods will be reviewed which are used in the field of neuroscience.
One of my aims was to observe the peripheral nervous system in the pulp of the hu- man teeth, by using a measurement method on dentin. In order to reach this goal, it was essential to perform numerous electrophysiological experiments on human teeth to observe their electrical properties. Since my second thesis point is based on the results of this observation, therefore in the second part of the introduction chapter I give an overview of the experimental and clinical utilization of electrophysiological methods in the field of dentistry.
The scientific work related to the simultaneous electrophysiology and two-photon
imaging was performed at the Comparative Psychophysiology research group under the leadership of Prof. Dr. Istv´an Ulbert at the Institute of Cognitive Neuroscience and Psychology, Research Centre for Natural Sciences, E¨otv¨os Lor´and Research Net- work. The scientific activity in the field of dentistry was executed at the Department of Oral Diagnostics, Faculty of Dentistry, Semmelweis University with the contribu- tion and guidance of Prof. Dr. Csaba Dob´o Nagy.
The specific aims of the dissertation will be defined after the first chapter, which is followed by the description of the various factors which led me to reach these scientific aims.
1.1 Electrophysiology - a short overview
By electrophysiology we mean the observation of electrical functions of the nervous system. The measurement principles of electrophysiology rely on the forms of infor- mation transfer among neurons, which form the basis of our nervous system. During this transfer transmembrane currents rise and fall [1]. Neurons can process signals and communicate with each other partly via these transmembrane currents. Since the electrical conductance of the extracellular space is finite [2], the membrane cur- rents create electric potential differences inside the neural tissue [3], which propagate outside the neural tissue as well, e.g. onto the scalp [4]. The measurement of these electric potential differences makes the observation of the functions of specific brain regions as well as the connection between brain regions possible [5, 6]. Electrophysi- ological measurements helped neuroscientists diagnose and to observe the causes of some neurological disease such as autism or epilepsy [7,8], and led to the development of treatments which make neural diseases like Parkinson’s disease asymptomatic [9].
Electrophysiological measurement methods which yield signals of neural activities with high information content, such as electroencephalography (EEG), electrocor- ticography (ECoG) and intracortically implanted high density microelectrode arrays (MEAs), have vastly contributed to the progress of neuroscience and brain-computer interfacing (BCI) [10–13]. In the next subsections these measurement methods will be reviewed.
1.1.1 Electroencephalography
from membrane current of the neurons [14]. It became a widespread neuroimaging method since it is relatively cheap, noninvasive, and it can record the potential changes of the neural tissue with a temporal resolution in the range of milliseconds [15]. Since the measurable electrical activity of the neurons on the scalp is usually a summed and synchronized signal, the main disadvantage of the utilization of EEG is its low spatial resolution [14] and the fact that EEG source localization is an inverse problem, as potential differences on the surface of a spheroidal object can be generated in infinite number of variations of internal source patterns. This prevents perfect spatial localization of the neural activities from the signals recorded on the scalp [16]. Furthermore, the signal-to-noise ratio of EEG is poor due to the insulating effect of the skull. In spite of these disadvantages, EEG is a ubiquitous measurement method in neuroscientific experiments [17],and in the clinic for diagnostic [8, 18]
and therapeutic [19] purposes. EEG has a huge impact on brain-computer interface development as well [20, 21].
1.1.2 Electrocorticography
Electrocorticography is similar to EEG but the electrodes are placed on the surface of the brain so as to record the electrical activity of the neural tissue [22]. This measurement method has benefits comparing to EEG since the electrodes on the surface of the brain eliminate the insulating effect of the skull, thus it has better signal-to-noise ratio and spatial resolution [23]. The main disadvantage of ECoG is its invasiveness so it is used only under particular consideration in human cases. In terms of animal experiments, ECoG was an important method for creating brain function mapping and observing the connectivity of specific areas of the brain [24]. One of the most widespread clinical utilization of ECoG is the localization of the epileptic foci in order to minimize the volume and the functional effect of the necessary lesion during surgery [25]. Similarly to EEG, ECoG is a promising method in the development of BCIs for controlling limb prostheses [13, 26] and expanding communication abilities [27].
1.1.3 Implanted microelectrode arrays
The application of implanted microelectrode arrays is a highly invasive measure- ment method, on the other hand these devices are not only capable of recording the summed bioelectrical activities of neuron populations (i.e. local field potentials, LFPs), but they can also detect individual activities of neurons (i.e. single unit ac- tivities, SUAs) [28, 29]. These methods had an instrumental role in the functional
mapping of the brain [30] and they are still the ultimate solution when high spatial and temporal resolution are required [13, 31, 32]. In the last few years significant improvement was reached in the field of thought controlled communication due to the utilization of intra-cortical MEAs. Such communication is essential for people with locked-in syndrome, which is the inability to move and to speak despite being fully awake, due to for example a brainstem injury. Monitoring the signals of specific brain region can allow the control of a cursor on a computer screen or typing on a virtual keyboard [33–36]. These kind of BCIs are the key for movement restoration too. If neural interface controlled assistive devices could be driven accurately and with low latency that would be helpful to people with paralysis or limb loss too.
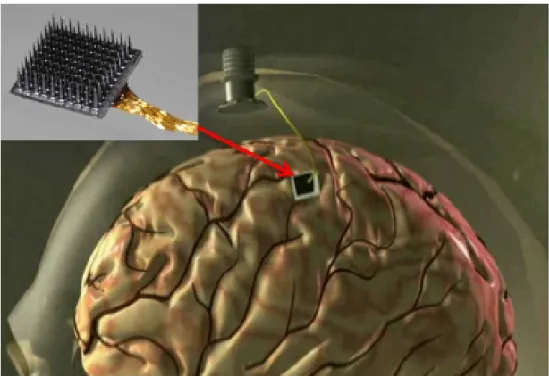
Previous studies on monkeys show that BCIs are able to restore broken neural con- nections between the brain and a limb (or a prosthetic limb) via the utilization of inctracortical electrodes [37–40]. Recent researches present promising results in the application of these kind of BCIs in human patients with paralysis [11, 41–43]. Most BCIs which were created to help people with limb paralysis or brainstem injury are based on a specific intracortical MEA, the UTAH array (Blackrock Microsystems, Salt Lake City, USA), which is a silicon based MEA with 96 electrodes on shanks in a matrix arrangement designed to record the electrical potentials in a volume of a specific region of the cerebral cortex, as it is shown in Figure 1.1.
Figure 1.1: An implanted UTAH array can form the basis of BCI devices for subjects whose
wide volumes [45]. Furthermore, the long term use of implanted MEAs is corrupted by the degradation of their performance over weeks or months, let alone years [46–
48]. The underlying causes range from material failures [49, 50] to the deteriorative effects of the immune response to the implants [51–53].
1.2 Combining electrophysiology with optical imaging
In the last few decades, various optical imaging methods became widely used in neu- roscience, which can render wide brain regions observable with high spatial resolu- tion [54–58]. Furthermore, the application of two-photon microscopy with fluorescent calcium indicators makes the monitoring of neural activity (e.g. action potentials of individual cells) possible [59–62].
The two-photon laser scanning microscopy is a long-established procedure in the field of neuroscience [63], which is based on the physical effect of the two-photon excitation. During the two-photon imaging the fluorophore molecule is activated with two lower energy photons then it decays back to its fundamental state while it has a photon emission with lower energy than the sum of the two exciting pho- tons. The application of two exciting photons allows us to define the volume of the neural tissue where we would like to observe the fluorescence activity but high pho- ton concentration within the observed volume is required which can be reach by the utilization of high power femtosecond pulse synchronized laser [64]. The focal length of fluorescence microscope objectives can exceed 12 mm [65], which allows the implantation of depth MEAs into the optical cranial window (CW) [66]. How- ever, the high density MEAs can cover the observation area under the array of the electrode field. To resolve this problem, MEAs based on transparent substrates and transparent conductive layers have been developed as it is representatively shown in Figure 1.2.
The most commonly used transparent substrates are the polyimide and the SU-8.
Polyimide is used as an insulator and passivation layer in the manufacturing pro- cess of integrated circuits and micro-electromechanical systems (MEMS) chips for protecting the electronic components from moisture and mechanical effects, while in neuroscience it is often used as a flexible insulator substrate for MEAs [68, 69].
Preparation of a polyimide substrate is relatively easy as it can be patterned with dry etching or with photolithography by ultra violet light (UV) [?] after heat treat- ment. Polyimide has an optical transmittance of more than 85% in the visible light region [70] which makes it suitable for a substrate material of implanted MEAs.
SU-8 is an epoxy-based negative-tone photoresist which can patterned with near
UV lithography. It is commonly used for fabricating MEMS and microfluidic sys- tems since it is suitable for high aspect ratio applications [71]. Its dense crosslinked structure offers mechanical stability, yet it has high transparency over 360nm. Over the wavelength of 500 nm the transmittance of SU-8 exceeds 95% [72].
The fabrication of transparent MEAs requires the conductive layer to be prepared from transparent materials too. In this regard, graphene is a promising material.
Polymer based graphene MEAs are flexible, biocompatible and transparent on a wide wavelength ranging from UV to infrared (IR) so they are suitable for elec- trophysiological measurements and optical observations too [67]. Graphene layers can be produced with chemical vapor deposition. Another suitable transparent con- ductive layer material for electrophysiological measurements is the indium tin oxide (ITO) [73]. The preparation of ITO is easier than the preparation of graphene, al- though ITO has the optical transmittance of only 80% in the relevant wavelengths which is less than the 90% transmittance of graphene. ITO layer production can be performed with chemical vapor deposition as well.
There are conductive polymers which could form the electrodes of the MEA as well. Conducting polymers have attracted much interest as suitable matrices of biomolecules and have been used to enhance the stability, speed and sensitivity of various biomedical devices. They are easy to synthesize and versatile because their properties can be readily modulated by surface functionalization techniques [74, 75].
On the surface of the electrode sites of neural implants conductive polymers are Transparent
ECoG MEA
Opaque ECoG MEA Transparent
implanted MEA
A B
C
100 μm 300 μm
100 μm 300 μm
used for increasing long term cell stability and higher signal to noise ratio by decreasing the electrode impedances [76]. The commonly used conductive poly- mers on neural interfaces are the polypyrrole/peptide [77], PEDOT (i.e. Poly(3,4- ethylenedioxythiophene)) [78,79], polythiophene [80]. With the utilization of conduc- tive polymers neuroscientists can achieve better electrode-neural tissue connection and decreased immune response near the electrodes [78]. Conductive polymers could be used as electrodes similarly to graphene or ITO, but it seems to be too difficult to synthesize a conductive and transparent polymer layer, moreover the preparation of polymer structure with wide range of optical transmittance is quasi impossible [81].
Although the proper transparent layer from conductive polymers has yet to be de- veloped, they can be applied for another purpose when we aim for combining the implanted MEAs with the optical imaging. This application is based on quantum dot (QD) preparation from them. MEA electrodes covered by fluorescent QDs can indicate the location of the conductive site during two-photon imaging, thus it helps to perform optical imaging and electrophysiological recording from the same tissue region. Fluorescent QDs can be prepared from PEDOT by deposition of molecules on the surface of a conductive polymer (ITO) [82, 83]. The deposited PEDOT layer can be removed by ultrasound and it goes through several filtering steps, before it is deposited on the surface of a neural electrode [83]. Thus prepared molecules are already fluorescent so they can be used in fluorescence optical imaging as markers as shown in Figure 1.3.
20 μm
Figure 1.3: Two-photon imaging of patch-clamp pipette filled with a solution containing fluores- cent QDs, inserted into the neural tissue. The tissue had been injected with fluores- cent markers [82]
1.2.1 Simultaneous electrophysiological and optical mea- surement method in the field of neuroscience
Simultaneous application of depth MEAs for extracellular electrophysiology and two-photon imaging could allow neuroscientists to observe activities of individual
neurons with good spatial and temporal resolution at the same time, thus the more precise and complex pieces of information could be obtained from neural activity [84].
The extension of high density intracortical recordings with simultaneous two-photon microscopy would enable three dimensional optical monitoring of the structural fea- tures of the cells located close to the electrode. Nonetheless, the co-localized and simultaneous application of two-photon imaging and electrophysiological measure- ment by MEAs remains challenging, partly because of the photoelectric artefacts on the electrophysiological recordings caused by the imaging laser [85]. The artefacts generally appear as huge sawtooth-like waves. The main frequency of such waves correspond to the imaging frame rate of the applied two-photon laser. The frame rate of the imaging is indeterminate, moreover, the sharp shape of the waves and other effects introduce various harmonics other than the main frequency, thus elim- ination of the photoelectric artefacts requires more subtle methods than applying e.g. a notch filter. Comb filters have already been successfully used for decreasing stimulus artefacts [86] and 50 Hz low frequency noise [87] from electrophysiological signals, while adaptive filters are utilized e.g. in brain-computer interface develop- ment [88,89], in simultaneous measurements of real-time magnetic resonance imaging and electrocardiogram recordings [90], in fetal electrocardiogram analysis [91], etc.
1.3 Electrophysiology in the field of dentistry
Hard tissues, like the human bone or dentin, can be characterized with electri- cal properties such as intrinsic resistivity, electrical conductivity, dielectric constant or capacitance. I have performed observations on human dentin thus before the overview of the experimental and clinical utilization of electrophysiological meth- ods in the field of dentistry a short introduction will be given about the underlying principles of these methods.
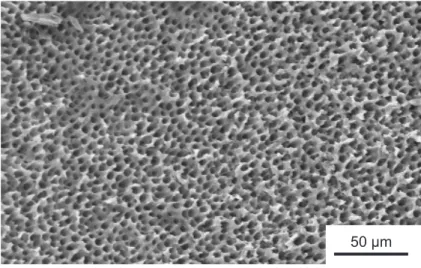
Dentin is one of the major hard tissue components of teeth. It can be found under the enamel and it surrounds the entire pulp. This tissue contains micro channels projecting radially from the pulp to the enamel called dentin tubules. The density of dentin tubules near the pulp on the inner dentin is 55000−75000/mm2, near the enamel on the outer dentin it is 15000−20000/mm2. The diameter of the tubules is different as well, near the pulp they are approximately 3−4µmwide, on the border
dentinogenesis, the formation of dentin [97]. Axons of odontoblasts, collagen fibers and the axons of dental nerves can be located in the dental tubules which makes the inner dentin more sensitive during dental treatment. The dentin tubules are filled with ionized dentinal fluid thus if the dentin becomes exposed the bioelectrical activity of the nerves placed in the pulp becomes measurable on the surface of the dentin. This method is called dentin recording.
50 μm
Figure 1.4: Scanning electron microscope (SEM) image of dentin tubules of an examined dentin disk
1.3.1 The dentin recording
Dentin tubules are able to convey both the harmful and medical substances. Bacteria produced toxins may reach the pulp through the tubules which can irritate the nerves in the pulp thus they evoke dental pain [98]. The dental pain, which can be felt during a dental treatment because of mechanical, thermal or hydrostatic stimuli, is conveyed through the dental tubules too. Dentin recording is based on the observation method of the dental fluid flow and the ion current through the dentin tubules.
Dentin recording can allow us to observe the process of dental pain and pulp in- flammation which may led us to localise the source of the stimulus which caused the sensation [99]. These techniques also let the fluid flow through the tubules to be inspected and facilitate the examination of the neural control of the fluid flow [100–103]. In order to record one dental nerve activity separated from the oth- ers it is necessary to develop electrodes with small size [104]. The changes of the hydrostatic pressure of the dental fluid in the dental tubules have also been mea- sured to calculate the electrical field of the pulp [105]. Beyond these observations
several experiments aimed to track the effect of some kind of stimulus via measur- ing the bioelectrical activity of tooth nerves [106]. Thus performed pulp sensibility testing has been and still remains a very helpful aid in endodontic diagnosis [107].
The application of these measurements to determine the underlying cause of dental pain have also been a subject of research [108–110]. If the pain is generated by an artificial stimulus like hydrostatic pressure on the surface of the dentin, the sensi- tivity of a specific dentin region can be investigated via dentin recording [111]. The response can be recorded with anin vivo dentin recording method at different levels of hydrostatic pressure stimuli as it is shown in Figure 1.5.
Dentin 2 mm
Steel tube Ringer solution Silver wire Epoxy resin Polyimide tube Fissure sealant
Enamel
Figure 1.5: Measurement arrangement of an in vivodentin recording experiment. Hydrostatic pressure was applied in vivo on the surface on the dentin and the nervous response was recorded [111]
A series of experiments have been performed utilizing different stimuli to specify the required threshold voltage and current for electrical stimulation [112]. In spite of the in vivo methods, these values can be defined more precisely with in vitro experiments. In vitro experiments of dentin recording are useful e.g. for the valida- tion of resin-dentin bonding surfaces. For this purpose electrochemical impedance spectroscopy was applied as a potentially nondestructive quantitative method for measuring the stability of resin films and resin-bonded dentin over time [113]. The measurement arrangement which was used for these experiments is shown in Fig- ure 1.6. The idea of this split chamber has formed the base of myin vitro measure- ment arrangements for my dental experiments. The only fluidic connection between the half cells of the U shaped chamber was through the dentin disk, hence the
Spacer Resin film Electrolyte
Potentiostat
’O’ ring
Reference Counter electrode Working electrode
Working sense electrode
Half cell Half cell
Figure 1.6: Measuring arrangement of an in vitro dentin recording experiment. Split chamber was arranged in order to perform electrochemical impedance spectroscopy on dentin- resin bonding surfaces [113]
in vitro dentin recording experiments are required. The precise determination of the electrical impedance of the dentin makes the definition of an accurate threshold voltage and current for electrical stimulation possible, but there are some difficul- ties [115]. The temperature of the tooth not only influences the functional properties of the tooth pulp neurons [116] but also affects the impedance of the dentin [117].
This electrical parameter also depends on the concentration of the used electrolyte (saline solution of sodium chloride) [118,119] and on the age of the tooth as well [120].
The applied measuring signal has to be AC because in case of a DC signal, polar- ization artefacts arise on the electrode-tooth contact area [121–123]. The exact de- termination of dentin impedance can reveal other parameters and can be a basis of various diagnostic methods [124]. For example, dental caries are caused by the dem- ineralization of the dentin. This process changes both the tubules diameters and the dentin impedance [125]. Most experimental caries diagnostics methods are based on impedance measurement [125–127]. These methods have proven to be more success- ful than former techniques [128–131]. Measuring the impedance between an inserted electrode in a root canal of a human tooth and an outer electrode placed on the oral mucosa makes the calculation of the root canal length possible [132, 133]. Further- more, impedance measurements can be used for defining the dentin permeability or forming the basis of the investigation of an alternative bioimpedance spectroscopy
method for the assessment of tooth structures [134]. In the last few years new meth- ods have been developed and applied in oral sciences such as two-photon and multi- photon microscopy which were used successfully in caries diagnostics [135, 136], and γ-radiation, which can change the mechanical and electrical properties of the dentin and the enamel [137]. Impedance measurement has a prominent relevance in the definition of the electrical properties of the dentin and it can be the basis of further oral diagnostic methods that might be used in clinical practice.
Chapter 2
Specific aims
2.1 Simultaneous electrophysiological recording and two- photon imaging in vitro
Simultaneous utilization of implanted MEAs for extracellular electrophysiology and two-photon microscopy for optical imaging could allow the observation of activities of individual neurons with good spatial and temporal resolution, but the imaging laser generates artefacts in the electrophysiological recordings. Special noise filtering al- gorithm development is required to analyse the data which were recorded in the field of view of the two-photon microscope. Our aim was to performin vitro experiments on mouse neocortical slices expressing the GCaMP6 genetically encoded calcium indicator for monitoring the neural activity with two-photon microscopy around the implanted MEAs. An objective of mine was to develop a complex custom-set comb filter based algorithm which could be used for noise filtering to eliminate the artefacts caused by the imaging laser. Besides the two-photon observation of the morphology near the implanted MEA, the scope of our research was to prove that this special filtering algorithm allows the detection and the sorting of SUAs from a simultaneous two-photon imaging and extracellular electrophysiological measurement.
2.2 Simultaneous electrophysiological recording and two- photon imaging in vivo
Having realized the special filtering algorithm for SUA detection from simultane- ous two-photon imaging and extracellular electrophysiological recordings in vitro, our aim was to extend our investigation onto in vivo experiments. To reach this goal, the scope of ours was to apply a MEMS technology based MEA which would
be designed and developed in order to perform simultaneous electrophysiological recording and two-photon imaging from the same tissue region of mice brains ex- pressing GCaMP6 genetically encoded calcium indicator. Our aim was to implant the MEA within the field of view of the two-photon imaging and perform simul- taneous recordings. The previously developed algorithm was planned to improved and utilized on the recorded extracellular data to detect SUAs. The objective was to prove that combining the self-developed MEMS technology based MEA with my filtering and analyzing algorithm was capable of performing electrophysiological recording and two-photon imaging from the same tissue region at the same time.
2.3 Determination of the thickness dependent electrical impedance spectrum of the human dentin
Utilization of impedance measurement methods in dental researches makes the de- termination of electrical properties of human tooth possible. Although impedance measurement forms the basis of numerous oral diagnostic methods, only a limited number of studies are available focusing on the impedance of human dentin. The main goal of our experiments was to determine the thickness dependency of the impedance of the human dentin. Our model allowed the determination of a co- efficient which describes the correlation between the thickness and the electrical impedance of the human dentin.
Chapter 3
Materials and Methods
3.1 Materials and methods related to the simultaneous elec- trophysiological recording and two-photon imaging 3.1.1 Preparation of physiological experiments
In vitro and in vivo experiments were performed on neural tissue of mice express- ing the GCaMP6 genetically encoded calcium indicator for the monitoring of neu- ral activity around the MEA [138, 139]. A total of five GCaMP6 mice had been anesthetized with a ketamine-xylazine solution and prepared for operation. Initial anesthesia was performed via intraperitoneal injection of a mixture of 37.5 mg/ml ketamine and 5mg/mlxylazine at 0.1ml/100gbody weight injection volume, body temperature was maintained at 37 °C throughout the experiments. If it was neces- sary, 0.05 ml of the same mixture was dosed repeatedly during the experiments.
Animals for acute tests were kept and handled in accordance with the European Council Directive of 24 November 1986 (86/609/EEC), the Hungarian Animal Act, 1998 and the Animal Care Regulations of the Research Centre for Natural Sciences of the Hungarian Academy of Sciences (RCNS-HAS). The study was approved by the Institutional Animal Care and Use Committee of the Research Centre for Natu- ral Sciences of the Hungarian Academy of Sciences (members: Dr. Istv´an Ulbert, Dr.
J´ozsef Top´al and P´eter Kottra) and the National Food Chain Safety Office of Hun- gary (PEI/001/695-9/2015). Animals had unlimited access to food and water, when they were awake. Each mouse was kept in a 39 cm long, 22 cm wide, 18 cm high cage. They were under deep anesthesia during surgery (and during the recording sessions in case ofin vivo measurements) as well as at the time of sacrifice. During anesthesia, paraffin oil was administered to their eyes to prevent them from drying.
Efforts were made to minimize animal suffering and to reduce the number of animals
used. They were sacrificed by the injection of a lethal dose of ketamine/xylazine into the heart.
In vitro experiments
Cortical and hippocampal slices were prepared from three of the mice brains. The brains were immediately removed and dipped into cold (2 − 3 °C), oxygenated (95% O2,5% CO2) cutting solution. The cutting solution contained the following composition (in mM): 250 Sucrose, 26 NaHCO3, 10 D-Glucose, 1 KCl, 1 CaCl2 and 10 MgCl2. 500 µmthick horizontal slices were cut by a vibratome (VT1200s; Leica, Nussloch, Germany) from both hemispheres. Slices were kept in a standard artificial cerebrospinal fluid (aCSF) solution at room temperature (20−22 °C) for at least one hour before use. The recordings were performed at 32−34 °C with a standard recording aCSF containing (in mM): 124 NaCl, 26 NaHCO3, 10 D-Glucose, 4 KCl, 2 CaCl2 and 2 MgCl2. In the recording chamber, a dual-perfusion system was used by perfusing both the top and the bottom surfaces of the slices with relatively high perfusion speed (> 10 ml/min) to provide better oxygenation, similar to in vivo conditions [140].
In vivo experiments
The anesthetized mice were stabilized in a stereotaxic frame (David Kopf Instru- ments, Los Angeles, USA) so as to make their skull fixed during the experiments.
Craniotomy was performed from−1.0mmto−5.0mmanteroposterior (AP), from 1.0 mm to 4.0mm mediolateral (ML) in reference to the Bregma of two GCaMP6 mice. In case of perpendicular implantation the silicon based MEA is proved to be rigid enough to penetrate into the dura mater, but during our experiments the shanks of the self developed MEA included an angle of 20 degree relative to the surface of the brain, thus in order to achieve a smooth implantation by avoiding possible buckling of the probe, the dura mater was incised above the target loca- tion. The target area was located typically in the middle of the CW, depending on the topology of the veins on the surface of the exposed brain. With the applied MEA and the angle we were able to reach the somatosensory cortex of the brain, which was suitable for the two-photon imaging too.
3.1.2 Two-photon imaging
The three dimensional observation of morphology was performed with two- photon microscope (Femtonics Ltd., Budapest, Hungary) with the application of an XLUMPLFLN20XW fluid immersed objective (Olympus Corporation, Tokyo, Japan). The working distance of the objective was 2 mm with the magnification capacity of 20. The two-photon imaging not only let us monitor the neural ac- tivity near the applied MEA because of the genetically encoded calcium indicator expressing GCaMP6 cells, but it also made the observation of imaging laser gen- erated artefacts possible. The applied laser was a Chameleon-Ultra II (Coherent Inc., California, USA) high-intensity modelocked Ti:Sapphire laser with the avail- able wavelength tuning range of 680 to 1080 nm. During the experiments the best wavelength for the neural imaging was found to be 920 nm. The setup was not only able to function in two-photon resonant mode but it also did work in camera mode which allowed us to follow the track of the inserted MEA before and during the insertion because of the built-in charge-coupled device (CCD) camera. With the adequate brain region in the field of view of the two-photon imaging, the bio- electrical activity was monitored in two-photon mode and the electrophysiological measurement setup was assembled.
In vitro experiments
For the optical imaging the prepared slices were placed into anin vitro measurement chamber. The chamber ensured the aCSF supplement and circulation for keeping the neural tissue alive until the end of the measurement and it stabilized the slice mechanically with a holder mesh. The top part of the chamber is concave-shaped to hold the aCSF for the liquid immersion objective of the two-photon microscope which was used during the experiments. The schematic of the in vitro assembled experiments is shown in Figure 3.1.
In vivo experiments
During thein vivo experiments, the mice were held in the stereotaxic frame to keep the examined neural tissue motionless, which is required for the optical imaging.
The stereotaxic frame was placed into an in vivo measurement chamber. The mice had been anesthetized for the time of the two-photon imaging and the electrophysi- ological recording. The available space for the MEA implantation was more limited under the field of view of the two-photon microscope than in the the in vitro case
as it is shown in Figure 3.2 thus a special designed MEA was required to use for the electrophysiological recordings.
3.1.3 Electrophysiological measurement
The electrophysiological observation of the bioelectrical activity of the examined brain slices and the somatosensory cortex of the living mice were carried out using an Intan RHD 2000 amplifier system (Intan Technologies, Los Angeles, USA) connected to a computer via USB 2.0 with a sampling frequency of 20 kHz. The reference electrode was an Ag/AgCl needle, which was located beneath the tested neural tissue in case of thein vitro experiments. During thein vivo recordings the reference electrode was inserted under the scalp of the mouse.
In vitro experiments
In case of the in vitro electrophysiological recordings a silicon based MEA with 16 shanks (A16x1-2mm-50-177-A16, NeuroNexus, Ann Arbor, MI. USA) was applied as the working electrode. Every shank contained one electrode site at the tip of the
printed circuit board 500 μm thick horizontal brain slice
circulated artificial cerebrospinal fluid (aCSF)
implanted MEA objective of the two-photon microscope
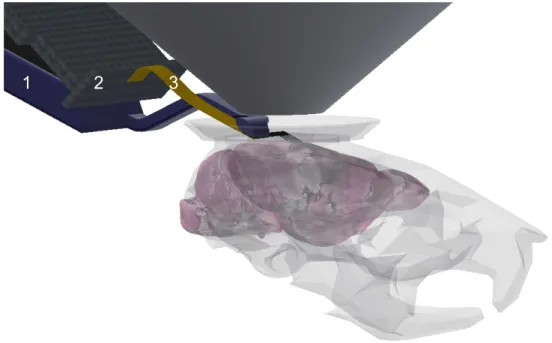
1 2 3
Figure 3.2: The 3D designed model of the available implantation space during the in vivo mea- surements. A real size mouse skull model (1) was used to observe the required and suitable concave-shaped part (2) for the immersion fluid above the CW and under the objective (3) of the two-photon microscope
shank for the extracellular recording after the implantation into the brain slice. The geometrical design of the MEA such as the thickness and the length of the shanks or the electrical connectors of the MEA allowed us the insertion into the tissue under the objective of the two-photon microscope [141].
In vivo experiments
Because of the limited implantation space, a special MEA was developed for the in vivo simultaneous two-photon imaging and extracellular recording. The MEA is a four-shank (8 channels/shank) silicon based probe assembled with Omnetics electrical connector (Omnetics Connector Corporation, Minneapolis, USA) which small enough to be suitable for further chronicin vivo applications too. Between the connector and the silicon part there is a flexible polymer cable which allowed us to implant the probe with a self-designed 3D printed electrode holder. The flexible cable allow the connector to be stabilized somewhere next to the cranial window to the skull without obstructing the two-photon imaging. This is a necessary requirements for further chronic experiments. The stereomicroscopic image of the applied MEA with the flexible polymer cable and the Omnetics connector is shown in Figure 3.3, the schematic of the electrode holder with the flexible cable conducted MEA during implantation is shown in Figure 3.4.
In both cases the MEAs were inserted with the automated electrode holder of the two-photon setup in such a manner that the longitudinal axes of the shanks included
A B
2 mm 5 mm
Figure 3.3: Stereomicroscopic image of the MEA designed for in vivorecordings during the two- photon imaging. The Omnetics connector (A) and the four-shank silicon probe (B) are connected with a flexible cable
1 2 3
Figure 3.4: Schematic of the assembled in vivo measurement system. The 3D printed electrode holder (1) stabilized the Omnetics connector (2) and the MEA at the end of the flexible cable (3)
an angle of 20 degree relative to the surface of the brain slice. In case of the in vitro MEA, the printed circuit board of the probe was stabilized to the automated electrode holder while during thein vivorecordings between the automated electrode holder and the MEA there was a need to apply a 3D printed electrode holder. That holder was designed to be curved to fit in the limited implantation space, and it was glued to the MEA at the connection part of the flexible cable and the silicon
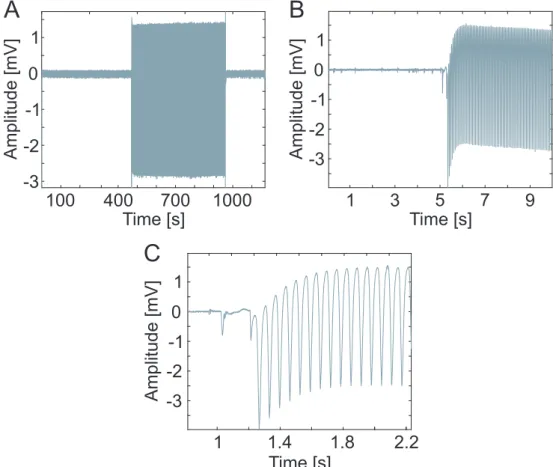
electrophysiological measurement was started without the laser imaging in order to provide reference recordings. After 8 minutes of such laser-free recordings, the two- photon imaging was initiated and the imaging laser introduced artefacts. Another 8 minutes of laser-noised recordings were hence obtained. The third part of each measurement was performed without the two-photon imaging again, in order to obtain further control data sessions, this time after the laser effect. During the second part of the measurements, the two-photon imaging laser generated artefacts appeared which exceeded the amplitude of SUAs by at least an order of magnitude as shown in Fig 3.5.
1 0 -1 -2 -3
400
Time [s]
Amplitude [mV]
1 3 5
Time [s]
7 9
A B
100 700 1000
1 0 -1 -2 Amplitude [mV] -3
1
Time [s]
2.2
C
1.4 1.8 1
0 -1 -2 Amplitude [mV] -3
Figure 3.5: Representative sample of the imaging laser impact on the electrophysiological record- ings. Between the first and the last parts of the measurement, which were recorded without two-photon imaging, photoelectric artefacts of the two-photon imaging laser are observable (A). The recorded data at the moment when the imaging laser was switched on (B, C)
3.1.4 Data analysis
MATLAB 2017a (MathWorks Inc., Natick, MA, USA) was used for off-line signal visualization, filtering and analysis. Figure 3.6 summarizes the steps that had been performed in order to accomplish the identification of spike clusters in the data containing two-photon laser noise.
Apply comb filter (on both recordings,
so spike shapes are distorted equally)
Spike detection and sorting
features of spike clusters check spike consistency Laser noise free
300-3000 Hz data
Laser noise free comb filtered data
Laser noise free raw data
Laser noisy comb filtered data
Laser noisy 300-3000 Hz data Laser noisy raw data
300-3000 Hz band pass filter
Comb filter parameters
Figure 3.6: Filtering and analyzing steps. The performed filtering and analyzing steps in order to identify the spike clusters and check the spike consistency between the two-photon imaging laser noise free and the laser noisy data. The green arrow indicate the place of the parameter setting algorithm which is presented in Figure 3.7
All of the applied band-stop infinite impulse response (IIR) filters were created with passband ripples of 0.4. Since the IIR filters delay some frequency components more the others, they distort the input signals with frequency dependent phase shift. Thus they were applied with the ‘filtfilt’ Matlab function that compensated the delays introduced by such filters, and thus corrected for filter distortion. The recorded signals were initially filtered with a second order band-pass filter between 300 Hz and 3000 Hz, which is a commonly used method for highlighting and de- tecting SUAs [142], but not adequate for eliminating the photoelectric artefacts.
Following this, Fast Fourier transform (FFT) was applied on the electrophysiologi- cal recordings. Comparing the frequency spectra of the first (laser off) part of each measurement to their second part (laser on), it was evident that the imaging laser gave rise to a population of high peaks in the frequency domain. These peaks were located periodically, with a distance of 15.5Hz between the neighboring ones. This
The construction process of the laser noise reduction filters is shown in Figure 3.7.
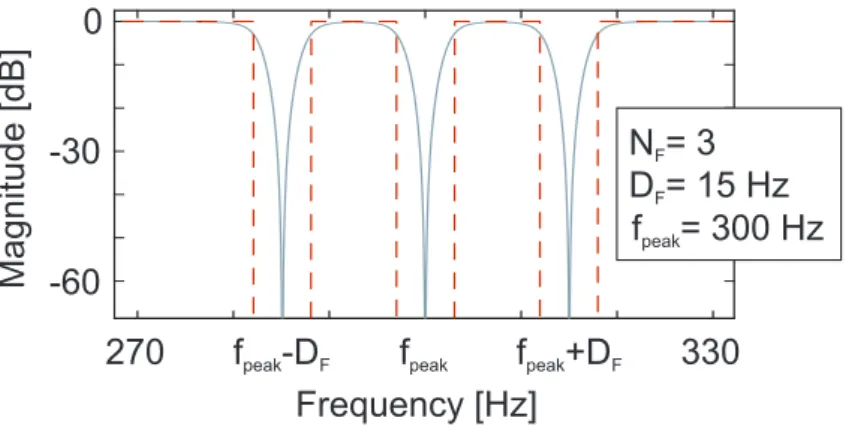
Such a comb filter had to be constructed individually for every recording channel because of the different laser noise characteristics on the channels. Each custom-set comb filter was built from filter modules, a representative filter module is shown in Figure 3.8. The modules contain band-stop filters fitted to a certain amount of peaks in the frequency domain.
Laser noise amplitude too high?
(time domain analysis)
Generate new comb filter module (with freq. domain analysis)
Extend temporary comb filter parameters
with the new module Apply comb filter
with temporary parameters
Laser noisy 300-3000 Hz data
Finalize
comb filter parameters START
Temporary laser noisy comb filtered
data
Temporary comb filter parameters
Data Processes NO
YES
Figure 3.7: The parameter setting algorithm of the applied custom-set comb filter. The applied parameters are the number of filter modules (NM), the center frequencies of filter modules (fpeak), the number of filters within each module (NF) and the distance between filters within each module (DF)
Frequency [Hz]
Magnitude [dB]
fpeak 330
270 0
-30
-60
fpeak+DF
fpeak-DF
N = 3F
D = 15 HzF
fpeak= 300 Hz
Figure 3.8: The result of the parameter setting of a representative filter module ifNM = 1
0 1 2 3 4 5 6 0
Frequency [kHz]
10 20 30
3400 4200 5000
Frequency [Hz]
200 600 1000
Frequency [Hz] Frequency [Hz]
A B
C B C
D D
260 300 340
|FFT(data(t))| [μV]
0 10 20 30
|FFT(data(t))| [μV]
0 10 20 30
|FFT(data(t))| [μV]
0 1 2 3
|FFT(data(t))| [μV]
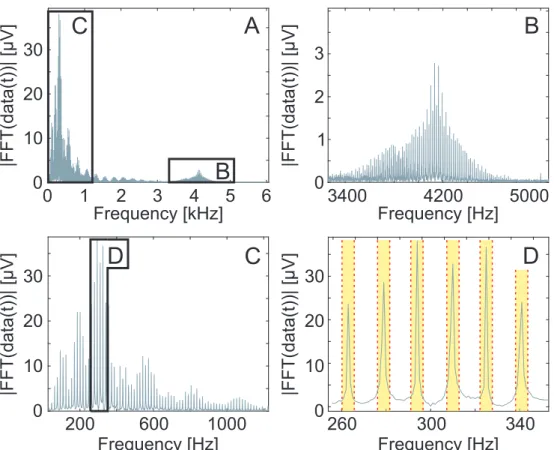
Figure 3.9: The absolute value of the frequency spectrum of the electrophysiological recordings.
The fast Fourier transform analysis of the imaging laser generated noise in the electrophysiological recorded data (A). Harmonics below 1200 Hz (C) and at higher frequencies (B) of the laser generated periodical artefacts appeared with high mag- nitudes. The overlap of the harmonics is observable (B). A part of the rejected frequencies by the custom-set comb filter is shown in yellow (D)
The parameter setting algorithm of the comb filter is shown in Figure 3.7. These parameters were the number of filter modules (NM), a vector containing the center frequencies of the filter modules (fpeak), the numbers of the applied band-stop filters within each module (NF) and the distances between the center frequencies of the applied band-stop filters within each module (DF). The parameter setting algorithm utilized the 300−3000 Hz filtered laser noisy data in a cyclic manner, during each cycle, a new filter module is added to the comb filter. The first step in the cycle was the generation of a temporary laser noise filtered data by the application of the temporary comb filter, i.e. the comb filter generated in the previous cycle on the 300−3000 Hz filtered laser noisy data (in the first cycle the number of filter modules is 0, so this step left the data unchanged). The second step was deciding whether the temporary filter was sufficient. This was performed by time domain
on the frequency domain analysis of the temporary laser noisy comb filtered data (which is equivalent to the 300−3000Hz filtered laser noisy data in the first step).
After applying the FFT on this data, the algorithm found the highest peak in the frequency domain. This frequency became the center frequency (fpeak) of the new filter module. The neighboring peaks were located at the frequencies offpeakk±nDF (DF was found to be 15.5Hz). The values at the neighboring peaks were compared to the highest detected peak to define the number of the applied filters (NF) within the new module. NF of the filter module was defined so that the band-stop filters of the comb filter would cover all the neighboring peaks which exceeded in height the 15% of the highest peak (i.e. the one at the center frequency). Every band-stop filter element of the new comb filter module was defined with cutoff frequencies at below 3 Hz and above 3 Hz from the frequency value of each peak. Thus the central rejected frequencies of the comb filter were adjusted to the frequencies of the laser noise peaks and each section of the comb filter had a 6 Hz wide rejected band, as shown in Figure 3.8 and in Figure 3.9.D. The temporary comb filter was extended with the thus obtained new module and the cycle restarted. This process was repeated until the time domain analysis gave positive result, i.e. the amplitude of the laser noise peaks in the time domain became lower than 40µV, in which case the summarized comb filter parameters were accepted. The thus constructed comb filters were applied on both the laser noise free and the laser noisy 300−3000 Hz filtered data in order to equally distort the SUA (i.e. spike) waveforms in both cases. Later on, this allowed us to match the features of different spike clusters in the laser free and laser noisy measurements. Since the imaging laser generated artefacts were nonuniform along the electrodes, recordings from different electrodes required filters with custom-set parameters. We investigated whether the comb filter prevents us from SUA detection and sorting. Spike detection was performed by simple thresholding. Three features of each potential spikes were defined for spike sorting, which were the location of the minimum amplitude value of the spike, and the values at 250 µs(i.e. five datapoints at 20 kHz sampling frequency) before and after the peaks as shown in Figure 3.10.
The clusters were manually accepted or discarded based on spike waveforms and autocorrelograms. This feature extraction method was preferred rather than the most commonly used method for spike sorting, the principal component analysis (PCA) [143], because the thus defined features could provide more robust informa- tion about spike waveform consistency (spike stability). In terms of the laser noise free part of the experiments, I performed a comparison of the feature-based and the PCA methods on the band-pass filtered data to verify the results of the feature extraction based method which was used for testing the spike stability too. Having
30 20 10 0 -10 -20 -30 -40 -50 -60 -70
Datapoint
Amplitude [μV]
-30 -20 -10 0 10 20 30
Figure 3.10: The applied principal component selection. Each potential spike was defined with their three principal component before spike sorting: the location of the minimum amplitude value of the spike, and the fifth datapoints before and after the peak
applied the commonly used 300−3000 Hz band-pass filter on the laser noise free data, spike sorting was performed based on PCA then the results of the PCA based and the feature extraction based sorting process were compared. I have performed a comparison on the sorted spike waveforms and on the interspike intervals too.
Interspike interval validation is a commonly used method for checking the quality of MEA performance over a longer period of time [143].
The spike stability was verified as follows. First, the averages and the standard errors of the means of each feature were calculated in every minute of the recordings. These values were compared to each other during the whole measurement to verify the impact of the imaging laser and the applied filters to the shape of the thus sorted spikes. Furthermore, the number of spikes were counted in every minute of the recordings for each clusters. This method showed whether the artefacts caused by the imaging laser gave rise to false positive SUA detections. Another examination of the possible false positive SUA detection was the comparison of the detected spike waveforms and an autocorrelogram belonging to a specific SUA during the laser noisy and the laser noise free recording. With the inspection of the waveforms and the autocorrelograms during the laser on and the laser off sections I could check the effect of the imaging laser on the neural cells firing. To be convinced that the
3.2 Materials and methods related to the determination of the thickness dependent electrical impedance spectrum of human dentin
3.2.1 Specimen preparation
Dentin disks were prepared from human wisdom teeth for the in vitro character- ization of the thickness dependent impedance of human dentin. Five teeth were removed without damage in the Semmelweis University, Department in Community Dentistry. The collection and application of the specimens happened anonymously in accordance with the research ethical approval made by the Semmelweis Univer- sity Regional Scientific and Research Ethics Committee with the permission note of 246/2017. The protocol of specimen preparation was the following. The roots were stabilized in dental gypsum and with a suitable saw (Hofer, Aathal - Seegr¨aben, Switzerland) from 1 mm to 2.3 mm thick dentin disks were cut from the occlusal surface of the crown between the pulp and the enamel. The thickness of a prepared disk was depending on the extension of the intact volume of the examined tooth.
The surfaces of the prepared disks were cleaned with 35% phosphoric acid for 20 sec- onds long to open the dentinal tubules from smear layer. The specimens were stored in 0.154 mol/L sodium chloride solution. A representative sample of the prepared dentin disks is shown in Figure 3.11 subfigure A.
A B
5 mm 30 mm
Figure 3.11: A representative sample of the prepared dentin disks with four test areas after the drilling processes (A) and during the impedance measurement in the Petri dish with the reference electrode next to the dentin disk holder (B)
3.2.2 Thickness measurements
Prior to realizing thickness measurements, 3−4 separated test areas had been spec- ified on the surface of each dentin disk. The number of the specified areas depended on the size of the intact area of the examined dentin disks. A layer thickness measure- ment apparatus was applied on the middle of the defined test areas. The accuracy of the thickness measurement method is critical for proper calculation of the thick- ness dependency of the impedance, thus a stereotaxic frame with 10 µmresolution (David Kopf Instruments, Los Angeles, USA) was used for this purpose. A needle was fastened to the electrode holder of the stereotaxic frame. Using a microscope, the reference thickness value was defined where the needle point reached the surface of the frame. The examined dentin disk was placed under the lifted needle to measure the thickness of each test area. Following this, the thickness values of the test areas were calculated by subtracting the reference values from the thickness values which were measured on the top of the test areas. The thickness measurement method was utilized before every impedance measurement to specify the correlation between the thickness and the impedance of the dentin.
3.2.3 Impedance measurement system
An Intan RHD 2000 amplifier system (Intan Technologies, Los Angeles, USA) was used for impedance measurements. The system contained an Intan RHD 2000 USB interface board with a 16-channel amplifier board. The amplifier board was con- nected to the interface board via an SPI interface cable, the interface board was con- nected to a computer via USB 2.0. One of the sixteen channels was used to measure the impedance between the reference electrode and the working electrode. During the experiments the reference electrode was an Ag/AgCl electrode and the working electrode was an 80% Pt−20% Ir 40.46 µm thick micro wire (California FineWire Company, California, USA). The experiments were performed in 0.154 mol/LNaCl solution. The examined dentin disk was placed in a holder in a Petri dish filled with the said NaCl solution. The holder allowed the solution to flow under the specimen and through the dental tubules. The reference electrode was inserted in the solu- tion near the specimen while the working electrode was built into a silicone tube.
The inner diameter of the applied tube was 1 mm so the measured dentin surface
measurement. The thus assembled measurement system is shown in Figure 3.11 subfigure B and the schematic of the assembled system is presented in Figure 3.12.
V
I
0.154 mol/L Sodium Chloride solution Dentin Enamel Ag/AgCl reference electrode
Silicone rubber Working electrode
Figure 3.12: The schematic of the assembled impedance measurement system. The electric cir- cuit between the working electrode and the reference electrode can only be closed through the dentin tubules because of the insulator silicones
3.2.4 Impedance measurement
The insulation of the silicone tube was verified before the impedance measurements of the test areas. The filled tube with the working electrode in it was gently pressed to the bottom of the Petri dish. The reference electrode was next to the tube as we described it earlier. The impedance measurement system has shown that there was no electrical connection between the two electrodes so the insulation of the silicone tube was suitable for the further recordings. Prior to measuring the impedance of the dentin disks it was necessary to define the impedance of the working electrode and the transfer fluid to calibrate the measurement system. The thus defined electrode impedance was subtracted from the impedance values measured on test areas to get the impedance of the examined dentin. After every thickness measurement the impedance of each test area was measured at multiple frequencies between 50 Hz and 5000 Hz and the coherent thickness-impedance values got recorded according to the frequency. As the next step of the measurement process, test areas of dentin disks were thinned with low speed dental drill. After thinning the same cleaning method was performed with phosphoric acid which was utilized after cutting dentin disks. The cleaning was followed by thickness measurement and the specimens were immersed to the NaCl solution to refill the dental tubules with saline. As it was done, the impedances of thicker test areas were measured and the new thickness-
impedance values got recorded. The whole measurement process was repeated until the dentin disks were reduced to a thickness of 0.3mm.
3.2.5 Data analysis
The first step of the data analysis was to compare the corresponding thickness and impedance values. Following that, focus groups were organized based on the measured thickness to observe the impedance of thickness ranges. Group intervals were defined with consideration of the importance of the remaining dentin thickness in clinical practice. The thus defined focus groups and their quantity of samples are shown in Table 3.1.
Group No. Max thickness Min thickness Quantity of samples
6 2.28 mm 1.25 mm 13
5 1.24 mm 0.95 mm 14
4 0.94 mm 0.75 mm 9
3 0.74 mm 0.60 mm 13
2 0.59 mm 0.45 mm 11
1 0.44 mm 0.30 mm 11
Table 3.1: Quantities and ranges of focus groups of the recorded thickness-impedance pairs for data analysis
For statistical analyzing IBM SPSS Statistics 24 (IBM Corporation, New York, USA) software was used. The focus groups were observed by Kruskal - Wallis test onp= 0.002 significance level, and by using LSD as a post hoc test.
Chapter 4
Results and Discussion
4.1 Results concerning the simultaneous electrophysiologi- cal recording and two-photon imaging
As detailed in section 1.2.1, simultaneous two-photon imaging and electrophysiolog- ical measurements with MEMS technology based microelectrode arrays at the same location is compromised by the formation of photoelectric artefacts in the elec- trophysiological signals. Regarding our experiments when electrodes were located within the field of view of the two-photon microscope, the imaging laser was able to create such artefacts with amplitudes of typically 50 times greater than the ampli- tude of the largest SUAs. Moreover, the complicated spectrum of the photoelectric noise prevents the filtering of the artefact with the application of simple filters. Our following results suggest that the utilization of a comb filter based algorithm can enable researchers to detect and sort SUAs even if the tissue surrounding the MEA is observed with two-photon microscopy.
Since the filtering and analyzing steps of the custom-set comb filter based algorithms were based on the same ideas in case of thein vitro and in the in vivo experiments, the results of the self-developed filtering and analyzing algorithm for simultaneous experiments of electrophysiology and two-photon imaging are going to be presented just in case of thein vitroexperiments in detail. Representative results of the filtering and analyzing process from the in vivo recordings during two-photon imaging will be presented afterwards then the discussion on the results will be reviewed at once in case of the in vitro and thein vivo experiments.
4.1.1 Results concerning the simultaneous in vitro experi- ments
Figure 4.1 illustrates the observed area in case of the in vitro experiments and suggests that the above described two-photon microscope setup and settings were suitable for detecting activities of neuron somas and dendrites via calcium imaging.
The green charts above the highlighted squares show the calcium imaging intensity during a session of two-photon imaging, where the peaks indicate the bioelectrical activity of the GCaMP6 neural tissue.
100 μm
2 1
3
4
30 s 500
1 dF/F
30 s 400
2 dF/F
30 s 500
3 dF/F 30 s
400
4 dF/F
Figure 4.1: Two-photon calcium imaging. The imaging reveals activities of neuron somas (sub- figures 1, 3, 4) and dendrites (subfigure 2) in the vicinity of the microelectrode array
The filters influenced frequency spectrum of the electrophysiological recordings is shown in Figure 4.2, where subfigure A shows the absolute value of the frequency spectrum of the unfiltered signal, subfigure B shows the absolute value of the fre- quency spectrum of the band-pass filtered signal while subfigure C shows the ab- solute value of the frequency spectrum of the band-pass and noise filtered signal.
Comparing the subfigures, it can be observed that after both of the filtering processes the frequency component of the noise became two orders of magnitude lower.
Figure 4.3 shows neural signal samples obtained from an electrode illuminated with direct laser light before (gray) and after (orange) the application of the complex comb filter based filtering algorithm. It is evident that small amplitude spike-like artefacts are still present on the filtered signal and these spike-like artefacts are
0 1 2 3 4 5 0
1 2 3
105
Frequency [kHz]
103
6 4 2 0
A B
|FFT(data(t))| [μV]
|FFT(data(t))| [μV]
0 1 2 3 4 5
Frequency [kHz]
0 2 4 6 8
C
101|FFT(data(t))| [μV]
0 1 2 3 4 5
Frequency [kHz]
Figure 4.2: The filters influenced frequency spectrum of the electrophysiological recordings. Sub- figure A shows the absolute value of the frequency spectrum of the unfiltered signal, subfigure B shows the absolute value of the frequency spectrum of the band-pass fil- tered signal and subfigure C shows the absolute value of the frequency spectrum of the band-pass and noise filtered signal
single unit activity detection. Moreover, with further developments, the artefact spikes can probably be eliminated with an algorithm which takes into account the synchrony of the artefacts and the laser noise. A limitation of this proposed method is that when a single unit activity coincides with a spike artefact, it is probably also eliminated. However, comparing the width and the density of the laser generated artefacts in time range, this limitation should only affect approximately 8.5% of the signal.
Figure 4.4 shows one of the tissue region observed with two-photon microscopy, con- taining the recording electrode sites. The Figure 4.4 shows the recording position from where the representative detected and sorted SUA, which will be presented in the following, was recorded. The result of the feature extraction for this represen- tative case is shown in Figure 4.5, where the potential spikes are shown in black if they were detected during the laser off condition, and red if they were detected during the laser on condition.
1 0 -1 -2 -3
Amplitude [mV]
A
100 400 700 1000
Time [s] Time [s]
1 0 -1 -2 Amplitude [mV] -3
B
1 2 4
Time [s]
3 0.4
-0.2 -0.4 0
Amplitude [mV]
C
0.2 40
-40 -80 0
Amplitude [μV]
D
-120 1 2
Time [s]
2.5 1.5
1 3 5 7 9
Figure 4.3: Representative sample of the results of the applied filtering algorithm. The subfigures show the same data as Figure 3.5 does, prior to filtering (gray) and after applying the filtering algorithm (orange)
100 μm 50 μm
Figure 4.4: Two-photon image from the simultaneous electrophysiological recording and two- photon imaging with the applied MEA inserted into the neural tissue in the field of view of the two-photon microscope
The obtained spike waveforms and their average are presented in Figure 4.6 subfigure
5th before Peak [μV]
-100 -50 0 50
5th after Peak [μV]
-60 -40 -20 0 20
5th before Peak [μV]
-100 -50 0 50
Peak [μV]
-100 -60 -20 20
Figure 4.5: Potential spikes were sorted using three features obtained from the comb-filtered sig- nals. Every dot shows a feature of a detected potential spike. The black dots belong to spikes from the laser off part, the red dots belong to spikes from the laser on part of the presented experiment
0 10 20 -10
-20
Time [ms]
0 100 200 400 300
Counts/bin
3 4
2 1 0
Time [ms]
-120 -60 0
Amplitude [μV]
A
60B
Figure 4.6: The obtained spike waveforms (A) and their average (black line) and the autocor- relogram of the thus sorted spike (B)
obtained spike waveforms. The averaged feature components within the measuring minutes is shown in Figure 4.7 subfigure A. The slight decrease of the amplitude feature (shown in orange) could be caused by the nature of the long term exper- iments of brain slices. The number of the detected spikes within every minute of the measurement is shown in Figure 4.7, subfigure B. The result of the subfigure probably did not indicate false positive SUA detection, it rather suggested that the imaging laser may had effect on the neural cells firing rates. To verify this state- ment, I observed the differences between the laser on and the laser off conditions from multiple angles.
The differences between the first laser off and the laser on conditions are observed in terms of the spike waveforms and their averages in Figure 4.8, where the subfigure A presents the first laser off condition, the subfigure B presents the laser on condition and subfigure C presents the differences in the averages of the observed waveforms.
The slight decrease in the amplitude of the sorted SUA can be observed during the laser on condition as it was shown in Figure 4.7 subfigure A, but the sorted

![Figure 1.6: Measuring arrangement of an in vitro dentin recording experiment. Split chamber was arranged in order to perform electrochemical impedance spectroscopy on dentin-resin bonding surfaces [113]](https://thumb-eu.123doks.com/thumbv2/9dokorg/515200.215/19.892.267.676.118.532/measuring-arrangement-recording-experiment-arranged-electrochemical-impedance-spectroscopy.webp)