O R I G I N A L A R T I C L E
Modeling of light scattering and haze in semicrystalline polymers
János Molnár
1| Örs Sepsi
2| Gábor Erdei
2| Sándor Lenk
2| Ferenc Ujhelyi
2| Alfréd Menyhárd
11Department of Physical Chemistry and Materials Science, Laboratory of Plastics and Rubber Technology, Budapest University of Technology and Economics, Budapest, Hungary
2Department of Atomic Physics, Budapest University of Technology and Economics, Budapest, Hungary
Correspondence
János Molnár, Department of Physical Chemistry and Materials Science, Laboratory of Plastics and Rubber Technology, Budapest University of Technology and Economics, Műegyetem rkp. 3. H. ép. I, Budapest H-1111, Hungary.
Email: molnar.janos@mail.bme.hu
Funding information
National Research, Development and Innovation Fund, Grant/Award Number:
TUDFO/51757/2019-ITM; Hungarian Academy of Sciences; New National Excellence Program, Grant/Award Number: ÚNKP-19-4-BME-419
Abstract
This article reports a new model approach for the description of light scatter- ing in semicrystalline polymers, to describe more precisely the influence of supermolecular structure on the optical properties. This is the first study in which light scattering of polymer films has been modeled using exact Mie scat- tering theory of radially anisotropic spheres. As a model material a well-known polymer, isotactic polypropylene (iPP) was used. Samples were prepared with different sample thicknesses and crystalline structures in order to identify the key parameters of light scattering in polycrystalline polymeric systems. Valida- tion haze measurements were carried out with a spectrophotometer equipped with a 150 mm snap-in integrating sphere. It was found that the optical prop- erties of the polycrystalline sample can be described using multiple light scat- tering on these scattering centers. Good agreement was found between the simulated and experimentally measured haze values which proves the reliabil- ity and applicability of our new approach.
K E Y W O R D S
crystalline structure, haze, model calculations, optical properties, prediction, volume scattering
1
|I N T R O D U C T I O N
In the new global economy, the appearance of product packaging has become a central issue for marketability.
In the area of packaging industry polymers have great importance, hence optical properties, especially haziness and clarity of these materials are crucial.[1,2] Another requirement is that the applied materials should be cheap. Accordingly, commodity polymers like polyolefins are popular in this area. These polymers are semicrystal- line materials and since the crystalline phase scatters the light considerably, their optical properties (haze and
clarity) are moderated which suppresses the usage of these polymers.
It is known that the light scattering behavior is deter- mined by the complex crystalline structure of the poly- meric materials, and the use of special nucleating agents improved the optical performance of isotactic polypropyl- ene (iPP).[3–12]
Several questions remain unanswered at present.
Though the clarifying effect and the mechanism of nucle- ation in the presence of clarifiers have been extensively studied, these researches were focused on the structure and the reliable measurement of properties instead of
DOI: 10.1002/pol.20200027
This is an open access article under the terms of the Creative Commons Attribution License, which permits use, distribution and reproduction in any medium, provided the original work is properly cited.
© 2020 The Authors.Journal of Polymer Sciencepublished by Wiley Periodicals LLC.
J Polym Sci.2020;58:1787–1795. wileyonlinelibrary.com/journal/pol 1787
developing a quantitative correlation between haze and the crystalline structure. In our earlier study, it was shown clearly that there is a strong correlation between the haze and the peak temperature of crystallization, however, these empirical correlations were not based on structural parameters.[13]
In case of quiescent crystallization conditions, such semicrystalline polymers are predominantly built up by spherically symmetric supermolecular units called spher- ulites. Spherulites are formed by radially growing folded chain fibrilla or lamella containing amorphous and crys- talline phases simultaneously.[14–16]Four examples of the crystallization stage can be seen on Figure 1a. At the end of the crystallization, a complex semicrystalline medium is formed with spherulites as the macroscopic building blocks. Due to the spherical symmetric growth, the struc- ture of the spherulites corresponds to a uniaxial crystal with locally varying crystal axis. Therefore, the refractive index of the spherulite is anisotropic and has a slightly different value in the radial direction and normal to it (tangential direction).[17]
Since the crystalline structure is complex, all trials which link the properties to the crystalline structure quantitatively are based on a simplification of the struc- ture as well as on empirical correlations. Despite the diffi- culties of these modeling approaches, there is a need for such correlations, because an accurate prediction is essential during smart designing of materials for a
well-defined application field or during the prediction of potential and limitations of semicrystalline materials. In our earlier works, successful attempts were performed in order to correlate tensile modulus to crystallinity and lamellar structure of semicrystalline polymer.[18]
Various theoretical approaches exist in the literature, which can be used to model light scattering. In the case of amorphous polymers and in immiscible polymer blends the refractive index randomly and continuously deviate from its mean values at different locations, thus the light scattering of these systems is usually described statistically.[3,19–30] In the case of crystalline polymers, the refractive index changes abruptly at crystalline boundaries. A range of theories exists for calculating the light scattering distribution using simple particle shapes as scattering elements like spheres or cylinders.[3,31,32]
The less complex, simpler approximations are usually valid only in limited particle size and relative refractive index ranges.[3]For solid plastics, models using isotropic spherical particles are used most generally. If the scatter- ing spheres are very small compared to the wavelength, simple Rayleigh scattering theory is applicable.[3] If the refractive index mismatch is small enough and the scat- tering elements are somewhat larger than the wavelength of light, one can use two other simplified approaches: the Rayleigh-Gans-Debye (RGD) and Anomalous Diffraction theories.[31–33]One of the advantages of the RGD theory approach is that it is not limited to isotropic spheres, thus
F I G U R E 1 (a) POM images of the polycrystalline structure of iPP during crystallization at 135C and different crystallization times (t) and (b) Schematic representation of light scattering in polycrystalline solid. Only the forward scattering is represented by the arrows, the backward scattering is omitted for clarity [Color figure can be viewed at wileyonlinelibrary.com]
it can be used to predict the scattering behavior of any particle structure.[32]
The transparency of semicrystalline polymers is ruled by the optical properties of the spherulitic superstruc- ture.[34] Stein and Rhodes[3,35] have modeled spherulite scattering using the RGD theory with a sphere having dif- ferent radial and tangential refractive indices. A similar approach taking into account the effect of disorders and internal substructure,[36–38] scattering from arrays of spherulites[3,39–41] and approaches for two-dimensional spherulites[3,42] have been also developed. Meeten modeled spherulite scattering using spheres having dif- ferent radial and tangential refractive indices, but instead of using RGD theory he used the anomalous diffraction theory.[33]
In most cases, the assumption of very small particle size (smaller than the wavelength of light) or the small refractive index mismatch is too restrictive. To lift these barriers one can use the Mie theory which gives the exact solution (in the form of an infinite sum) for the light scat- tering of a sphere having any size and refractive index.
One of the drawbacks of using Mie theory is that it can describe the light scattering only on a perfect sphere.[3]
Moreover, the solution comes up as an infinite series which requires a computer to sum up iteratively.
In the current work, iPP was used as model material which is one of the fastest-growing and widely used com- modity polymer in the packaging industry. It has reason- ably good mechanical properties and it is almost the cheapest commodity polymer, but in our case, its main advantage is that its crystalline structure and its proper- ties can be manipulated within a wide range. Though there are amorphous polymers having better optical properties than iPP, all of them are more expensive and usually have higher glass transition temperature (Tg) and brittle behavior.
The specific objective of this study is to reveal all key factors that determine the haziness and to develop a model which describes the optical properties of semicrystalline polymers based on structural parameters. The model was based on exact Mie scattering of radially anisotropic spheres and was compared to experimental results using iPP samples having different structural parameters:
nucleus density, spherulite size, and sample thickness.
The reliability of the model was tested in a wide range of haze, on samples which were also prepared under differ- ent conditions and having different thicknesses.
2
|L I G H T S C A T T E R I N G M O D E L
Our model describes the light propagation in the complex semicrystalline scattering medium in two distinct stages:first, light propagation throughout the scattering medium is considered as the incoherent sum of independent sin- gle scattering events as detailed later in this section. In this description, the spherulite plays the role of the single scattering unit. The collective light scattering behavior is described by spherulites packed randomly into slab geometry with thickness d as shown in Figure 1b. The density of the spherulites is defined by the nucleus den- sity as follows:
n0=N
V ð1Þ
whereVis the total volume of the slab andNis the num- ber of spherulites. From the nucleus density we can cal- culate the average spherulite volume (Vsph) as follows:
Vsph= 1
n0 ð2Þ
Second, these independent scattering events are described as if spherulites would reside in an isotropic and homogeneous background of the surrounding spher- ulites. In our approach the spherulites are represented by radially anisotropic spheres, that is, they are character- ized by radial and a tangential refractive index. The difference between the two components is described with the birefringence of the spherulite (Δn) defined as follows:
Δn=nr−nt ð3Þ
wherenrandntdenotes the radial and tangential refrac- tive index, respectively. We define background refractive index (nbg) as the average of the radial and tangential refractive indices:
nbg=nr+nt
2 ð4Þ
Even if the model does not take precisely the real morphology of the crystalline structure into account, this model captures the basic microscopic description of the spherulitic structure and can be used to approximate the single scattering properties of the spherulite.
The sample is illuminated with an unpolarized light beam at normal incidence with an intensity I0 and a wavelength of λ. For the description of multiple scatter- ing, we follow a very simple model,[43]assuming that the light beam that propagates through a dzthickness of the above-described media is scattered only into the forward or backward direction with intensities I+and I−, respec- tively. Therefore, all scattering into any arbitrary
direction is taken into account by incorporating them into one of the two directions. The forward and backward scattering beam intensities (I+ and I−) are used as inte- grated quantities over the forward and backward hemi- sphere, respectively.
The intensity change of the beams under discussion can be calculated as follows:
dI=−IðαF+αBÞdz ð5Þ
dI+
dz =IαF+ðI−−I+ÞαB ð6Þ
dI−
dz =IαB+ðI+−I−ÞαB ð7Þ
whereIdenotes the intensity of unscattered light andαF
andαBare the forward and backward scattering attenua- tion parameters, respectively. They are calculated by the product of the nucleus density (n0) and the extinction cross section[44]:
αF=n0Cext,F ð8Þ
αB=n0Cext,B ð9Þ
where Cext,F and Cext,B are the integrated forward and backward extinction cross-sections, respectively and are calculated by the use of radially anisotropic Mie scatter- ing.[45,46] Technically, first we calculate the scattering angle-dependent differential extinction cross-section of the radially anisotropic spherical particles, then we cal- culate the forward and backward scattering cross sec- tions by integrating the differential cross-section onto the forward and backward hemisphere. This can be expressed analytically for Mie-scattering as an infinite sum of scattering coefficients[47] and is calculated numerically using a custom written Fortran and Python library.[48]
Finally, the solution of differential Equations (5–7) can be found by imposing appropriate boundary condi- tions on the front and back interface of the slab (I(0) =I0, I−(d) = 0 andI+(0) = 0):
I zð Þ=I0e−zðαF+αBÞ ð10Þ
I+ð Þz =I0 e−2αBd+e−2αBz
e−2αBd+ 1 −e−zðαF+αBÞ
ð11Þ
I−ð Þz =I0
e−2αBd−e−2αBz
e−2αBd+ 1 ð12Þ
We define the haze of the sample as the ratio of the diffusely transmitted intensity and the total transmitted intensity:
H= I+ð Þd
I+ð Þd +I dð Þ ð13Þ
In the developed model we have not taken into account the light scattering on the plastic-air interface and assume it as a smooth surface. In order to compare the model with experiments, we have used index matching oil on the surface of the samples.
3
|E X P E R I M E N T A L 3.1
|Materials
Tipplen H649FH (MOL Petrochemicals, Hungary) iPP homopolymer (melt flow rate = 2.5 g/10 min, 230C, 2.16 kg) was used in the experiments. This polymer grade was selected because it contains only basic additives like stabilizers and an acid scavenger, but it does not contain any nucleating agent or any other special additives. Con- sequently, its structure can be manipulated within a wide range, which is advantageous in our study.
3.2
|Sample preparation
iPP films with various average spherulite sizes (10– 60μm) and sample thicknesses (100–400μm) were pre- pared. Sample thickness was adjusted by the thickness of the frame (100–500μm) of the compression molding machine (Fontijne SRA 100 apparatus, 200C, 5 min and 2.3–2.4 MPa) and the average spherulite size was adjusted by the crystallization temperature. The samples were crystallized isothermally at 110, 113, 124, and 129C after eliminating the thermal and mechanical prehistory at 220C for 5 min. The supermolecular structure of the samples during the crystallization process was monitored using a Zeiss Axioscope polarized optical microscope (POM) equipped with a Leica DFC 320 digital camera and the micrographs were recorded by a Leica IM50 software.
In order to gain experimental results which are com- parable with the simulation, the size of the spherulites and the thickness of the samples were measured. In the case of the thinner samples, the average size of the spher- ulites could be easily measured on micrographs taken by POM at the end of the crystallization.
In the case of thicker samples, the individual spheru- lites overlap in the microscope images, because their size
is much smaller than the thickness of the sample. There- fore, in this way the observation of spherulite boundaries and determination of spherulite sizes are difficult if not impossible at all. Consequently, the reliability of the opti- cal technique decreases with increasing sample thickness.
To solve this problem, the average spherulite size in the case of thicker samples was measured on pictures taken with Keyence VHX 2000E digital optical microscope (DOM) from the surface of potassium permanganate etched samples. Etching was used to remove the amor- phous layer from the surface to reveal the spherulitic structure of the sample clearly. Permanganetic etching solution according to Basset et al.49] was used and the etching time was 24 hr at room temperature for all samples.
In the case of samples crystallized at 110C, the maxi- mum cooling rate of the hot stage was not fast enough to crystallize the samples isothermally under POM. There- fore, to determine the spherulite size at 110C we used samples which were crystallized on a different hot stage, which unfortunately could not be placed under the microscope because of its larger size, but we were able to perform isothermal crystallization at lower temperatures.
The spherulite size of the samples which were prepared in this way was determined on the etched surface of the sample with white light interferometry using a Bruker ContourGT K0-X optical profilometer.
Sample thickness was also measured with the same equipment. First, the height of the sample holder was measured near to the two opposing sides of the samples, after that, the height was also measured at the center of the sample. Sample thickness is obtained if we subtract the height of the sample from the average height of the sample holder. After the thickness measurements, the samples were coated with index-matching immersion oil to suppress surface scattering. Haze measurements were carried out with a PerkinElmer Lambda 1050 spectropho- tometer equipped with a 150 mm snap-in integrating sphere. In order to obtain the haze value, total transmit- tance and diffuse scattering were measured between 360 and 800 nm. The measured haze was then calculated as the ratio of diffuse and total transmittance, according to ref. [13].
3.3
|Characterization
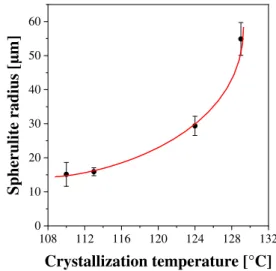
Figure 2 presents the average value and the standard deviation of the spherulite radius as a function of crystal- lization temperature. Spherulite radii were obtained from POM and DOM measurements. The results of these mea- surements have been used to determine the size of the radially anisotropic spheres used for the simulation of
haze based on the schematic model presented in Fig- ure 1b. In Figure 2, there is a clear trend of increasing average spherulite radius as a function of the crystalliza- tion temperature and we may expect more pronounced haze with increasing spherulite size. Normally, the stan- dard deviation also increases as a function of the temper- ature, but in our case, there is a deviation from this trend at 110C, which is due to the larger uncertainty of the dif- ferent measuring techniques applied at lower temperature.
The nucleus density can be calculated from the microscopic measurements using the thickness of the thin film and the number of the spherulites in the mea- sured area. The calculated nucleus density is presented in Figure 3. In the case of samples crystallized at 110C, the nucleus density cannot be determined. This is due to the same reason explained in the Sample Preparation section.
According to earlier studies and our earlier experiences, nucleus density is a very important factor, which influ- ences predominantly the optical properties.[4,50]It can be seen from the experimental results, that the higher is the crystallization temperature the smaller is the nucleus density.
4
|R E S U L T S A N D D I S C U S S I O N 4.1
|Model validation
For the validation of the proposed model, the model results were compared with the experimental results.
First, the measured haze value at a wavelength of 632.8 nm was compared to that of the calculated ones at different thicknesses and average spherulite radii. We
108 112 116 120 124 128 132 0
10 20 30 40 50 60
suidar etilurehpS[μm]
Crystallization temperature [°C]
F I G U R E 2 Spherulite radius as a function of crystallization temperature (the solid curve is a guide to the eye) [Color figure can be viewed at wileyonlinelibrary.com]
have used the sample thicknesses and nucleus densities from prior measurements. In the calculations, the volume of the birefringent spheres was set to be equal to the aver- age spherulite volume calculated by Equation (2). The background refractive index was set to 1.5 corresponding to the isotropic refractive index of unoriented iPP film in the visible wavelength range.[17]
In order to obtain the birefringence, a curve fitting procedure was performed ensuring the best fit for a given sample set. The best fit was found to be at a birefringence ofΔn= 0.00179. This is in a good agreement with those reported by Padden et al.,[17]who measured the birefrin- gence of different spherulites and also classified iPP spherulites into four discrete types on the basis of their optical properties and the conditions of growth.
Corresponding to our case under 134C crystallization temperature, the so-called “type I”spherulite is the pre- dominant form, which exhibits positive birefringence in the radial direction averaging about 0.003 ± 0.001 in magnitude.[17] Figure 4. shows reasonably good agree- ment between the experimental and theoretical data (with a root mean squared error [RMSE] of 3.65 percent- age point) which supports that our novel approach can be used for prediction of haze in polycrystalline materials.
We have also tested the validity of our model in the whole visible wavelength range. A fitting procedure was again applied to compare the measured and calculated curves at known film thicknesses between 97 and 355μm and an average spherulite radius of 16μm. In addition to the geometrical parameters, we have also kept the back- ground refractive index fixed at value 1.5. In order to take the wavelength dependence of the material parameters
into account we have employed a very simple linear rela- tionship between the birefringence and wavelength:
Δnð Þλ =a+bðλ−λ0Þ ð14Þ
where λ0= 0.6328μm. Therefore we have used the two parametersa andb to fit the model to the experimental results. The curve fitting was performed for the different thicknesses simultaneously to give the best average fit for all thicknesses. The best fitting values for a andb were 0.00165 and 0.00114μm−1, respectively, with a RMSE of 2.43 percentage point. Figure 5 shows the comparison of the calculated and measured haze as a function of wave- length. The dots demonstrate the measured data and the solid lines represent the calculated results.
Apparently, the fitted curves show the same charac- teristic wavelength dependence and are in average in very good agreement with the experimental ones. The deviation between the calculated and measured values can be attributed to several factors: The first and most measured structural parameters like spherulite radius, nucleus density, and sample thickness. Due to sample inhomogeneity they can slightly deviate from the reported values at the measurement spot. Moreover, the spherulite radius and nucleus density measurements have an additional uncertainty due to the limited mea- surement area of the microscope field of view. Second, the size of the spherulites in the real samples follows a relatively wide distribution whereas the model uses con- stant spherulite size. Third, the model deviates from the experiments by using perfect spheres as scattering centers instead of filling out the whole space with birefringent material.
108 112 116 120 124 128 132 1012
1013 1014
ytisned suelcuN[1/m3 ]
Crystallization temperature [°C]
F I G U R E 3 Nucleus density (n0) as a function of
crystallization temperature (the solid curve is a guide to the eye) [Color figure can be viewed at wileyonlinelibrary.com]
100 200 300 400
0 20 40 60 80 100
2.67E+13 1/m3 1.35E+13 1/m3 3.50E+12 1/m3
]%[ ezaH
Thickness [μm]
F I G U R E 4 Fitted (solid lines) and measured haze (dots) values as a function of sample thickness at different spherulite radii (shown in legend) and wavelength of 632.8 nm [Color figure can be viewed at wileyonlinelibrary.com]
In spite of the minor difference between the model and measurements, these results indicate clearly that our model describes the similar trend in wavelength and thickness dependency of the haze compared to the exper- imental results. The proposed procedure can be used to estimate the radial birefringence, that is very hard to measure directly.
4.2
|Influence of sample parameters on haze
The haze value depends on the spherulite radius, nucleus density, sample thickness, refractive index, and birefrin- gence. In the following we show how our model can be used to investigate the influence of the birefringence and spherulite radius on the optical properties.
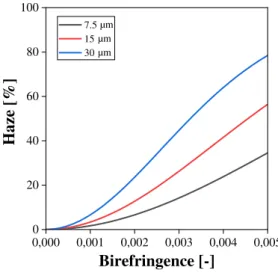
Figure 6 shows the calculated haze as a function of birefringence for different spherulite sizes. The results are calculated at a wavelength of 632.8 nm and sample thickness of 100μm. The haze increases very quickly with increasing birefringence even at very small spheru- lites sizes. It should be noted that haze monotonously grows with the spherulite size as well.
The haze values were also calculated as a function of spherulite radius for different birefringence values. The results are shown in Figure 7, being in agreement with earlier publications.[3,50,51,52]
This indicates clearly that our approach harmonizes with the trends observed ear- lier on other real samples and further supports our new model for the description of the light scattering in semi- crystalline polymers.
5
|C O N C L U S I O N S
The aim of the present research was to develop a new model which describes the light scattering of real poly- mer samples, especially polymer films, using Mie scatter- ing theory of radially anisotropic spheres. The results of this investigation show that the simulated haze is in reasonably good agreement with the experimentally
350 400 450 500 550 600 650 700 750 800 0
20 40 60 80
100 Measurement
97 μm μm μm μm 215 312 355
]%[ ezaH
Wavelength [nm]
F I G U R E 5 The measured (dots) and fitted (solid lines) haze as a function of wavelength. Sample thickness is shown in the legend. The nucleus density is 267E + 13 1/m3[Color figure can be viewed at wileyonlinelibrary.com]
μm μm μm
0,000 0,001 0,002 0,003 0,004 0,005 0
20 40 60 80 100
]%[ ezaH
Birefringence [-]
7.5 15 30
F I G U R E 6 Calculated haze (H) as a function of the
birefringence at different spherulite sizes shown in the legend. The wavelength of light is 632.8 nm, thickness of the sample 100μm, background refractive index 1.5 [Color figure can be viewed at wileyonlinelibrary.com]
10 20 30 40 50
0 20 40 60 80 100
]%[ ezaH
Radius [μm]
0,001 0,002 0,003 0,004 0,005
F I G U R E 7 Radius dependence of the calculated haze at different birefringence values (shown in legend). The wavelength of light is 632.8 nm, thickness of the sample 100μm, background refractive index 1.5 [Color figure can be viewed at
wileyonlinelibrary.com]
recorded values and the dependency of the haze on the sample thickness and spherulite size can be also handled accurately. This indicates clearly that our approach har- monizes with the trends observed earlier on real samples.
We have compared the experimentally recorded haze values to the simulated ones and used a curve fitting pro- cedure to estimate the birefringence of the samples in the visible wavelength range. Accordingly, it was found that the birefringence of the scattering unit in polypropylene is in the range of 0.0015–0.0020, which is in good agree- ment with the literature experimental data.
The wavelength dependence of the simulated haze is very close to the experimental results. The deviation between the calculated and measured values can be explained by the inhomogeneity of the sample, the devia- tion of real geometrical parameters from the reported ones at the measurement spot, the uncertainty of the radius measurements due to the limited measurement area of the microscope field of view and the use of con- stant sphere size and perfect spheres as scattering centers instead of filling out the whole space with birefringent material.
The developed model can be used to estimate the haze value at different birefringence and geometrical parameters of the samples. It was proven clearly that haze increases very quickly with increasing birefringence even at very small spherulites sizes. The model can be further improved by providing more accurate data for the nucleus density values. The model can also be easily updated to take into account the size dispersion of the spherulites yielding more precise calculation results.
These findings can help us to better understand the nature of light scattering in semicrystalline polymers and also can help us in the further development of clarifiers.
A C K N O W L E D G M E N T S
The authors would like to express their gratitude to the Ministry of Human Capacities for the New National Excellence program grant. In addition one of the Authors (Alfréd Menyhárd) would like to express his indebtedness for the financial support of János Bolyai Scholarship of the Hungarian Academy of Sciences. Supported by the ÚNKP-19-4-BME-419 New National Excellence Program of the Ministry of Human Capacities and by the János Bolyai Research Scholarship of the Hungarian Academy of Sciences. The research reported in this article has also been supported by the National Research, Development and Innovation Fund (TUDFO/51757/2019-ITM, The- matic Excellence Program).
O R C I D
János Molnár https://orcid.org/0000-0002-1460-2948
R E F E R E N C E S
[1] M. B. Johnson, G. L. Wilkes, A. M. Sukhadia, D. C. Rohlfing, J. Appl. Polym. Sci.2000,77(13), 2845.
[2] R. S. Stein, inPolymer Blends, Vol. 1, Chapter 9 (Ed: R. P.
Donald), Academic Press, New York1978, p. 393.
[3] G. H. Meeten Ed., Optical properties of polymers, Elsevier Applied Science Publishers Ltd, London1986.
[4] A. Menyhárd, M. Gahleitner, J. Varga, K. Bernreitner, P.
Jääskeläinen, H. Øysæd, B. Pukánszky,Eur. Poly. J.2009,45 (11), 3138.
[5] B. Pukánszky, inPolypropylene, Vol. 1 (Ed: J. Karger-Kocsis), Springer, Dordrecht1999, p. 554.
[6] K. Hoffmann, G. Huber, D. Mäder,Macromol. Symp. 2001, 176, 83.
[7] M. Tenma, M. Yamaguchi,Polym. Eng. Sci.2007,47(9), 1441.
[8] M. Blomenhofer, S. Ganzleben, D. Hanft, H. W. Schmidt, M.
Kristiansen, P. Smith, K. Hoffmann,Macromolecules2005,38 (9), 3688.
[9] T. A. Shepard, C. R. Delsorbo, R. M. Louth, J. L. Walborn, D.
A. Norman, N. G. Harvey, R. J. Spontak,J. Poly. Sci. Part B:
Polym. Phys.1997,35(16), 2617.
[10] M. Kristiansen, M. Werner, T. Tervoort, P. Smith, M.
Blomenhofer, H. W. Schmidt, Macromolecules2003, 36(14), 5150.
[11] M. Tenma, N. Mieda, S. Takamatsu, M. Yamaguchi,J. Polym.
Sci. Part B: Polym. Phys.2008,46(1), 41.
[12] Z. Horváth, B. Gyarmati, A. Menyhárd, P. Doshev, M.
Gahleitner, J. Varga, B. Pukánszky, RSC Adv. 2014, 4(38), 19737.
[13] Z. Horváth, A. Menyhárd, P. Doshev, M. Gahleitner, G. Vörös, J. Varga, B. Pukánszky, ACS Appl. Mater. Interf.2014,6(10), 7456.
[14] T. Okihara, L. Cartier, G. A. van Ekenstein, B. Lotza,Polymer 1999,40(1), 1.
[15] B. Wunderlich, Macromolecular physics, Vol. 2, Academic Press, London1976.
[16] F. Horváth, J. Molnár, A. Menyhárd, inPolypropylene Hand- book: Morphology, Blends and Composites(Eds: J. K. Kocsis, T.
Bárány), Springer International Publishing, Cham2019; Chap- ter 3, p. 121.
[17] F. J. Padden Jr., H. D. Keith,J. Appl. Phys.1959,30(10), 1479.
[18] J. Molnár, A. Jelinek, A. Maloveczky, J. Móczó, A. Menyhárd, J. Thermal Anal. Calorim.2018,134(1), 401.
[19] P. Debye, A. M. Bueche,J. Appl. Phys.1949,20(6), 518.
[20] G. Ross,Optica Acta: Int. J. Opt.1968,15(5), 451.
[21] G. Ross,Optica Acta: Int. J. Opt.1969,16(5), 611.
[22] G. Porod,Kolloid-Zeitschrift1951,124(2), 83.
[23] G. Porod,Kolloid-Zeitschrift1952,125(1), 51.
[24] G. Porod,Kolloid-Zeitschrift1952,125(2), 108.
[25] P. Debye, H. R. Anderson, H. Brumberger,J. Appl. Phys.1957, 28(6), 679.
[26] D. J. Blundell, G. W. Longman, G. D. Wignall, M. J. Bowden, Polymer1974,15(1), 33.
[27] M. Goldstein, E. R. Michalik,J. Appl. Phys.1955,26(12), 1450.
[28] R. S. Stein, P. R. Wilson,J. Appl. Phys.1962,33(6), 1914.
[29] G. Ross, D. A. Jarvis,Optica Acta: Int. J. Opt.1980,27(3), 359.
[30] G. Ross, D. A. Jarvis,Optica Acta: Int. J. Opt.1980,27(3), 371.
[31] H. C. van de Hulst,Light Scattering by Small Particles, New York, Dover Publications1981.
[32] M. Kerker, in The Scattering of Light and Other Electromag- netic Radiation(Ed: E. M. Loebl), Academic Press, New York 1969.
[33] G. H. Meeten,Optica Acta: Int. J. Opt.1982,29(6), 759.
[34] R. S. Stein, R. Prud'Homme,J. Polym. Sci. Part B: Polym. Lett.
1971,9(8), 595.
[35] R. S. Stein, M. B. Rhodes,J. Appl. Phys.1960,31(11), 1873.
[36] T. Hashimoto, R. S. Stein,J. Poly. Sci. Part A-2: Polym. Phys.
1971,9(10), 1747.
[37] R. E. Prud'Homme, D. Yoon, R. S. Stein,J. Polym. Sci.: Polym.
Phys. Ed.1973,11(6), 1047.
[38] D. Y. Yoon, R. S. Stein,J. Poly. Sci: Polym. Phys. Ed.1974,12 (4), 763.
[39] R. E. Prud'Homme, R. S. Stein, J. Poly. Sci.: Poly. Phys. Ed.
1973,11(7), 1357.
[40] D. Y. Yoon, R. S. Stein,J. Polym. Sci.: Poly. Phys. Ed.1974,12 (4), 735.
[41] T. Ishikawa, R. S. Stein,Poly. J.1976,8(4), 369.
[42] T. Hashimoto, A. Todo, H. Kawai,J. Polym. Sci.: Polym. Phys.
Ed.1973,11(1), 149.
[43] C. F. Bohren,Am. J. Phys.1987,55(6), 524.
[44] C. F. Bohren, D. R. Huffman, Absorption and Scattering of Light by Small Particles, John Wiley & Sons, Weinheim2008.
[45] C. W. Qiu, L. Gao, J. D. Joannopoulos, M. Soljačic,Laser Pho- ton. Rev.2010,4(2), 268.
[46] C. W. Qiu, B. Luk'yanchuk,J. Opt. Soc. Am.2008,25(7), 1623.
[47] C. Petr,J. Opt. Soc. Am.1973,63(11), 1467.
[48] https://github.com/osepsi/mie-radial-aniso (accessed: January 6, 2020).
[49] D. C. Bassett, R. H. Olley,Polymer1982,23, 1707.
[50] A. Menyhárd, M. Bredács, G. Simon, Z. Horváth,Macromole- cules2015,48(8), 2561.
[51] K. Bernland, J. G. P. Goossens, P. Smith, T. A. Tervoort,J.
Polym. Sci. Part B: Polym. Phys.2016,54(9), 865.
[52] C. Maier, T. Calafut,Polypropylene: The Definitive User's Guide and Databook, William Andrew, New York1998.
How to cite this article:J Molnár, Ö Sepsi, G Erdei, S Lenk, F Ujhelyi, A Menyhárd. Modeling of light scattering and haze in semicrystalline
polymers.J Polym Sci. 2020;58:1787–1795.https://
doi.org/10.1002/pol.20200027