CORVINUS UNIVERSITY OF BUDAPEST
D
EPARTMENT OFM
ATHEMATICALE
CONOMICS ANDE
CONOMICA
NALYSIS Fövám tér 8., 1093 Budapest, Hungary Phone: (+36-1) 482-5541, 482-5155 Fax: (+36-1) 482-5029 Email of corresponding author: zsolt.darvas@uni-corvinus.huWebsite: http://web.uni-corvinus.hu/matkg
W ORKING P APER
2012 / 1
R EAL E FFECTIVE E XCHANGE R ATES FOR
178 C OUNTRIES : A N EW D ATABASE
Zsolt Darvas
19 March 2012
1
Real effective exchange rates for 178 countries: A new database
Zsolt Darvas 19 March 2012
Abstract
We use data on exchange rates and consumer price indices and the weighting matrix derived by Bayoumi, Lee and Jaewoo (2006) to calculate consumer price index-based REER. The main novelties of our database are that (1) it includes data for 178 countries –many more than in any other publicly available database– plus an external REER for the euro area, using a consistent methodology; (2) it includes up-to-date REER values, such as data for January 2012; and (3) it is relatively easy to calculate REER against any arbitrary group of countries. The annual
database is complete for 172 countries and the euro area for 1992-2011 and data is available for six other countries for a shorter period. For several countries annual data is available for earlier years as well, eg data is available for 67 countries from 1960. The monthly database is
complete for 138 countries for January 1995-January 2012, and data is also available for 15 other countries for a shorter period. The indicators calculated by us are freely downloadable and will be irregularly updated.
Keyword: effective exchange rates JEL code: F31
The first version of this database including monthly data was created for the paper ‘The threat of currency wars: a European perspective’ (Bruegel Policy Contribution 2010/12) by Zsolt Darvas and Jean Pisani-Ferry, which was prepared for the request of the European Parliament.
The annual database was created for the author’s contribution to the World Bank ECA report Golden growth: restoring the lustre of the European Economic Model, edited by Indermit Gill and Martin Raiser. The author is grateful Guntram Wolff for comments and Dana Andreicut for research assistance.
Zsolt Darvas is Research Fellow at Bruegel and the Institute of Economics of the Hungarian Academy of Sciences, and Associate Professor at Corvinus University of Budapest (email:
zsolt.darvas@uni-corvinus.hu).
2 1. Introduction
The real effective exchange rate (REER), which measures the development of the real value of a country’s currency against the basket of the trading partners of the country, is a frequently used variable in both theoretical and applied economic research and policy analysis. It is used for a wide variety of purposes, such as assessing the equilibrium value of a currency, the change in price or cost competitiveness, the drivers of trade flows, or incentives for reallocation production between the tradable and the non-tradable sectors.
The REER is calculated from the nominal effective exchange rate (NEER) and a measure of the relative price or cost between the country under study and its trading partners. The most popular price and costs measures are consumer prices (CPI), producer prices (PPI), GDP deflator, unit labour costs (ULC) – see Chinn (2006) for a nice overview of the theoretical underpinnings of various REER measures. In this working paper we focus on CPI-based REERs.
Due to the importance of the REER in economic research and policy analysis, several institutions, such as the World Bank, the Eurostat, the BIS, the OECD, just to name a few, publish various REER indicators which are freely downloadable1. Altogether, these institutions publish data for 113 countries. Of these 113 countries, the World Bank reports data for 109, the BIS for 61, Eurostat for 42 and the OECD for 34 at the monthly and for 40 at the annual frequency. The countries for which data are available include all advanced and several emerging and developing countries. However, different databases may have different methodologies and even the 109 countries included in the World Bank database miss several dozen countries of the world.
Our database has three novelties. First, using a consistent methodology, we calculate CPI- based REER for 178 countries (plus the euro area) for annual data and for 153 countries (plus the euro area) for monthly data. Second, we calculate the REER for all countries up to date, eg in the current vintage of the database we calculate up to January 2012. Third, it is relatively easy to calculate REER against any arbitrary group of countries – what is needed for this is a re-scaling of the weighting matrix. For example, in Darvas and Pisani-Ferry (2010) we have calculated the REER against 19 emerging countries that entered the so called ‘currency war’, ie those countries with floating exchange rate regimes which introduced various policy measures during the global financial and economic crisis in order to limit the appreciation of their currencies, or even to achieve exchange rate depreciation.
In the next section we discuss our methodology and the data sources, which is followed by the presentation of our results in Section 4, where we also compare our calculation to data included in some other databases.
1 The IMF International Financial Statistics database also includes REERs, as well as nominal USD exchange rates and consumer price indices which are used to calculate the REERs, but this database is not freely available and therefore we do not rely on this database. A quick comparison suggests that the IMF and World Bank data are very similar.
3 2. Methodology
The REER is calculated as:
) foreign ( t
t t
t CPI
CPI REER NEER ⋅
= ,
where REERt is the real effective exchange rate of the country under study against a basket of currencies of trading partners, CPIt is the consumer price index of the country under study,
∏ ( )
=
=
N
i
w t t
i
i S NEER
1
) (
is the nominal effective exchange rate of the country under study, which is in turn the geometrically weighted average of S
( )
i t, the nominal bilateral exchange rate between the country under study and its trading partner i (measured as the foreign currency price of one unit of domestic currency),∏ ( )
=
=
N
i
w t t
i
i CPI CPI
1 ) foreign
( ()
is the geometrically weighted average of CPI indices of trading partners, CPI
( )
i t is the consumer price index of trading partner i, w(i) is the weight of trading partner i, and N is the number of trading partners considered. The weights sum to one, ie 11 )
( =
∑
= N
i
wi . We use geometrically weighted averages, because this is the most frequently used method in the literature.
We use time-invariant weights and therefore our REER index is measured against a basket of countries, which composition is constant. This basket is representative of foreign trade in 1998- 2003 (see Bayoumi, Lee and Jaewoo, 2006). Most likely the IMF and the World Bank use the same weighting matrix for calculating REERs for 1990-2012, but for earlier years the IMF and the World Bank used another weighting.
Our use of time-invariant weights could be considered a weakness for our long-run calculation for 1960-2011. Some authors argue for time-varying weights due to the time-varying characteristic of the composition of foreign trade. Adopting time-varying weights make sense, but they have a serious drawback as well, which can be easily illustrated by a simple three- country example.
Suppose country A trades with countries B and C and initially the bilateral real exchange rate (RER) between A and B and between A and C is flat, because the nominal exchange rate changes fully compensate for the inflation differential (if any). The real effective exchange rate (REER) of A against the basket of B and C is also flat, irrespective whether the weights of A and B are constant or time-varying. Suppose that the bilateral RER between A and B temporality changes, but a few years later returns to its initial value, while the bilateral RER between A and C continues to remain flat. If weights are time-varying and have changed during the temporary period when the bilateral RER between A and B oscillated, then the REER against the basket of B and C will not return to its initial value, even though both bilateral RERs against B and C have returned to their initial values. But when the weights are constant, such an anomaly does not arise.
4 3 Data
3.1 Time periods and country coverage
We collected consumer price index and USD exchange rate data only from publicly available data sources for the longest available time periods both at the annual and monthly frequencies, for the largest number of countries.
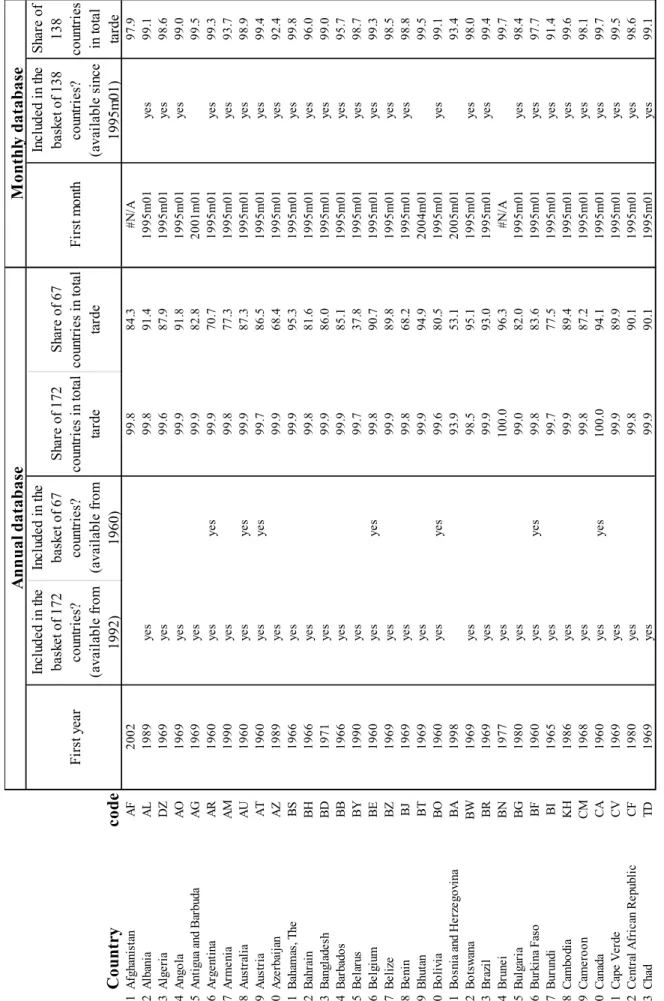
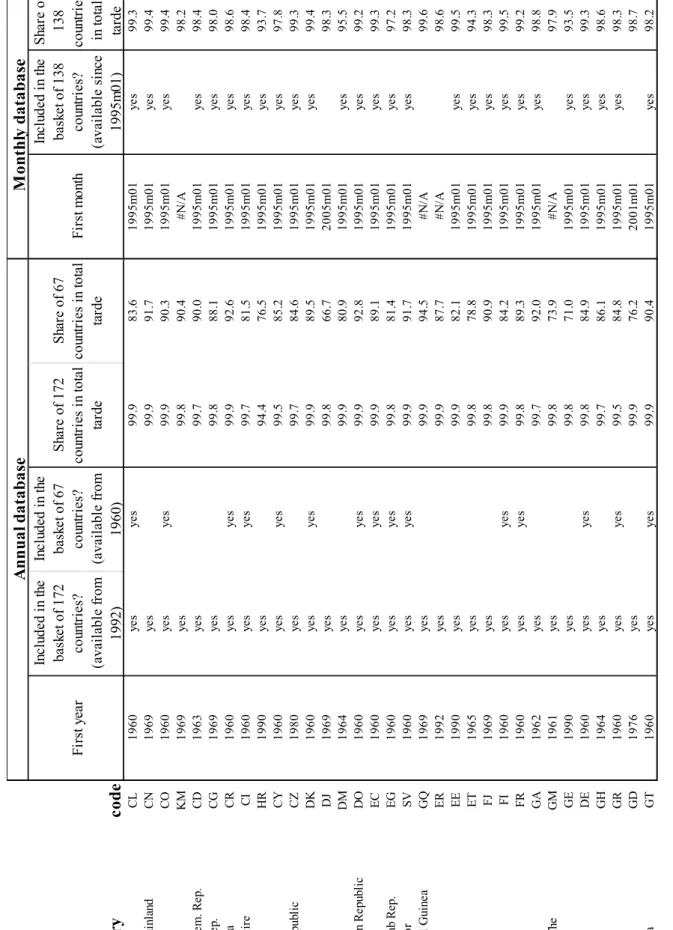
Our annual database covers the period 1960-2011, but there are missing data for earlier years for several countries. Therefore, we calculate REERs against two baskets: the broader basket is calculated against 172 trading partners and the narrower basket is calculated against 67 countries. The borad REER is available for the 172 countries for 1992-2011, plus the data is available for 6 other countries and the euro area for a shorter period. The narrow REER is available for the 67 for 1960-2011, and for shorter periods for the other countries in our sample.
Our monthly database covers the period January 1995 to January 2012 and we calculate the REER against 138 countries. This monthly REER is available for these 138 countries and the euro area for the January 1995 to January 2012 period and for additional 15 countries for a shorter period. We note that the World Bank reports monthly REER data for the following countries, but we could not calculate because of missing consumer price index data: Equatorial Guinea, Gambia, Guyana, Kiribati, Lesotho, Nicaragua, Saint Kitts and Nevis, Solomon Islands and Zambia2.
3.2 The weight matrix
When assessing the role of one country as a competitor in another country’s foreign trade, then not just the bilateral export and import shares matter, because the two countries compete on third markets as well. For example, Czech produces compete with Slovakian producers not just in the Czech Republic and Slovakia, but in many other countries, such as Austria and Germany. Bayoumi, Lee and Jaewoo (2006) derived a weight matrix for 184 countries that considers competition in third markets that we use.
We also calculate an external REER for the euro area, by considering the first 12 euro-area members. In order to derive the weights for this euro-area-12 aggregate, we have first normalised the weights of non-euro-area-12 countries to one for each of the 12 countries. Then we weighted these normalised weights with the share of total trade of the 12 countries, ie Germany’s share is 28.3 percent, Greece’s share is 1.7 percent, etc. A weakness of this approach is that we use total trade (that also includes intra-euro-area trade) and not only extra- euro area trade to derive the shares of the 12 countries, though the bias arising from this simplification may not be large. Observe on Figure 1.c that the REER for the euro area that we have calculated is rather similar to the REER published by three institutions (World Bank, Eurostat, BIS), though there is a further difference: we consider the first 12 euro-area countries, while eg Eurostat published data for the euro area 17. The main reason for considering the first 12 countries only is that allows the calculation of this REER for a longer period.
2 Nevertheless all of these countries but Kiribati are included in our annual database.
5 3.3 Exchange rates
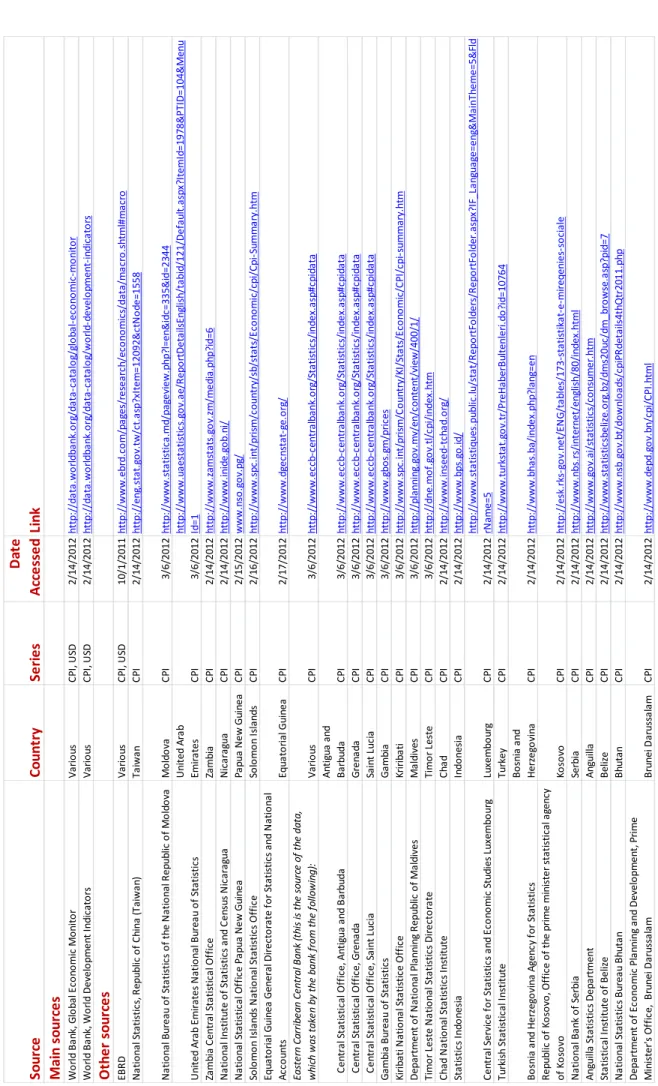
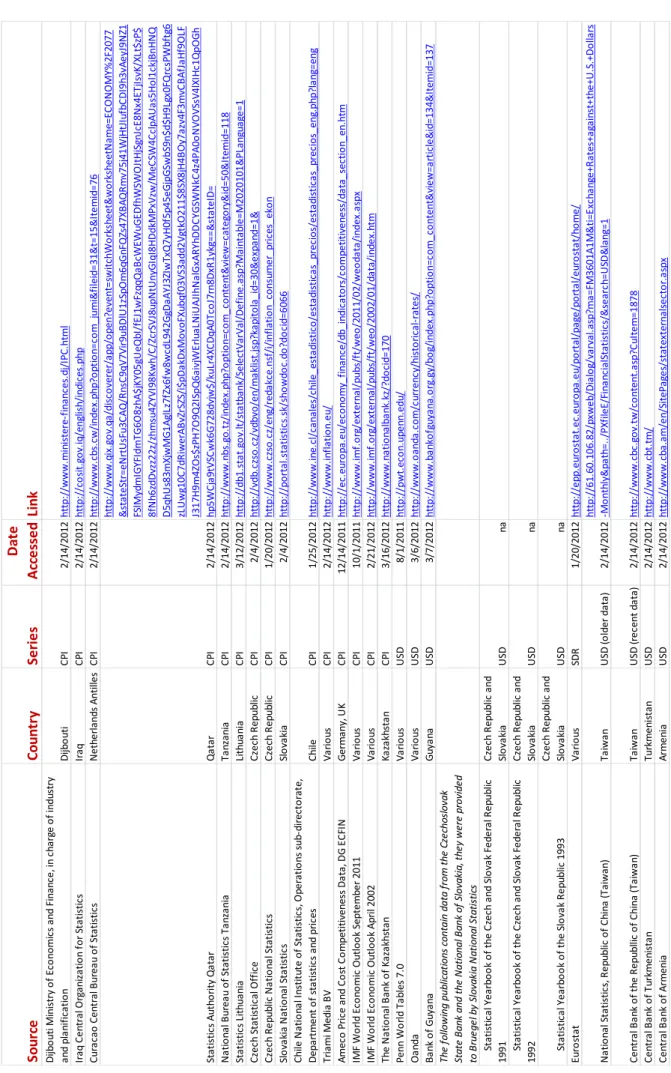
We have collected exchange rate against the US dollar and used them to calculate the bilateral rates between all countries. The main source is the on-line databases of the World Bank, which are freely accessible. The annual data starting in 1960 (when available) is from the World Development Indicators, while monthly data starting in January 1991 (when available) is from the Global Economic Monitor. Data was downloaded on 14 February 2012 for the current vintage of our database. Table 1 lists the web addresses of these and all other databases we use.
For euro-area members, since their entry to the euro area, we multiplied the euro/dollar exchange rate with the conversion rate to the euro in order to extend the exchange rate of their earlier national currencies. Pre-euro national currency exchange rates were available from Eurostat against the ECU that we used, along with the USD exchange rate against the ECU, to calculate the USD rate of pre-euro national currencies.
Taiwan’s exchange rate is from the National Statistics of Republic of China (Taiwan).
Filling the gaps of missing annual data
Missing annual data is taken form the Penn World Tables (PWT) for Albania (1970-92), Argentina (1950-61), Armenia (1990-92), Belarus (1990-94), Bosnia & Herzegovina (1990- 96), Bulgaria (1975-85), Cambodia (1974-89), Croatia (1990-91), Czechoslovakia – used for the Czech Republic and Slovakia (1980-92), Estonia (1991-92), Georgia (1990-95), Indonesia (1960-66), Iraq (1991-2003), Kazakhstan (1990-93), Kyrgyz Republic (1990-93), Latvia (1987-91), Lithuania (1987-91), Macedonia – former Yugoslav Republic (1990-93), Mauritania (2004), Moldova (1990-94), Mongolia (1970-90), Montenegro (1990-98), Poland (1960-94), Russia (1990-92), Serbia (1990-96), Slovenia (1990), Somalia (1990-2009), Tajikistan (1990-91), Turkmenistan (1990-2009), Ukraine (1987-92), Uzbekistan (1990-2009), Venezuela (1960-63), Vietnam (1970-85), and Yemen (1969-89). In each case we have carefully checked that later data of the PWT and WDI are identical or almost identical.
Data is taken form the EBRD for Azerbaijan (1989-1991).
For Turkmenistan, 2010-11 data is taken from the Central Bank of Turkmenistan.
For Somalia the PWT has data till 2009, but Oanda data is available more recently as well, which is different from the PWT data for the overlapping period. For example, monthly Oanda suggests a fixed rate to the dollar in 1995-2002 at a rate about 2,620, while the annual PWT data indicates depreciation from 5,725 in 1995 to 20,025 in 2002. For 2010 and 2011 we calculated the percent change in Oanda data and used these percent changes to extend the PWT data for 2010-11.
Filling the gaps of missing monthly data
For Georgia the monthly data is available from October 1995, although the annual average is available for the full year. We set a fixed valued for January-September so that the average of the twelve months of the year equals the annual average. Note that the exchange rate was practically unchanged from October 1995 to till mid-1998 –and quite close to the annual average for 1995 – and hence assuming a constant rate for the first nine month of 1995 may not be distorting.
6
For most countries the World Bank database included data for January 2012 at the time we accessed it. But for a few countries data for some recent months was missing. In order to fill these gaps, we used some other data sources. For Armenia, the 2012m01 figure is from the Central Bank of Armenia. For Turkmenistan 2009-2012 data is from the Central Bank of Turkmenistan (earlier data is not available at the monthly frequency). Oanda data is used for Afghanistan (2011m12-2012m01), Cambodia (2012m01), Cape Verde (2012m01), Laos (2011m03-2012m01), Liberia (2011m06-2012m01), Libya (2012m01), Somalia (1995m05- 2012m01), Tanzania (2011m10-2012m1), Tajikistan (2011m10-2012m1), Zambia (2011m10- 2012m1) and Myanmar (2012m01). For Myanmar the World Bank and Oanda data were not identical for the overlapping period when both were available and hence we chained the 2012m01 Oanda data to the World Bank data.
For Syria we used World Bank data but note that data from Oanda (available for 1995-2012) and Reuters (1999-2012) are very close to each other and fluctuate between 40 and 58 during 1995-2012, but rather different from the from the World Bank data, which has a constant value of 11.225 since 1988).
3.4 Consumer prices
Similarly to exchange rates, the primary source of consumer price data are also the World Development Indicators (annual) and Global Economic Monitor (monthly) databases of the World Bank. However, for annual CPI data we also used data from the (freely accessible) IMF’s September 2011 World Economic Outlook database, which includes data for 1980- 2016, ie it also includes forecasts.
Filling the gaps of missing annual data
Annual inflation rate was taken from EBRD for the following countries and time periods, which was chained backward to the World Bank data: Armenia (1989-1993), Georgia (1990- 94), Kazakhstan (1991-92), Kyrgyz Republic (1991-92), Latvia (1989-92), Lithuania (1989- 92), FYI Macedonia (1989-91), Russia (1989-92), Serbia (1994-97), Slovenia (1989-92), Azerbaijan (1990-92), Belarus (1989-92), Tajikistan (1989-92), Ukraine (1989-92), Turkmenistan (1989-92), Uzbekistan (1989-92), Montenegro (1995-2000) and Estonia (1989- 1991).
For Aruba, data is missing for 1981-83, but in order to have a continuous time series, we assumed that the annual inflation rate was equal from 1980 to 1984.
For Chile the data is from the National Statistical Institute of Chile.
For the Czech Republic data for 1960-1995 is from the Czech statistics office, and refers to the Czech Socialist Republic before 1993.
For Slovakia data for 1970-92 is from the Statistical Office of the Slovak Republic, and refers to Czechoslovakia up to 1990 and the Slovak Socialist Republic for 1991-92.
For Dominica data for 1979 is missing and we assumed that the annual inflation rate in 1979 and 1980 was equal in order to have a continuous time series.
7
For Germany and UK data before 1980 is from the AMECO.
For South Korea (1960-1966) and Slovenia (1981-88) the data is from http://www.inflation.eu/
For Taiwan the data is from the National Statistics of the Republic of China (Taiwan).
The (freely accessible) 2002 IMF World Economic Outlook was used for obtaining pre-1980 data for the following countries: Angola (1970-80), Antigua and Barbuda (1970-80), Bangladesh (1970-80), Belize (1970-80), Benin (1970-80), Bhutan (1970-80), Botswana (1970-74), Brazil (1970-80), Cape Verde (1970-80), Chad (1970-80), China mainland (1970- 80), Comoros (1970-80), Djibouti (1970-91), Dominica (1980), Equatorial Guinea (1970-80), Guinea (1970-80), Guinea-Bissau (1970-80), Guyana (1970-80), Hong Kong (1970-80), Lao (1970-80), Lebanon (1970-80), Malawi (1970-80), Maldives (1970-80), Mali (1970-80), Moldova (1990-92), Namibia (1970-90), Nicaragua (1970-88), Republic of Congo (1970-80), Romania (1970-80), Sierra Leone (1970-80), Tunisia (1970-80), Vanuatu (1970-76) and Zambia (1970-80).
For Hungary, pre-1972 data is from the Central Statistical Office of Hungary.
Filling the gaps of missing monthly data
Data from the national central statistical office was used for Anguilla, Belize, Bhutan, Bosnia and Herzegovina, Grenada, Kosovo, Netherlands Antilles, Moldova, Papua New Guinea, Serbia, St. Lucia, Turkey and United Arab Emirates. Only quarterly data was available for Anguilla, Belize, Bhutan and Papua New Guinea that we interpolated to monthly frequency.
For Djibouti the source is the Ministry of Economy and Finance. The source of the 1995 data of Indonesia is http://www.inflation.eu/. For Serbia, the CPI was available from 2007, but the cost of living index was available from 2001 (which was very similar to the CPI in the overlapping period when both indices are available). We have chained the earlier cost of living index to CPI.
For Kazakhstan and Lithuania the World Bank database included improper series because they indicated a deflation from 1994 to 2011, while other datasets indicated very significant cumulative inflation during this period. Therefore, we have used data from the National Bank of Kazakhstan and the Statistics Lithuania instead.
For Qatar (December 2007 and December 2008) and the United Arab Emirates (December 2007) the respective end-year inflation rates from the IMF WEO were used to calculate the CPI by chaining the inflation rates to later monthly data available from the central statistical officies. This allowed us to normalise the REERs we calculate to December 2007 = 100 for all countries.
For most countries the World Bank database included data for December 2011 at the time we accessed it, but the January 2012 data is not available, and for a number of countries one or more months are missing for 2011 as well. In order to fill these gaps and also approximate the REER for January 2012, we assume that the latest available data on the 12-month inflation has remained unchanged since. Consumer prices do not use to change abruptly and in the short-run the nominal exchange rate is the main determinant of movement in REER. Therefore, this approximation should not distort much the results.
8 4. Results
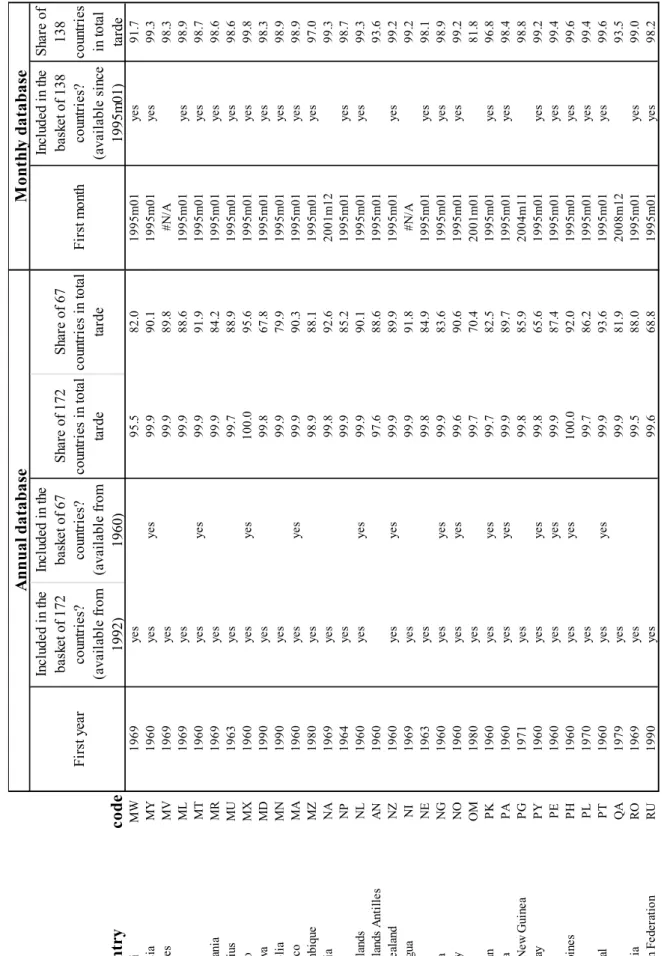
Table 2 shows the composition of our two baskets of countries used for annual and the one basket used for monthly calculations. It also shows the share of these baskets of trading partners in total trade, where total trade is represented by the total of the 184 countries included in Bayoumi, Lee and Jaewoo (2006).
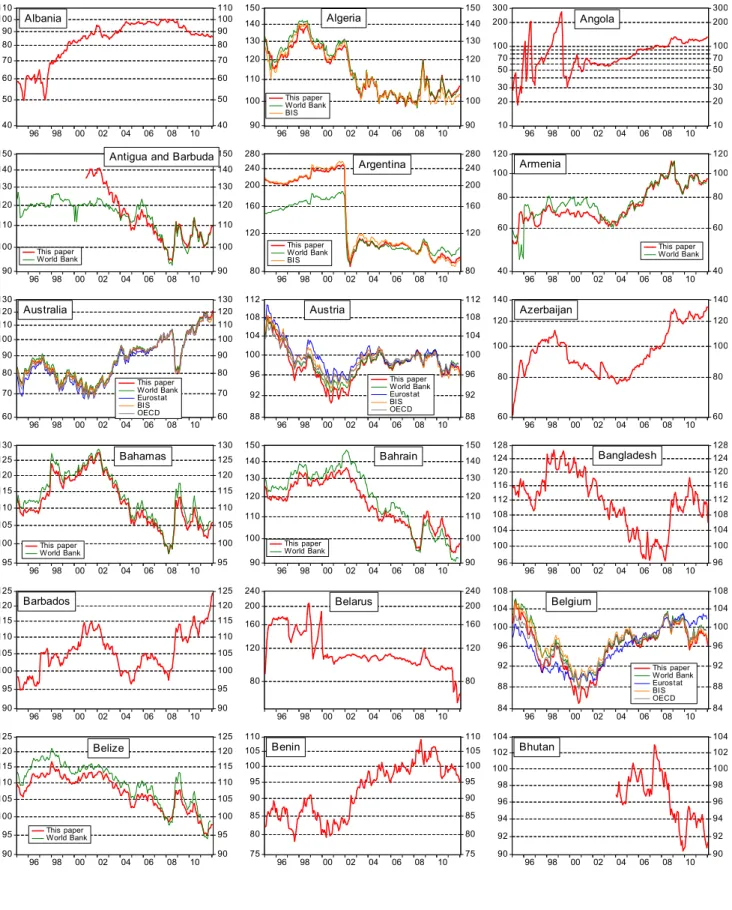
Figure 1 (after Table 2) shows our monthly REER for January 1995-January 2012 in comparison with data from World Bank, Eurostat, BIS and OECD (whenever available)3, while Figure 2 shows annual data for 1960-2011 in comparison with the World Bank and OECD data (whenever available). Since the 67 countries for which data is available since 1960 comprise a large share of trade of several countries of the world, there is not much difference between the REER calculated against 172 and against 67 countries for a large number of countries.
For those countries for which data is available in other data sources the REER calculated by us is similar to data in other databases.
5. Access and updating
The REERs and NEERs calculated in this working paper are freely downloadable at the following website:
http://www.bruegel.org/publications/publication-detail/publication/716-real-effective- exchange-rates-for-178-countries-a-new-database/
Note that we do not republish the underlying CPI and USD exchange rate data, which are freely available from the data sources listed in Table 1.
The dataset will be irregularly updated.
References
Bayoumi, Tamim, Jaewoo Lee and Sarma Jayanthi (2006) ‘New Rates from New Weights’, IMF Staff Papers 53(2), 272-305
http://www.imf.org/External/Pubs/FT/staffp/2006/02/pdf/bayoumi.pdf
Chinn, Menzie D. (2006) ‘A Primer on Real Effective Exchange Rates: Determinants,
Overvaluation, Trade Flows and Competitive Devaluation’, Open Economies Review 17, 115–
143 http://www.springerlink.com/content/n4745m7668314m72/
Darvas, Zsolt and Jean Pisani-Ferry (2010) ‘The Threat of Currency Wars: A European Perspective’, Policy Contribution 2010/12, Bruegel
http://www.bruegel.org/publications/publication-detail/publication/461-the-threat-of-currency- wars-a-european-perspective/
3 Eurostat publishes REERs against various baskets: we plot the broadest indicator, which is calculated against 41 trading partners except for Belgium and Luxembourg, for which this indicator is not available and therefore we use the REER against 34 partners. BIS publishes REERs against a broad (61 countries) and a narrow (26 countries) baskets and we plot the broader one.
9
Table 1.a Data sources SourceCountrySeries
Date AccessedLink Main sources World Bank, Global Economic MonitorVariousCPI, USD2/14/2012http://data.worldbank.org/data-catalog/global-economic-monitor World Bank, World Development IndicatorsVariousCPI, USD2/14/2012http://data.worldbank.org/data-catalog/world-development-indicators Other sources EBRDVariousCPI, USD10/1/2011http://www.ebrd.com/pages/research/economics/data/macro.shtml#macro National Statistics, Republic of China (Taiwan)TaiwanCPI2/14/2012http://eng.stat.gov.tw/ct.asp?xItem=12092&ctNode=1558 National Bureau of Statistics of the National Republic of MoldovaMoldovaCPI3/6/2012http://www.statistica.md/pageview.php?l=en&idc=335&id=2344 United Arab Emirates National Bureau of Statistics
United Arab EmiratesCPI3/6/2012
http://www.uaestatistics.gov.ae/ReportDetailsEnglish/tabid/121/Default.aspx?ItemId=1978&PTID=104&Menu Id=1 Zambia Central Statistical OfficeZambiaCPI2/14/2012http://www.zamstats.gov.zm/media.php?id=6 National Institute of Statistics and Census NicaraguaNicaraguaCPI2/14/2012http://www.inide.gob.ni/ National Statistical Office Papua New GuineaPapua New GuineaCPI2/15/2012www.nso.gov.pg/ Solomon Islands National Statistics OfficeSolomon IslandsCPI2/16/2012http://www.spc.int/prism/country/sb/stats/Economic/cpi/Cpi-Summary.htm Equatorial Guinea General Directorate for Statistics and National AccountsEquatorial GuineaCPI2/17/2012http://www.dgecnstat-ge.org/ Eastern Carribean Central Bank (this is the source of the data, which was taken by the bank from the following):VariousCPI3/6/2012http://www.eccb-centralbank.org/Statistics/index.asp#cpidata Central Statistical Office, Antigua and BarbudaAntigua and BarbudaCPI3/6/2012http://www.eccb-centralbank.org/Statistics/index.asp#cpidata Central Statistical Office, GrenadaGrenadaCPI3/6/2012http://www.eccb-centralbank.org/Statistics/index.asp#cpidata Central Statistical Office, Saint LuciaSaint LuciaCPI3/6/2012http://www.eccb-centralbank.org/Statistics/index.asp#cpidata Gambia Bureau of StatisticsGambiaCPI3/6/2012http://www.gbos.gm/prices Kiribati National Statistice OfficeKriribatiCPI3/6/2012http://www.spc.int/prism/Country/KI/Stats/Economic/CPI/cpi-summary.htm Department of National Planning Republic of MaldivesMaldivesCPI3/6/2012http://planning.gov.mv/en/content/view/400/1/ Timor Leste National Statistics DirectorateTimor LesteCPI3/6/2012http://dne.mof.gov.tl/cpi/index.htm Chad National Statistics InstituteChadCPI2/14/2012http://www.inseed-tchad.org/ Statistics IndonesiaIndonesiaCPI2/14/2012http://www.bps.go.id/ Central Service for Statistics and Economic Studies LuxembourgLuxembourgCPI2/14/2012http://www.statistiques.public.lu/stat/ReportFolders/ReportFolder.aspx?IF_Language=eng&MainTheme=5&Fld rName=5 Turkish Statistical InstituteTurkeyCPI2/14/2012http://www.turkstat.gov.tr/PreHaberBultenleri.do?id=10764 Bosnia and Herzegovina Agency for Statistics
Bosnia and HerzegovinaCPI2/14/2012http://www.bhas.ba/index.php?lang=en Republic of Kosovo, Office of the prime minister statistical agency of KosovoKosovoCPI2/14/2012http://esk.rks-gov.net/ENG/tables/173-statistikat-e-mireqenies-sociale National Bank of SerbiaSerbiaCPI2/14/2012http://www.nbs.rs/internet/english/80/index.html Anguilla Statistics DepartmentAnguillaCPI2/14/2012http://www.gov.ai/statistics/consumer.htm Statistical Institute of BelizeBelizeCPI2/14/2012http://www.statisticsbelize.org.bz/dms20uc/dm_browse.asp?pid=7 National Statistics Bureau BhutanBhutanCPI2/14/2012http://www.nsb.gov.bt/downloads/cpiPRdetails4thQtr2011.php Department of Economic Planning and Development, Prime Minister's Office, Brunei DarussalamBrunei DarussalamCPI2/14/2012http://www.depd.gov.bn/cpi/CPI.html