FED-batch wastewater treatment
Barnab as B aba and Tam as Karches
pDepartment of Hydraulic Structures, Faculty of Water Science, National University of Public Service, Bajcsy-Zsilinszky u. 12-14, H-6500 Baja, Hungary
Received: November 17, 2020 • Revised manuscript received: December 5, 2020 • Accepted: December 7, 2020 Published online: April 22, 2021
ABSTRACT
Sequencing batch reactor systems in wastewater treatment is widely applied activated sludge technology.
The system performance is not only dependent on the raw sewage quality and biochemical processes, but the flow pattern within the reactor has a significant impact on the treatment itself. The varying stages of the operation require different fluid flow conditions; biological stage shall be appropriately mixed, whereas low velocity zones favor the phase separation. The aim of this study was to improve sequencing batch reactor operation in order to optimize the treatment efficiency. Numerical fluid dynamic simulations were performed to determine the substrate and biomass homogeneity inside the reactor at the biological phase and the rate of the decantation was estimated at the sedimentation phase.
The settling model was calibrated by field measurements. The results revealed that the hydraulic effi- ciency of the reactor was 87% and the achievable settled solid content was 0.9%.
KEYWORDS
batch reactor, fluid dynamics, mixing efficiency, sedimentation, wastewater treatment
1. INTRODUCTION
Sequencing Batch Reactor (SBR) gained popularity in wastewater treatment since it is a single tank design, flexible system, with relatively easy automation [1]. The system configuration is quite simple; the tank has an inlet and outlet structure, mechanical mixers and diffusers. The flow within the tank can be plug flow or completely stirred. The treatment stages are separated by time. One cycle includesfilling, mixing without aeration, mixing with aeration, sedimentation, decantation stages. As a start of a cycle the primary treated sewage is introduced to the system. In municipal wastewater treatment the plant influent is continuous but unevenly distributed following a diurnal pattern. Prior the batch reactor an equalization tank may be required depending on the actualflow variation and the number of the parallel applied SBRs. In large capacity plants, where more than three tanks are in operation, the incomingflow may befilled to one of the units at all time and then equalization tank is not required. Biological stage is designated to remove organic matter and nutrients from the wastewater. Based on the presence of oxygen three conditions can be distinguished; anaer- obic, anoxic and aerobic. Aerobic microorganisms are responsible for organic component degradation and nitrification, anoxic condition is required for denitrification, whereas anaerobic-aerobic varying environment facilitate the phosphorous accumulating biomass growth [2].
Presence of Dissolved Oxygen (DO) in water phase is created by diffusers, but when the aeration is turned off, anoxic and anaerobic conditions develop due to the oxygen con- sumption of the biomass. Mixing is a key element in the process, since it provides the mass transport between the microorganisms and bulk flow. Mixing can be induced by the aeration, mechanical mixers or introducing fluid discharge through an inlet structure. As a conse- quence, different processes provide the mixing at the various stages. During filling, the discharged flow, during anaerobic and anoxic stages the mechanical mixers, whereas the
Pollack Periodica • An International Journal for Engineering and Information Sciences
16 (2021) 2, 61–66
DOI:
10.1556/606.2020.00302
© 2020 The Author(s)
ORIGINAL RESEARCH PAPER
pCorresponding author.
E-mail:karches.tamas@uni-nke.hu
aerobic stage utilizes both the mechanical mixers and the aeration power. At sedimentation and decantation no mix- ing mechanism is provided.
The structure of the biomass can be suspended (activated sludge), attached to a carrier (biofilm) or granulated. Acti- vated sludge technology applies suspended biomass, it con- tains the microorganisms. Biofilm reactor can be operated as batch system. The attached biomass is submerged and the biofilm shall not dry out during the process, therefore the decantation volume in one cycle shall be less than 30% of the total volume. Removal efficiencies of organic matter in biofilm SBRs are reported to be more enhanced compared to traditional SBRs, but depending on the media it can show some disadvantages [3]. Aerobic granular sludge technology in batch operation is able to combine the high organic removal efficiency and flexible operation. Industrial waste- water rich in carbon source can be treated effectively [4–5].
In sedimentation phase there is no aeration and mixing.
During phase separation the sludge blanket level is decreasing, below the blanket the dry matter concentrates.
The supernatant–the treated water–is decanted at the end of the cycle and the thickened sludge is removed.
It can be seen from the above process description that optimization of cycle and phase times have effect on the system performance. There is evidence that the load could have been increased and energy saved by the optimization of SBR cycles [6–7]. Even the on/off control of DO can be further improved by adding airflow meter to the reactor and applying fuzzy logic [8]. However, model based optimization may lead errors, the model domain may not cover all aspects of the system, primarily the settling and microbial com- munity adaptation [9].
Mass balance based models describe the fate of the scalar variable within the reactor, predict the effluent quality in function with the input data (e.g., raw sewage characteristics, dissolved oxygen concentration, biomass amount). It has a long tradition to use Activated Sludge Models (ASM) model family [10], therefore a lot of experience is gained in model calibration and validation procedure. These models focus on biokinetic aspects of wastewater treatment and an effective tool in process sizing and in operation optimization [11].
Hydrodynamics in these models are simplified, in spite of the fact that a treatment deficiency may be derived from a hydraulic failure [12]. To reveal the fluid flow behavior within the tank Computational Fluid Dynamics (CFD) is an option, which can be coupled ASM [13]. CFD-ASM coupling have advantage in reactor model development, but computational cost related to the level of complexity, which can be handled limits its applicability [14]. Good modeling practices for CFD approach of wastewater treatment is presented in the literature [15] with an extensive state of the art overview [16]. Many applications have been developed applying robust numerical modeling, but it has still limita- tions. Thefixed density modeling in wastewater treatment is a common practice in design, but it may over predict the degree of mixing. It is unaddressed to model coupled aera- tion tank and clarifier system to predict inter connectedflow and mass transport in unsteadyflow conditions [17].
Deterministic models are widespread in wastewater treatment, but stochastic tools in water quality modeling can be popular in water management [18].
Purpose of this study is to optimize the mixing during the biological stage and determine sludge management via the predicted settled solid concentration at the end of the phase separation stage in an SBR system.
2. METHODOLOGY
Nowadays, CFD can be considered as a modern, accepted method in the design of wastewater treatment technologies, in the control of various operating conditions and in tech- nological developments. The spatial and temporal distribu- tions of the field variables determining the hydrodynamics are calculated based on the numerical solution of the gov- erning equations. The method of finite volumes is wide- spread in fluid science, which divides the flow domain into elementary volumes and thus solves the basic conservation equations of mass and momentum. CFD is able to map fine flow structures and describe multiphase flows.
Reynolds averaging of equations in space and time is the most efficient way to solve the equations, but it must be supplemented by other models describing turbulence. In this study InterMixingFOAM solver was used to solve multi- phase flow, where the main phase was water and the side phase was the sludge.
Semi-implicit method for pressure-linked equations al- gorithm was used. It is an iterative procedure for solving equations for velocity and pressure. Linear upwind differ- encing interpolation scheme was set for numerical solution.
Sludge settling characteristics were measured via field measurement. It was performed with the help of a measuring cylinder with a plastic base, the height of which is 415 mm, and its division is notched every 10 mL. Samples were taken from the operating batch reactor during the aeration cycle. The sample was poured into the measuring cylinder and the sedimentation was examined for 1 h.
During the settling time, sludge volume values were recor- ded every 5 min in order to determine a settling curve.
Linear part of a batch settling curve corresponds to the hindered settling and the phase separation velocity can be determined from the slope of the linear part. Parameters derived from a dilution experiment are able to describe batch settling curves provided the rate of descent of the sludge blanket is moderate. Vesilind type of sedimentation fails if there is a rapid sludge blanket movement [19]. The reason for the discrepancy is the compression zone pro- cesses. At flocculent settling the particles could aggregate and no freeflow conditions are met. Theflocculent settling coefficient used as a model calibration parameter, but the threshold of flocculation method proved to be an efficient tool to determine this parameter mechanistic. It describes the minimum solids concentration needed to get a signifi- cant formation offlocs settling and one of the most signif- icant advantages of this approach is that it can easily and routinely be measured by plant operators [20].
Numerical model shall reflect to this velocity via the effective particle diameter (Stokes equivalent diameter), therefore the model calibration procedure was on trial and error basis, an adjustment of the particle diameter to get the same result as in the field experiment.
Thickened sludge concentration is an important parameter in sewage treatment plant operation since it determines the sludge line performance directly. Settling can be enhanced by adding external material [21], but in most of the cases the suspended matter aggregates and thickens. Sludge settling shall be facilitated at settling stage, and it should be avoided at the biological stage, therefore two modeling alternatives were investigated.
Initial condition of the first model setup was a homoge- nized two-phase system and the sludge blanket height and thickened sludge concentration were estimated in function with time.
The second model run was steady-state with one me- chanical mixer in operation. This setup corresponds to anoxic condition and the sludge homogenization and hy- draulic efficiency of the reactor were investigated. The reactor shape was rectangular with a dimension of 6 m depth, 13 m of width and 21 m of length in each simulation.
The activated sludge material properties were set to constant values (viscosity: 0.01 kg/(m∙s), density: 1,050 kg/m3) based on literature [22].
3. RESULTS AND DISCUSSION
Settleability test was performed in laboratory scale; the procedure was outlined in Section 2. The sludge blanket level decrease was plotted in function with time. The results are shown inFig. 1. The settling curve presents the four separate stages of settling. The first few seconds is the initial phase, where the particles are positioning, which is followed by the free and hindered settling (1–30 min). After half an hour starts the transition phase (approx. 30–45 min) and at high solid concentration the compression phase (45 min <). One hour later from the measurement start there is no visible changes in sludge concentration. This test was performed three times, but only at one initial solid concentration, there was no dilution necessary. The results from the three tests
were similar; therefore it can be used for model calibration.
Calibration method was detailed in the previous section; the equivalent diameter was determined iteratively in the CFD simulations.
Unsteady simulations were performed with a time step of 1 second assuming 4.5 g/L initial homogenized solid matter concentration. Sedimentation time was 1 h and the concentration increase was observed at the bottom of the reactor as the time advances. The best fit with the field experiment was detected when particle size of 0.2 mm was set.
This calibrated effective diameter is in the range of previous reports [23]. Sludge thickening can be seen in Fig. 2, where the sludge concentration was plotted in func- tion of time. It can be stated that the initial solid concen- tration doubled at the end of the process. The value of 9,000 mg/L can be converted to dry sold content of 0.9%, which reflects to a good settling process.
During the settling stage multilayered concentration profile developed, at the top of the tank the supernatant dry solid concentration was below the effluent limit of 35 mg/L.
This decantation layer had a height of 1.5 m (at 4.5 m height) measured from the bottom of the tank. The sludge blanket level, which visually separate the lower part of the supernatant and the sludge, was at 3.5 m from the bottom.
Investigation of the concentration change inside the sludge was not scope of the study, excess sludge removal took place near the bottom region.
Steady-state model run was performed in order to check whether the submersible mixer with 4.65 kW power was enough to keep the biomass in floating. The mixer was installed at 5 m depth as it is noted inFig. 3with a black circle. Figure 3 shows the spatial distribution of sludge concentrations, the mixer is marked by a black circle. The simulation assumes a constant biomass amount in the reactor, and the biokinetic processes were not covered in this study.
Two phenomena can be observed; one is the deviation of the solid concentration due to the assymetric mixing con- centration, the other one is the amount of particles, which tends to settle out. The sludge concentration near the mixer is less than in the other part of the reactor due to the high
Fig. 1.Sludge blanket level decrease in a settle-ability test
Fig. 2.Sludge concentration increase at the bottom of the reactor during settling phase
movement of the fluid flow. The desired average solid concentration of 4.5 mg/L is achieved at the middle of the tank.
Particle density is above the average at the opposite wall of the mixer. The reason of the accumulation is the horizontal movement of flow, which transport the parti- cles to the opposite side of the reactor, where the wall functions as a boundary. From process point of view, the acceptable range of the biomass concentration is 4–6 g/L and most of the operating volume falls within this range (seeFig. 4).
Biomass concentration above 6 g/L in activated sludge system does not favor settling, whereas the low concen- tration (<4 mg/L) is not an effective use of the tank vol- ume.
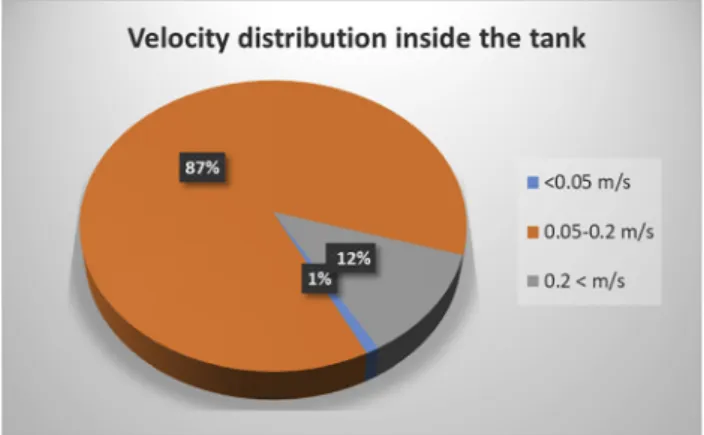
Analyzing the flow velocity magnitudes (Fig. 5) it can be seen that 87% of the total volume has an optimal movement since the velocities in these zones are between 5 and 20 cm/s.
In low flow zones (<5 cm/s) dead-zones may develop and high flow zones decrease the hydraulic residence time causing insufficient biological activity. Thus the overall hy- draulic performance of the reactor is 87%, which is considered to be appropriate.
The submersible mixer kept the biomass floating even without aeration, and unwanted sedimentation was not detected, therefore the installed power was acceptable. Both model calculations shows a good agreement with field data and satisfy the purpose of this investigation, but it has some limitations and opportunity for further improvements as follows:
‒ Average effective particle diameter was assumed for solid particles; however the size distribution could be taken into account applying Population Balance Model PBM, which is a sub-model, which can be integrated to the CFD approach. PBM is capable of the following investigations:
particle breakage and collision, aggregation,flocculation, de-flocculation [24];
‒ Non-Newtonian behavior of the sludge was not taken into account. In this study sludge is a fluid, for which the governing equations of fluid flow can be described.
Newtonian approach of sludge is valid only until its dry content does not exceed 2–3%;
‒ Pressure jump was prescribed for the submersible mixer instead of a deforming mesh. Pressure difference between the two sides of the mixer has correlation of the volu- metricflow through the mixer. If the mixing power is the available input data, the pressure difference can be determined trial and error basis since the flow is an output data of the simulation. More detailed mixer models resolve the simulation domain more accurately, and the numerical grid would change in time as the mixer is rotating. It would cost a lot of computational resource, but the actual movement of the mechanical device is represented.
4. CONCLUSION
Batch wastewater treatment applications proved its effi- ciency in the last few decades. System is used at all scales.
Large capacity municipal wastewater treatment utilizes robustness of such systems, whereas the pre-treatment of industrial wastewater takes advantage of the easy operation.
Fig. 4.Solid concentration distribution inside the tank Fig. 3.Sludge concentration contours during biological stage
Fig. 5.Velocity distribution inside the tank
There are examples for decentralized wastewater treatment solutions, since the maintenance of the single unit is much easier compared to multi-tank systems.
In this study two critical stages of the processes were highlighted, one is biological stage without aeration, where a single submersible mixer should keep the biomass in suspended form, the other is the sedimentation phase, which goal was to thicken the sludge effectively. In this investigation CFD tools were applied to predict the flow field within the tank. CFD analysis required to build a mesh and set the initial and boundary conditions of the gov- erning fluid flow equations. Multiphase simulation approach had a calibration demand on the sludge particle characteristics; the effective particle size was calculated based on the settling curve of the sludge performed in field measurements at laboratory scale.
As a result, the sludge blanket height and concentration profile was determined, which serves data for operation;
the decantation height shall go not under 4.5 m measured from the bottom of the tank and the achievable dry solid content was 0.9%. During the biological stage the nearly 90% of the volume operates as designed, no significant short-circuit or dead-zones are expected, and the biomass would not settle out. This study revealed the direct usage of the model results in practice, however further improve- ments of the model approaches and deeper understanding of the ongoing processes are necessary for answering more detailed problems.
ACKNOWLEDGEMENTS
This work has been undertaken as a part of a project founded by the EFOP-3.6.1-16-2016-00025 institutional development of water management in tertiary education aiming at intelligent specialization.
REFERENCES
[1] S. Mace and J. Mata-Alvarez,“Utilization of SBR technology for wastewater treatment: an overview,”Ind. Eng. Chem. Res., vol. 41, no. 23, pp. 5539–5553, 2002.
[2] C. M. Lopez-Vazquez, C. M. Hooijmans, D. Brdjanovic, H. J.
Gijzen, and M. C. M. van Loosdrecht, “Factors affecting the microbial populations at full-scale enhanced biological phos- phorus removal (EBPR) wastewater treatment plants in The Netherlands,” Water Res., vol. 42, no. 10–11, pp. 2349–2360, 2008.
[3] F. Fang, J. S. Guo, Y. Qin, B. F. Luo, and G. H. Yang,“Start-up research of one-step autotrophic nitrogen removal process in SBR biofilm reactor,”China Water Wastewater, vol. 22, no. 1, pp. 58– 61, 2006.
[4] D. P. Cassidy and E. Belia,“Nitrogen and phosphorus removal from an abattoir wastewater in a SBR with aerobic granular sludge,”Water Res., vol. 39, no. 19, pp. 4817–4823, 2005.
[5] N. Schwarzenbeck, R. Erley, and P. A. Wilderer, “Aerobic granular sludge in an SBR-system treating wastewater rich in particulate matter,” Water Sci. Technol., vol. 49, no. 11–12, pp. 41–46, 2004.
[6] G. Andreottola, P. Foladori, and M. Ragazzi,“On-line control of a SBR system for nitrogen removal from industrial wastewater,” Water Sci. Technol., vol. 43, no. 3, pp. 93–100, 2001.
[7] S. G. E. R€onner-Holm, I. K. Alves, H. Steinmetz, and N. C. Holm,
“Optimization potential for a SBR plant based upon integrated modeling for dry and wet weather conditions,”Water Sci. Tech- nol., vol. 60, no. 8, pp. 1953–1964, 2009.
[8] S. Puig, L. Corominas, A. Traore, J. Colomer, M. D. Balaguer, and J. Colprim, “An on-line optimisation of a SBR cycle for carbon and nitrogen removal based on on-line pH and OUR: the role of dissolved oxygen control,”Water Sci. Technol., vol. 53, no. 4–5, pp. 171–178, 2006.
[9] G. Sin, K. Villez, and P. A. Vanrolleghem, “Application of a model-based optimization methodology for nutrient removing SBRs leads to falsification of the model,” Water Sci. Technol., vol. 53, no. 4–5, pp. 95–103, 2006.
[10] M. Henze, W. Gujer, T. Mino, and M. C. van Loosdrecht,Acti- vated Sludge Models ASM1, ASM2, ASM2d and ASM3. IWA Publishing, 2000.
[11] M. Wichern, M. L€ubken, and H. Horn,“Optimizing sequencing batch reactor (SBR) reactor operation for treatment of dairy wastewater with aerobic granular sludge,” Water Sci. Technol., vol. 58, no. 6, pp. 1199–1206, 2008.
[12] T. Karches,“Effect of internal recirculation on reactor models in wastewater treatment,” WIT Trans. Ecol. Environ., vol. 228, pp. 145–153, 2018.
[13] J. Alex, S. G. E. R€onner-Holm, M. Hunze, and N. C. Holm,“A combined hydraulic and biological SBR model,” Water Sci.
Technol., vol. 64, no. 5, pp. 1025–1031, 2011.
[14] G. C. Glover, C. Printemps, K. Essemiani, and J. Meinhold,
“Modeling of wastewater treatment plants-how far shall we go with sophisticated modeling tools?”Water Sci. Technol., vol. 53, no. 3, pp. 79–89, 2006.
[15] E. Wicklein, D. J. Batstone, J. Ducoste, J. Laurent, A. Griborio, J. Wicks, S. Saunders, R. Samstag, O. Potier and I. Nopens,“Good modeling practice in applying computationalfluid dynamics for WWTP modeling,”Water Sci. Technol., vol. 73, no. 5, pp. 969– 982, 2016.
[16] R. W. Samstag, J. J. Ducoste, A. Griborio, I. Nopens, D. J. Batstone, J. D. Wicks, S. Saunders, E. A. Wicklein, G. Kenny and J. Laurent,
“CFD for wastewater treatment: an overview,”Water Sci. Technol., vol. 74, no. 3, 549–563, 2016.
[17] A. M. Karpinska and J. Bridgeman, “CFD-aided modelling of activated sludge systems–A critical review,”Water Res., vol. 88, pp. 861 879, 2016.
[18] M. Kardos and L. Koncsos,“A stochastic approach for regional- scale surface water quality modeling,” Pollack Period., vol. 12, no. 1, pp. 17–27, 2017.
[19] A. Vanderhasselt and P. A. Vanrolleghem,“Estimation of sludge sedimentation parameters from single batch settling curves,” Water Res., vol. 34, no. 2, pp. 395–406, 2000.
[20] K. N. Ngo, T. Van Winckel, A. Massoudieh, B. Wett, A. Al-Omari, S. Murthy, I. Takacs and H. De Clippeleir,“Towards more pre- dictive clarification models via experimental determination of
flocculent settling coefficient value,”Water Res., Paper no. 116294, 2020.
[21] D. B. Sandor, A. Szabo, E. Fleit, Z. Bakacsi, and G. Zajzon,“PVA- PAA hydrogel micro-carrier for the improvement of phase sepa- ration efficiency of biomass in wastewater treatment,” Pollack Period., vol. 12, no. 2, pp. 91–102, 2017.
[22] O. Shelestina and H. Ratnaweera,“Optimization of the sedimen- tation tank with CFD simulation,”Selected Publications from the Water Harmony Project: Water Research and Technology.
[Online]. Available: http://www.waterh.net/wp-content/uploads/
2015/10/Article_25.pdf, 2015. Accessed: Nov. 10, 2020.
[23] I. Seyssiecq, J. H. Ferrasse, and N. Roche, “State-of-the-art:
rheological characterization of wastewater treatment sludge,” Biochem. Eng. J., vol. 16, no. 1, pp. 41–56, 2003.
[24] A. Ding, M. J. Hounslow, and C. A. Biggs,“Population balance modelling of activated sludgeflocculation: Investigating the size dependence of aggregation, breakage and collision efficiency,” Chem. Eng. Sci., vol. 61, no. 1, pp. 63 74, 2006.
Open Access. This is an open-access article distributed under the terms of the Creative Commons Attribution 4.0 International License (https://creativecommons.org/
licenses/by/4.0/), which permits unrestricted use, distribution, and reproduction in any medium, provided the original author and source are credited, a link to the CC License is provided, and changes–if any–are indicated. (SID_1)